Monthly Datasets of Global Marine NPP at 9 km Based on MODIS and ABPM Model (2003-2012)
Tao, Z.* Zhou, X. Ma, S.
State Key Laboratory of Remote Sensing Science, Institute of Remote Sensing and Digital Earth, Chinese Academy of Sciences, Beijing 100101, China
Abstract: The research of ocean primary productivity is important for understanding the global ecosystem health, biogeochemical cycles and climate change. The global ocean primary productivity dataset was developed based on the monthly remote sensing products of MODIS (phytoplankton absorption coefficient, euphotic depth, diffuse attenuation coefficient at 490nm and photosynthetically available radiation) from 2003 to 2012 with the model support from phytoplankton absorption model of ocean primary productivity (ABPM). The dataset includes monthly global ocean primary productivity data. The total cover periods of the data are ten years, 120 months and the spatial resolution is 9 km. To test the quantitative inversion accuracy, the research team collected the data of three fixed sites and three on deck monitoring sites to verify the accuracy of the dataset results. Three fixed sites are Hawaii (USA), Bermuda (Atlantic), California (USA). Three on deck monitoring sites are Atmospheric Dynamics and Fluxes in the Mediterranean Sea (DYFAMED), Antarctic Marine Living Resources Program (AMLR) and Antarctic Marine Living Resources Program (AMLR). Verification results demonstrate that there is more accuracy of global ocean primary productivity calculated by the ABPM model. The dataset can reflect the spatial and temporal variations of ocean biological carbon fixation in the process of global sea surface carbon cycle. So, it can be used as a basic reference data for the research of the global carbon cycle, climate change and biological resources potential productivity.
Keywords: global; ocean; primary productivity; remote sensing monitoring; monthly data
1 Introduction
Marine phytoplankton photosynthesis is one of the driving forces and the basis of the marine ecosystem cycle, which plays an important role in global biogeochemical cycles in ocean and has a profound impact on the global carbon cycle and climate change[1–2]. Photosynthesis uses the energy in sunlight to fix carbon dioxide (CO2) into organic material. Aquatic photosynthetic plants use some of their newly formed carbon products immediately for energy and maintenance. The remaining photosynthetic products are available for plant growth or consumption by the heterotrophic community. We refer to this “available” carbon as net primary production (NPP), The NPP in the ocean plays a profound role in the global carbon cycle that about 46% of total net primary production on earth comes from the ocean[3]. Therefore, rapid and accurate monitoring of marine primary productivity is important for the global carbon cycle research, ocean carbon cycle research, local marine ecological management and marine fisheries management. The global ocean primary productivity dataset at 9 km resolution from 2003 to 2012 was developed based on the 4 kinds of MODIS products (phytoplankton absorption coefficient[4], euphotic depth[5], diffuse attenuation coefficient at 490 nm[6] and photosynthetically available radiation[7]), which can accurately reflect the monthly space distribution of global marine primary productivity.
2 Metadata of Dataset
The summaries of the Monthly datasets of global marine NPP at 9 km based on MODIS and ABPM model (2003-2012) (GlobalMarineABMP_NPP)[8] are presented in Table 1, which includes the dataset full name, short name, authors, geographical region, year of the dataset, temporal resolution, spatial resolution, data format, data size, data files, data publisher, and data sharing policy.
Table 1 Summary of the GlobalMarineABMP_NPP metadata
|
Items
|
Description
|
|
Dataset full name
|
Monthly datasets of global marine NPP at 9 km based on MODIS and ABPM model (2003-2012)
|
|
Dataset short name
|
GlobalMarineABMP_NPP
|
|
Authors
|
Tao, Z. L-4530-2016, Institute of Remote Sensing and Digital Earth, Chinese Academy of Sciences, taozui@radi.ac.cn
Zhou, X. L-7359-2016, Institute of Remote Sensing and Digital Earth, Chinese Academy of Sciences, zhouxiang@radi.ac.cn
Ma, S. L-4533-2016, Institute of Remote Sensing and Digital Earth, Chinese Academy of Sciences, masheng@radi.ac.cn
|
|
Geographical region
|
Global
|
|
Year
|
2003-2012
|
|
Temporal resolution
|
Monthly
|
Spatial resolution
|
9 km
|
|
Data format
|
.hdf
|
Data size
|
1,064 MB
|
|
Data files
|
The global ocean primary productivity dataset includes a total of 120 monthly data archived in 120 data files of the NPP_DATA folder
Appendix 1, AttachFile1.xlsx includes the MODIS data file names and the source addresses
Appendix 2, AttachFile2.xlsx includes the file list of the dataset
Appendix 3, AttachFile3.xlsx includes the time and place (latitude and longitude) records of the three fixed sites and three on deck sites which were used for the validation
|
|
Foundation(s)
|
National Natural Foundation of China (41501389); Ministry of Science and Technology of P. R. China (OFSLRSS201509)
|
|
Data publisher
|
Global Change Research Data Publishing & Repository, http://www.geodoi.ac.cn
|
|
Address
|
No. 11A, Datun Road, Chaoyang District, Beijing 100101, China
|
|
Data sharing policy
|
Data from the Global Change Research Data Publishing & Repository includes metadata, datasets (data products), and publications (in this case, in the Journal of Global Change Data & Discovery). Data sharing policy includes: (1) Data are openly available and can be free downloaded via the Internet; (2) End users are encouraged to use Data subject to citation; (3) Users, who are by definition also value-added service providers, are welcome to redistribute Data subject to written permission from the GCdataPR Editorial Office and the issuance of a Data redistribution license; and (4) If Data are used to compile new datasets, the ‘ten per cent principal’ should be followed such that Data records utilized should not surpass 10% of the new dataset contents, while sources should be clearly noted in suitable places in the new dataset[9]
|
3 Methods
Based on the research of marine primary productivity model, a paper is already published to introduce ABPM model for ocean primary productivity using remote sensing data in 2014[10]. The dataset, calculated by the ABPM model[10], is established through model construction, parameters estimation and model validation. The model result is shown in the reference [10].
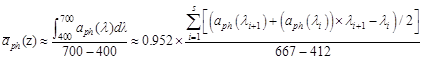
In ABPM model, photochemical reaction of absorption is regarded as a necessary step to phytoplankton photosynthesis. During this step, the amount of generated organic carbon depends on the amount of light energy absorbed through photosynthesis, thus the phytoplankton photosynthesis efficiency can be detected by monitoring the process of phytoplankton absorbing light energy. Based on this analysis, the number of photons absorbed by phytoplankton and quantum yield of photosynthesis (f moles of carbon dioxide fixed or oxygen evolved per mole of photons absorbed at irradiances which are sub-saturating to photosynthesis) can be used to calculate the ocean NPP. The basic formula of ABPM model is as
follows:
 (1)
(1)
 (2)
(2)
 (3)
(3)
 (4)
(4)
 (5)
(5)
 (6)
(6)
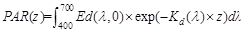
where  is the average spectral absorption coefficient of phytoplankton, ν is a photoinhibition parameter, Ed (λ, 0) is the cloud-corrected surface PAR, Kd(λ) was the spectral diffuse attenuation across the visible spectrum,
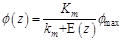
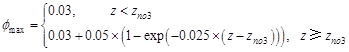
  is the value for maximum quantum yield, Km is the irradiance when
 nitracline depths (zno3) is defined as the depth of marine nitrogen concentration profile where nitrate + nitrite first exceeded 0.5 μm.
The input data of ABPM model used in this article includes four kinds of MODIS products which are Phytoplankton Absorption Coefficient (aph, Table 2), Euphotic Depth (Zeu,Table 3), Diffuse Attenuation Coefficient at 490 nm (Kd (490), Table 4) and Photosynthetically Available Radiation (PAR, Table 5) (http://oceancolor.gsfc.nasa.gov/), and monthly climatological nutrient data reported in the World Ocean Atlas (2009)[11] (http://www.nodc.noaa.gov/). MODIS data was used as the basis of the study, data file directory was listed in appendix 1 (AttachFile1.xlsx). Reference data files are directly connected to the data source URL (NASA). The dataset of global ocean primary productivity within the euphotic zone can be derived through the established NPP model by using these satellite data products and WOA nitrogen concentration data.
Table 2 Dataset of phytoplankton absorption coefficient (AttachFile1.xlsx)
Note: 120 APH files, click on data file name can obtain each data source url.
Table 3 Dataset of Euphotic Depth (AttachFile1.xlsx)
Note: 120 ZEU files, click on data file name can obtain each data source url.
Table 4 Dataset of diffuse attenuation coefficient at 490 nm (AttachFile1.xlsx)
Note: 120 KD files, click on data file name can obtain each data source url.
Table 5 Dataset of photosynthetically available radiation (AttachFile1.xlsx)
Note: 120 PAR files, click on data file name can obtain each data source url.
4 Results and Validation
4.1 Data Products
Based on the above method, monthly remote sensing monitoring dataset of global ocean primary productivity was built (GlobalMarineABMP_NPP_yyyymm.hdf). It covers 10 years from 2003 to 2012, spatial resolution is 9 km, and temporal resolution is monthly. “yyyy” represents year, “mm” represents month. Total dataset size is 1,064 MB, Dataset filenames are listed in Table 6, dataset of 2011 is shown in Figure 1.
Table 6 File list of GlobalMarineNPP (2003-2012) (2003)
|
File Name
|
Time
|
Data Size
|
|
GlobalMarineABMP_NPP_200301.hdf
|
2003.01
|
8.9 MB
|
|
GlobalMarineABMP_NPP_200302.hdf
|
2003.02
|
8.9 MB
|
|
GlobalMarineABMP_NPP_200303.hdf
|
2003.03
|
8.9 MB
|
|
GlobalMarineABMP_NPP_200304.hdf
|
2003.04
|
8.9 MB
|
|
GlobalMarineABMP_NPP_200305.hdf
|
2003.05
|
8.9 MB
|
|
GlobalMarineABMP_NPP_200306.hdf
|
2003.06
|
8.9 MB
|
|
GlobalMarineABMP_NPP_200307.hdf
|
2003.07
|
8.9 MB
|
|
GlobalMarineABMP_NPP_200308.hdf
|
2003.08
|
8.9 MB
|
|
GlobalMarineABMP_NPP_200309.hdf
|
2003.09
|
8.9 MB
|
|
GlobalMarineABMP_NPP_200310.hdf
|
2003.10
|
8.9 MB
|
|
GlobalMarineABMP_NPP_200311.hdf
|
2003.11
|
8.9 MB
|
|
GlobalMarineABMP_NPP_200312.hdf
|
2003.12
|
8.9 MB
|
Note: The structure of the 2004-2012 dataset and 2003 dataset are similar, details see AttachFile2.xlsx.

Figure 1 The distribution of global ocean primary productivity in October 2011
4.2 Validation
To test the quantitative inversion accuracy, the research team collected the data of three fixed sites and three on deck monitoring sites to verify the accuracy of the dataset results. Three fixed-sites are as follows:
(1) HOT (22.75°N, 158°S, Hawaii Ocean Time-series program)
HOT data was downloaded from http://hahana.soest.hawaii.edu/hot/. This data was selected from 2003 (11 days), 2004 (11 days), 2005 (9 days), 2006 (11 days), 2007 (9 days), 2008 (8 days), 2009 (10 days), 2010 (9 days), a total of 78 days of data for validation.
(2) BATS (31.668°N, 64.172°S, Bermuda Atlantic Time-series Study) BAT data was downloaded from http://bats.bios.edu/.
This data was selected from 2003 (11 days), 2004 (12 days), 2005 (12 days), 2006 (11 days), 2007 (12 days), 2008 (11 days), 2009 (12 days), 2010 (10 days), a total of 91 days of data for validation.
(3) CALCOFI (32.428°N, 121.783°S, California Cooperative Oceanic Fisheries Investigations)
CALCOFI data was downloaded from http://www.calcofi.org/. This data was selected from 2003 (4 days), 2004 (4 days), 2005 (4 days), 2006 (4 days), 2007 (4 days), 2008 (4 days), 2009 (4 days), 2010 (4 days), 2011 (4 days), 2012 (2 days), a total of 38 days of data for validation.
Date (year, month and day) and location (longitude and latitude) of marine measurement data for validation are listed in AttachFile3.xlsx.
Three on deck monitoring sites are as follows:
(1) DYFAMED (Atmospheric Dynamics and Fluxes in the Mediterranean Sea).
DYFAMED data was downloaded from: http://www.obs-vlfr.fr/cd_rom_dmtt/dyf_main.htm. The data consists of 30 samples
(2) AMLR (Antarctic Marine Living Resources Program)
AMLR data was downloaded from http://www.bco-dmo.org.The data consists of 171 samples
(3) WAP (Western Antarctic Peninsula-Palmer Station Long-Term Ecological Research)
WAP data was downloaded from http://pal.lternet.edu/data/. The data consists of 370 samples
Date (year, month and day) and location (longitude and latitude) of underway measurement data for validation are listed in Appendix 3 (AttachFile3.xlsx). Behrenfeld, et al. established VGPM (Vertically Generalized Production Model) model in 1997[12]. The basic principle of the model is the primary productivity of phytoplankton can be expressed by the existing biomass (chlorophyll concentration) and normalized photosynthesis rate of growth with chlorophyll. Behrenfeld etc. established another CbPM (Cabon based Production Model)m odel in 2005[13]. The basic principle of the model is that the primary productivity of phytoplankton can be expressed by the existing biomass (carbon) and photosynthesis rate of growth. Both models have realized the regular operation based on MODIS data, and provides data updates and release at http://www.science.oregonstate.edu/ocean.productivity/.
In order to verify the accuracy of ABPM model, the test results of ABPM model and the above two models were compared. The bias (B), root mean square difference (RMSD), signed unbiased RMSD (uRMSD) and correlation coefficient (R2) were calculated on six marine measured sample data sets. Accuracy of the results is listed in Table 7 and Figure 2. Overall, the accuracy ABPM model is better than the other two models.
Table 7 Comparison of precision verification results of three models
|
Sites
|
Model
|
Bias
|
uRMSD
|
RMSD
|
R2
|
|
HOT
(N=78)
|
ABPM
|
–0.06
|
–0.09
|
0.11
|
0.23
|
|
VGPM
|
–0.31
|
–0.11
|
0.33
|
0.02
|
|
CBPM
|
0.02
|
–0.12
|
0.12
|
0.01
|
|
BATS
(N=91)
|
ABPM
|
–0.14
|
–0.19
|
0.24
|
0.16
|
|
VGPM
|
–0.16
|
–0.24
|
0.28
|
0.13
|
|
CBPM
|
–0.22
|
–0.31
|
0.38
|
0.13
|
|
CALCOFI
(N=38)
|
ABPM
|
–0.02
|
–0.07
|
0.08
|
0.49
|
|
VGPM
|
0.27
|
0.11
|
0.30
|
0.25
|
|
CBPM
|
0.06
|
0.11
|
0.12
|
0.22
|
|
DYFAMED (N=30)
|
ABPM
|
0.04
|
–0.24
|
0.25
|
0.46
|
|
VGPM
|
0.15
|
–0.25
|
0.26
|
0.40
|
|
CBPM
|
–0.12
|
–0.27
|
0.27
|
0.36
|
|
AMLR (N=171)
|
ABPM
|
0.19
|
–0.17
|
0.24
|
0.72
|
|
VGPM
|
–0.17
|
–0.18
|
0.25
|
0.67
|
|
CBPM
|
0.17
|
–0.23
|
0.24
|
0.30
|
|
WAP (N=370)
|
ABPM
|
0.18
|
–0.23
|
0.29
|
0.37
|
|
VGPM
|
–0.17
|
–0.22
|
0.28
|
0.38
|
|
CBPM
|
0.15
|
–0.26
|
0.27
|
0.14
|
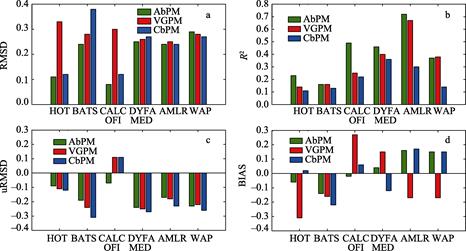
Figure 2 The comparison of inversion results of ABPM model, VGPM model and CbPM model
5 Discussion and Conclusion
Monthly datasets of global marine NPP at 9 km based on MODIS and ABPM Model introduced in this paper was constructed based on the product of USA earth observation satellite TERRA/AQUA-MODIS and nutrient data reported in the World Ocean Atlas (2009) with the support of the ABPM model. According to validation of the six global sites, the accuracy of ABPM model was better than VGPM and CbPM model. The dataset can provide an important reference for the research of the spatial and temporal distribution of the global marine primary productivity, global ecosystem health, biochemical cycle and climate change.
Author Contributions
Tao, Z. and Zhou, X. designed the study. Tao, Z., Ma, S. and Zhou, X. wrote the paper. Tao, Z. and Ma, S. completed the data processing and analysis. Ma, S. finished the data validation.
References
[1] Field, C. B., Behrenfeld, M. J., Randerson, J. T., et al. Primary production of the biosphere: integrating terrestrial and oceanic components [J]. Science, 1998, 281: 237-240.
[2] Emerson, S. Annual net community production and the biological carbon flux in the ocean [J]. Global Biogeochemical Cycles, 2014, 28 (1): 14-28.
[3] Reeburgh, W. S. Figures summarizing the global cycles of biogeochemically important elements [J]. Bulletin of the Ecological Society of America, 1997, 78: 260-267.
[4] Lee, Z. P., Carder, K. L., Arnone, R. A. Deriving inherent optical properties from water color: a multiband quasi-analytical algorithm for optically deep waters [J]. Applied Optics, 2002, 41(27): 5755-5772.
[5] Lee, et al., Euphotic zone depth: Its derivation and implication to ocean-color remote sensing [J]. Journal of Geophysical Research, 2007, 112(C3): 266-281.
[6] Mueller, J. L. SeaWiFS Algorithm for the Diffuse Attenuation Coefficient, K(490), Using Water-leaving Radiances at 490 and 555 nm [M]. Hooker, S. B. (ed). SeaWiFS Postlaunch Calibration and Validation Analyses, Part 3. NASA Goddard Space Flight Cent, Greenbelt, Maryland, 2000, 24-27.
[7] Frouin, R., Chertock, B. A. Technique for global monitoring of net solar irradiance at the ocean surface. Part I: model [J]. Journal of Applied Meteorology, 1992, 31(9): 1056-1066.
[8] Tao, Z., Zhou, X., Ma, S., et al. Monthly datasets of global marine NPP in 9 km resolution based on MODIS and ABPM model (2003-2012) [DB/OL]. Global Change Research Data Publishing & Repository, 2014. DOI: 10.3974/geodb.2014.02.03.V1.
[9] GCdataPR Editorial Office. GCdataPR Data Sharing Policy [OL]. DOI: 10.3974/dp.policy.2014.05 (Updated 2017).
[10] Ma, S., Tao, Z., Yang, X., et al. Estimation of marine primary productivity from satellite-derived phytoplankton absorption data [J]. IEEE Journal of Selected Topics in Applied Earth Observations and Remote Sensing, 2014, 7: 3084-3092.
[11] Garcia, H. E., Locarnini, R. A., Boyer, T. P., et al. World Ocean Atlas 2009, Volume 4: Nutrients (Phosphate, Nitrate, and Silicate) [M]. Levitus, S. (ed). NOAA Atlas NESDIS 71, U.S. Government Printing Office, Washington, D.C., 2010, 398.
[12] Behrenfeld, M. J., Falkowski, P. G. A consumer’s guide to phytoplankton primary productivity models [J]. Limnology and Oceanography, 1997, 42: 1479-1491.
[13] Behrenfeld, M. J., Boss, E., Siegel, D. A., et al. Carbon-based ocean productivity and phytoplankton physiology from space [J]. Global Biogeochemical Cycles, 2005, 19: GB1006, DOI: 10.1029/ 2004GB002299.