Development and Application of Sentinel-2 Canopy Chlorophyll Content (CCC) Validation Dataset of Winter Wheat
in Yucheng, Shandong of China
Wang, Z. X.* Li, F.
State Key Laboratory of
resources and environmental information system, Institute of Geographical
Sciences and Natural Resources Research, Chinese Academy of Sciences, Beijing
100101, China
Abstract: The Sentinel-2 canopy chlorophyll content (CCC) validation dataset of winter
wheat in Yucheng, Shandong of China consists of two parts: Canopy Chlorophyll Content observed in field
(CCCField = LAI ´ LCC) for 107 sample plots were observed in Yucheng,
Shandong Province from May 9 to 16, 2020, including LAI and SPAD; and Canopy
Chlorophyll Content retrieved from Sentinel-2 satellite (CCCSentinel)
with a spatial resolution of 10 m. Five correlation analyses of CCCField
and CCCSentinel shows that the coefficient of determination (R2) ranges from 0.889,9 to
0.928,0, with a RMSE of 29.267, which indicates that CCCSentinel can
explain at least 88.99% of the CCCField variation during the period
from late of April to early May. The dataset is archived in .shp, .kmz, .tif
and .xlsx data formats, and consists of 18 data files with data size of 215 MB (compressed into three files with 160 MB).
Keywords: chlorophyll content; SPAD;
LAI; Sentinel-2; field observation; winter wheat; Yucheng
DOI: https://doi.org/10.3974/geodp.2021.02.01
CSTR: https://cstr.escience.org.cn/CSTR:20146.14.2021.02.01
Dataset Availability Statement:
The
dataset supporting this paper was published and is accessible through the Digital Journal of
Global Change Data Repository at: https://doi.org/10.3974/geodb.2020.09.14.V1
or https://cstr.escience.org.cn/CSTR:20146.11.2020.09.14.V1.
1 Introduction
Chlorophyll is
not only the basis of photosynthesis[1], but also the close relationship with nitrogen level. It
can be measured relatively easier, and can be used as a proxy for nitrogen level[2?C4]. Chlorophyll content can be
expressed by leaf chlorophyll content (LCC) or canopy chlorophyll content
(CCC). The measurement methods of chlorophyll content can be divided into
ground measurement and remote sensing inversion. The ground measurement of
chlorophyll includes laboratory analysis, ground spectrum measurement, leaf color card and so on[5,6]. The ground method is suitable for
measuring chlorophyll content in a small range, and the ??mass method?? is used
for measuring chlorophyll content in many early studies, which cannot be used
for remote sensing validation[7,8]. Therefore, some scholars call for using the ??area
method?? in the future measurement of chlorophyll content [2,9,10].
In principle, the method of retrieving
chlorophyll content by remote sensing can be divided into statistical method
and physical mechanism method[11].
The parameters in the statistical method include not only the common vegetation
index, but also the parameters obtained through the specific spectral interval,
such as the location of the red edge, the parameters based on synthesis,
derivative, and continuum removal[12?C18].
The physical mechanism method assumes that there is a causal relationship
between the remote sensing data and chlorophyll content. The physical
relationship can be used to build a radioactive transfer model (RTM), and the
??look-up table (LUT)?? method can be used to retrieve chlorophyll content[19,20]. In theory, physical mechanism
method has higher ??portability?? than statistical method, but its performance
still needs to be verified. For instance, some research shows that physical
mechanism method is also affected by seasonality [20] and vegetation type[21?C23].
At present, there are three chlorophyll
content products retrieved by remote sensing on the global scale: (1) the
MERIS-LCC product (2002-2012) was developed by University of Toronto,
Canada, 300 m, weekly[24]; (2)
MODIS-LCC product, 500m-8d, was developed by Chinese scholars[25]; (3) Sentinel-CCC product is
developed by ESA, but it requires users to download Sentinel-2 L2A data and
process L2A into Sentinel-CCC using SNAP-Biophysical Model, Sentinel-CCC
product can be as fine as 10 m with 5-day temporal resolution[26].
Due to the low spatial resolution (300-500 m)
of MERIS and MODIS LCC products, it is difficult to obtain reliable ground
validation data for CCC with 300-500 m resolution. However, Sentinel-CCC has high
spatial resolution (up to 10 m), which can be validated with field survey
relatively easier. If 10 m Sentinel-CCC can be validated to meet some criteria
with field observation, it may be used to further verify the CCC of 300-500 m
resolution. This dataset[27] includes the relative chlorophyll
index (SPAD) and LAI of 107 winter wheat plots in Yucheng, Shandong province in
May 2020, and the model converted from SPAD to LCC. The spatial resolution of
the plots is 10 m, which can be used to verify chlorophyll products with lower
spatial resolution after up scaling.
2 Metadata of the Dataset
Metadata of the Sentinel-2 canopy chlorophyll content (CCC)
validation dataset of winter wheat in Yucheng, Shandong of China[27] is summarized
in Table 1.
3 Methodology
3.1 Study Area
The sampling area is located in Yucheng county,
Shandong province, which belongs to the alluvial plain of the lower Yellow
River. The altitude range is 17.5-26.1 m, with small fluctuation. The annual
average temperature is 13.3 ºC, the annual average precipitation is 555.5 mm,
the annual average evaporation is 1,884.8 mm, the frost free period is 202
days, and the annual sunshine is 2,546.2 hours. Winter wheat and maize rotation
is the main way of land use, in which winter wheat was sown in October of the
previous year and harvested in early June of the present year. The field
observation time is from May 9 to 16, 2020 when winter wheat is in the filling
stage.
Table
1 Metadata summary of the
Sentinel-2 canopy chlorophyll content (CCC) validation dataset of winter wheat in
Yucheng, Shandong of China
|
Items
|
Descriptions
|
|
Dataset
full name
|
Sentinel-2
canopy chlorophyll content (CCC) validation dataset of winter wheat in
Yucheng, Shandong of China
|
|
Dataset
short name
|
CCC_WinterWheat_Yucheng_2020
|
|
Authors
|
Wang,
Z. X. L-5255-2016, Institute of Geographic Sciences and Natural Resources
Research, Chinese Academy of Sciences, wangzx@igsnrr.ac.cn
Li,
F. L-3424-2018, Institute of Geographic Sciences and Natural Resources Research,
Chinese Academy of Sciences, lif@igsnrr.ac.cn
|
|
Geographic
region
|
Yucheng,
Shandong province, China
116??31¢17.11²E-116??35¢45.48²E; 36??44¢59.71²N-36??49¢59.81²N
|
|
Sampling
date
|
Field
work: May 9-16,
2020; Sentinel-2 sensing: July 29, 2020; May 19,2020
|
|
Spatial
resolution
|
10
m??10 m
|
|
Data
format
|
.shp,
.kml, .xlsx, .tif
Data size 160 MB
|
|
Data
files
|
3
files
|
|
Foundation
|
Ministry
of Science and Technology of P. R. China (2016YFA0600201)
|
|
Data computing environment
|
SNAP
Biophysical Processor (ESA), ArcMap10.5
|
|
Data
publisher
|
Global Change Research Data Publishing & Repository, http://www.geodoi.ac.cn
|
|
Address
|
No. 11A, Datun Road, Chaoyang District, Beijing 100101,
China
|
|
Data
sharing policy
|
Data from the Global
Change Research Data Publishing & Repository includes metadata, datasets (in the Digital Journal of Global Change Data Repository), and
publications (in the Journal of Global Change Data & Discovery). Data sharing policy includes: (1) Data are openly
available and can be free downloaded via the Internet; (2) End users are
encouraged to use Data subject to citation; (3) Users, who are by definition
also value-added service providers, are welcome to redistribute Data
subject to written permission from the GCdataPR Editorial Office and the
issuance of a Data redistribution license; and (4) If Data are used to
compile new datasets, the ??ten per cent principal?? should be followed such
that Data records utilized should not surpass 10% of the new
dataset contents, while sources should be clearly noted in suitable places in
the new dataset[28]
|
|
Communication and searchable system
|
DOI, CSTR, Crossref, DCI, CSCD,
CNKI, SciEngine, WDS/ISC, GEOSS
|
3.2 The Principles of
Validation Data Development
The aim of collecting validation
data is to validate the canopy chlorophyll content products of Sentinel-2, with
a spatial resolution of 10 m and a temporal resolution of 5 days. Therefore,
the field observation and data processing follow the following principles.
(1) Spatial resolution: the
spatial positioning accuracy of field observation should be better than 10 m.
(2) Temporal resolution: the time
of field observation data and Sentinel-2 data should match on 1-day scale.
Because of the great variation of winter wheat in each growth period, the ideal
verification should be that the satellite sensing and the field survey are on
the same day. However, due to various restrictions, such time consistency is
rare. The processing principle of time consistency is: Taking the field
observation time as the benchmark, using the latest high-quality satellite
data, and assuming that the CCC changes linearly during the two satellite sensing
periods, using the principle of inverse time interval weight, the satellite
data is interpolated into the data corresponding to the field observation time.
The satellite data product to be verified: the canopy
chlorophyll content of Sentinel-2 (CCCSentinel).
Canopy chlorophyll content is the sum of all the leaf
chlorophyll content (LCC), determined by equation (1) and (2).
CCCField = LAI ?? LCC (1)
where LAI is leaf area index, observed by LAI-2200 in
the field; LCC is leaf chlorophyll density (µ??/cm2), which is
determined by field SPAD and an empirical equation. Here, we use an equation from
Zhuge town of Luoyang, Henan province in April 2019.
LCC = 0.0188 ?? SPAD2.0033,
R2 = 0.768 (2)
In addition, if there is no LCC available, the LAI´SPAD of field
measurement may also approximately verify the CCCSentinel, which is
defined as:
CCCField = LAI ?? SPAD (3)
3.3 Implementation of Field
Observation
The field observation includes two items (LAI and SPAD) and
follows four steps: sampling design; determine the actual spatial location of
sample plot; pretreatment of sample plot before observation; and field
observation.
3.3.1 Sampling Design (Homework, in Advance)
Based on these Sentinel-2 CCC products, we can
preliminarily select sample plots, make them into KML files, import them into
mobile GPS tools, and use them as field navigation maps. CCC classification map
and preliminary plot distribution map can also be printed for field survey.
3.3.2 Determine the Actual Spatial Location of Sample
Plot
The location of pre-set sample
plot maybe inaccurate and needs to be adjusted according to more detailed field
information. Generally,
??parcel?? is the basic unit of field observation. Each parcel belongs to a
farmer. The crop varieties and crop management in this parcel are relatively
consistent, but the differences between plots are relatively large. In this
case, the plot is usually long in the north-south direction and short in the
east-west direction. For example, the parcel
size of a typical family is 2,220 m2, which is equivalent to 100 m ??
22.2 m, or 80 m ?? 27.75 m. The narrow side of the parcel is usually
20-30 m, while the
spatial resolution of Sentinel-2 is 10 m. Consider the
spatial matching error between the satellite and the ground, we should choose
the sample plot with smaller CCC difference between adjacent parcels.
3.3.3 Pretreatment of Sample Plot Before
Observation
3.3.3.1 Sample
Plot Preparation for LAI
In order to yield LAI accurately with LAI-2200 instrument,
the time interval between A and B measurements should be as short as possible. Therefore,
before the measurement, we need to be well-prepared to avoid the interference
of unexpected events. The sample plot pretreatment for LAI includes three
tasks.
(1) Determine the effective measurement range: using LAI-2200
instrument needs to pay attention to two angles, one is to avoid direct
sunlight and surveyors?? shadow, and the other is to prevent LAI-2200 viewing beyond
the sample plot range. The former can be covered with masks (e.g., 180 ºC),
while the latter needs to be calculated according to the height of the crop.
The most wide zenith angle of LAI-2200 is 68??, corresponding to the ground view angle of 22??, with Tan (22??) = 0.404. Since the height of winter wheat is
80 cm, its horizontal distance in LAI-2200 sensor is about 200 cm. In other
words, the sensing range of LAI-2200 sensor may exceed the sample plot if it is
within 200 cm of the sample plot edge. Therefore, the most reliable measurement
area should be within 6 m ?? 6 m of the center of the sample plot, as shown in
Figure 1.
(2) Clean the underlying senescent leaves: when winter
wheat upper canopy closed, its leaves in the lower part begin to decline. The LAI
measurement accuracy of these withered leaves is usually low. Therefore, it is
necessary to clean the senescent leaves near the ground, especially those close
to the sensor, to ensure that there is no
interference in the field of view of LAI[15].
(3) Removal of wheat canopy dew: The optimal time for LAI
measurement is around sunrise in the morning, but it is often accompanied by
dew, so it is necessary to remove the canopy dew gently with a bamboo pole.
|

Figure 1 Effective area of
sample plot: for a 10 m??10 m plot and 80cm-high winter wheat, the 6 m??6 m
section at the center is the effective area and LAI can be measured more accurately
|
3.3.3.2 Leaf Treatment Before SPAD Measurement Wheat leaves may be tarnished
by various filths (dust, remnant of foliar fertilization and pesticide, insect
excrement, water vapor), if not cleaned in advance, this dirt may contaminate
the SPAD lens, resulting in systemic measurement error. These tarnished leaves
can be cleaned with clean water and absorbent paper.
3.3.4 LAI and SPAD
Observation
(1) LAI measurement: LAI can be
measured within effect area around sunrise and sunset (6?C10 a.m., 16?C18 p.m.)
in sunny days, or the whole day on steady overcast days. Measurement can be
conducted along three transects, with an A-BBBBB-BBBBB-BBBBB mode. The average
value of the measurement is used to represent the LAI of the sample plot
(Figure 1).
(2) SPAD measurement: SPAD-502 is
used to measure SPAD along three transects within effect area. Ten leaves from
each transect (upper two leaves) are chosen to measure SPAD values, each leaf
is evenly measured ten times (avoid main veins), the
mean value of all measurements in one plot represents the SPAD value of this
plot.
3.4 Retrieval and Processing of
Canopy Chlorophyll Content from Sentinel-2
3.4.1 Retrieval of
Canopy Chlorophyll Content Products from Sentinel-2
Level 2A
acquisition: Level 2A data can be downloaded from the sentinel data website.
After checking L2A??s quality flags, it is found that the two most recent clear
day satellite sensing times with the sampling area are April 29, 2020 and May
19, 2020 respectively (Table 2).
Table 2 Sentinel-2 Level-2A data used to retrieve canopy chlorophyll content
|
Sensing Date
|
L2A file name
|
|
2020-04-29
|
S2A_MSIL2A_20200429T025551_N0214_R032_T50SMF_20200429T061414.SAFE
|
|
2020-05-19
|
S2A_MSIL2A_20200519T025551_N0214_R032_T50SMF_20200519T070151.SAFE
|
(2) Principle of CCC inversion algorithm and development of
CCC products: ESA adopts hybrid algorithm for production of CCC products based
on Sentinel-2, that is, using PROSAIL model to
generate simulation data, and then inputting spectral data into trained artificial
neural network (ANN) for inversion.
This algorithm is integrated into the Biophysical processor
module of SNAP software. The Sentinel-2 L2A inputs are 8 reflection bands and 4
geometric bands. The output was Canopy Chlorophyll Content, CCC (µ??/cm2).
The eight reflection bands are B3, B4, B5, B6, B7, b8a, B11, B12; the four
geometric bands are: sun_zenith, sun_azimuth, view_zenith_ mean, view_azimuth_mean.
3.4.2 Temporal
Normalization of CCCSentinel and CCCField
Due to the difference of observation times (Table 3), CCCField
and CCCSentinel cannot be directly compared. To normalize CCCSentinel
from its satellite date to field observation date, we assume that CCCSentinel
changes linearly during the two satellite observations (20 day interval, Table
2), thus CCCSentinel can be interpolated to that of field observation
date, based on the inverse time interval weight, as expressed in equation (4)
and (5).
Table 3 Winter wheat canopy chlorophyll content observation time: field vs. satellite
|
Month
|
April
|
May
|
|
Date
|
29
|
30
|
1
|
2
|
3
|
4
|
5
|
6
|
7
|
8
|
9
|
10
|
11
|
12
|
13
|
14
|
15
|
16
|
17
|
18
|
19
|
|
Sentinel-2
|
|
|
|
|
|
|
|
|
|
|
|
|
|
|
|
|
|
|
|
|
|
|
Field
|
|
|
|
|
|
|
|
|
|
|
|
|
|
|
|
|
|
|
|
|
|
CCCField
= (1?CW) ?C
CCC0429 + W ?? CCC0519 (4)
W
= T/ (T2?CT1) (5)
where, (T2?CT1) are temporal interval of two Sentinel-2 observations, here is 20 d (from 20200429 to 20200519).
T1 is the temporal
interval from first Sentinel-2 observation to field survey.
3.4.3 Field
Observation Data Quality and Validation Application
While purpose of field observation is to validate CCCSentinel,
field observations are not error free. Using CCCField to validate
the accuracy of CCCSentinel can also check the quality of CCCField
itself, to some degree. Two forms are used for CCCField: one uses
absolute value, which is calculated by equation (1); and the other is the
relative value, which comes from equation (3). R2 and RMSE were chosen as quality indicator of CCCSentinel.
4 Data
Results and Validation
4.1
Data File Organization
The data files are archived into three folders:
(1) Shapefile: field observation data from 107 samples
(including LAI; SPAD; CCCField, Unitless), and corresponding CCCSentinel
(µg/cm2) developed from Sentinel-2 L2A imagery (interpolated
to field observation date).
(2) Excel file: exported from Shapefile, and annotated to
serve as a data dictionary.
(3) Tiff file: CCCSentinel (µg/cm2)
imagery on two dates (20200429, 20200519).
4.2
Data Results
Based on whether SPAD or LCC is used to calculate CCCField,
CCCField can be expressed in two forms: relative canopy chlorophyll
content (CCCField=LAI ?? SPAD, Unitless) and absolute canopy
chlorophyll content (CCCField = LAI ?? LCC, µg/cm2).
Compared with Sentinel-2 CCC, the ground observation has
the following characteristics (Table 4): (1) LCC is larger than SPAD; (2) The
average value of ??absolute Canopy Chlorophyll?? (CCCField, µg/cm2)is larger than that of ??relative
Canopy Chlorophyll??(CCCField, Unitless), and the range is
also larger; (3) The ??absolute Canopy Chlorophyll??(CCCField, µg/cm2)is
slightly larger than the average CCCSentinel (295.856), but the
standard deviation was slightly smaller (98.491).
4.3 Application of Field Sample
Data to Sentinel-2 CCC Validation
(1) By absolute value: the coefficient of determination (R2) of CCCField
and CCCSentinel of five regression models were calculated, all above
0.889,9 and with an average of 0.9115. The slope of the linear model is 0.989,5,
and there is no obvious systematic deviation (Table 5, Figure 2).
Table 4 Chlorophyll Content of winter wheat: field
observation and Sentinel-2
|
|
LAI
|
SPAD
|
LCC
|
CCCField
|
CCCField
|
CCCSentinel
|
|
|
(Unitless)
|
(Unitless)
|
(µg/cm2)
|
(Unitless)
|
(µg/cm2)
|
(µg/cm2)
|
|
Min
|
1.798
|
44.5
|
37.698
|
92.033
|
82.536
|
100.435
|
|
Max
|
6.677
|
64.1
|
78.313
|
414.642
|
490.727
|
455.677
|
|
Average
|
4.398
|
58.8
|
66.076
|
260.967
|
295.856
|
292.667
|
|
Std.
Deviation
|
1.219
|
3.6
|
7.622
|
79.360
|
98.491
|
101.742
|
Table 5 Regression analysis of winter wheat Canopy
Chlorophyll Content (CCC) from field observation and Sentinel-2 L2A imagery:
two methods
|
Fitting
model
|
Expression of CCC by relative value R2
x= CCCSentinel (µg/cm2)
y= CCCField (Unitless)
|
Expression
of CCC by absolute value R2
x= CCCSentinel (µg/cm2)
y= CCCField (µg/cm2)
|
|
Linear
|
y
= 0.7525x + 40.721
|
0.930,8
|
y
= 0.9895x ?C 0.087
|
0.917,6
|
|
Exponential
|
y
= 92.648e0.0033x
|
0.915,2
|
y
= 81.103e0.0041x
|
0.9
|
|
Logarithm
|
y
= 179.24ln(x) ?C 743.05
|
0.913,3
|
y
= 237.54ln(x) ?C 1042.3
|
0.889,9
|
|
Power
|
y =
2.5266x0.8179
|
0.945,2
|
y =
0.9342x1.0089
|
0.928
|
|
Polynomial
|
y
= 0.0001x2 + 0.6982x + 46.862
|
0.930,9
|
y
= -0.0006x2
+ 1.3493x ?C 43.702
|
0.922,1
|
|
Average
|
|
0.927,1
|
|
0.911,5
|
|
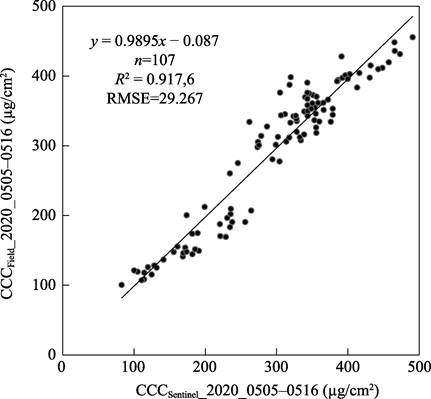
Figure 2 Regression of CCCField
and CCCSentinel
by linear fitting
|
(2) By relative value: the
relative CCC was calculated using equation (3). All five coefficients of
determination (R2) of
ground observation and satellite canopy CCC were above 0.913,3, with an average
of 0.927,1, which was significantly higher than that of absolute model. This
shows that the correlation with remote sensing is stronger when the ground is only
optical observation. However, due to the different units, the slope of the
linear model is 0.752,5, which obviously deviates from the 1:1 line and
cannot directly explain the quantitative relationships (Table 5).
5 Discussion and Conclusion
(1) To obtain quality ground data, we need to accurately
plan the field observation. In this study, the uncertainties in space, time and
sampling were minimized as far as possible.
??To minimize spatial uncertainty resulted from small parcels,
the effective measurement area is defined based on the sample plot center.
?? To temper
the temporal uncertainty caused by the date discrepancy of field survey and
Sentinel-2 sensing, an inverse time interval weight is used to interpolate
original CCCSentinel to CCCSentinel corresponding date to
field survey.
?? In
addition, the sample plots and wheat leaves were pretreated to prevent possible
systematic deviation in the measurement process of LAI and SPAD.
(2) Possible deficiencies: First, the original LAI measurement is used
without further refinement, and Clumping Index (CI) is not considered.
Secondly, SPAD is the result of measuring ??clean leaf??; but Sentinel-2 covers
actual wheat canopy, clean or otherwise. Third, the SPAD-LCC transformation
model is not developed from the same region, but from Luoyang city, Henan
province in April 2018.
(3) Conclusion: Although
there may be some shortcomings, the analysis results show that, on the whole,
the quality of ground observation data and satellite inversion data is very
good. The
coefficient of determination (R2)
of linear regression between CCCField and CCCSentinel is
0.917,6, with a close to 1:1 line and RMSE of 29.267. In
comparison, a similar validation conducted by Xie et al. (2019)[23] , which is also for winter wheat CCCSentinel
in same season (April?CMay, 2018) yet different location ( Shunyi, Beijing), yields
a R2 of 0.72 and a RMSE of
108.30. Parry et al. (2014) [5]
suggested that varieties and management have little effect on SPAD-LCC
conversion model, which partly explains that the SPAD- LCC model from Luoyang
performs quite well in this study. Table 4 shows that the CCC range of ground
observation is 82.536?C490.727 (??g/cm2), which indicates that CCCSentinel
can explain the variation of CCCField value in a wide range, and the
validation dataset can be applied to validate winter wheat CCCSentinel
with medium and high coverage.
Author Contribution
Wang, Z. X. designed the dataset
development and finished the data paper writing. Li, F.
participated in data collection and analysis.
Acknowledgements
Zeng, Z. K. and
Wang, Z. H. of Henan University of Science and Technology helped to complete
the measurement of wheat Leaf Chlorophyll Content (LCC); Wang, J. S., Han Y. S.,
Cai, X. G. and Qiao, Y. F. of Yucheng Experimental Station of Chinese Academy
of Sciences provided LAI-2200 and logistics support for LAI field survey; Yang,
B. of Southwest University of Science and Technology assisted in the calculation
of canopy chlorophyll content using SNAP-Biophysical module and Sentinel-2 L2A
data. The authors express their sincere thanks for their supports.
Conflicts
of Interest
The authors declare no conflicts of interest.
References
[1]
Croft, H., Chen, J. M., Luo,
X., et al. Leaf chlorophyll content
as a proxy for leaf photosynthetic capacity [J]. Global Change Biology, 2017, 23(9): 3513-3524.
[2]
Berger, K., Verrelst, J., F??ret,
J. B., et al. Retrieval of
aboveground crop nitrogen content with a hybrid machine learning method [J]. International Journal of Applied Earth
Observation and Geoinformation, 2020, 92: 102174.
[3]
Xue,
X., Wu, Y. E. Chlorophyll content determination and its relationship with SPAD
value in wheat [J]. Hubei Agricultural Sciences, 2010, 49(11): 2701?C2703.
[4]
Watt,
M. S., Pearse, G. D., Dash, J. P., et al.
Application of remote sensing technologies to identify impacts of nutritional
deficiencies on forests [J]. ISPRS
Journal of Photogrammetry and Remote Sensing, 2019, 149: 226-241.
[5]
Parry, C., Blonquist, J. M., Jr., Bugbee B. In situ measurement of leaf chlorophyll concentration: analysis of
the optical/absolute relationship [J].
Plant Cell Environment, 2014, 37(11): 2508-2520.
[6]
Friedman,
J. M., Hunt, E. R., Mutters, R. G. Assessment of leaf color chart observations
for estimating maize chlorophyll content by analysis of digital photographs
[J]. Agronomy Journal, 2016, 108(2):
822-829.
[7]
Wang,
Z. X., Li, F. A dataset of in situ SPAD readings, in vitro chlorophyll
concentration measuring, and their relationship: Quercus variabilis bl. in Mt. Funiu, China [J]. Journal of Global Change Data & Discovery,
2018, 2(4): 442?C447. https://doi.org/10.3974/geodp.2018.04.11.
[8]
Wang, Z. X., Li, F. In
situ and analysis dataset on moso bamboo (Phyllostachys edulis
) in Zhejiang, China [J]. Journal
of Global Change Data & Discovery, 2019, 3(2):194?C199. https://doi.org/10.3974/geodp.2019.02.11.
[9]
Xu, D. Q. Several problems in measurement and application of
chlorophyll content [J]. Plant
Physiology Communications, 2009, 45(9): 896?C898.
[10]
Kattenborn, T., Schiefer, F.,
Zarco-Tejada, P., et al. Advantages
of retrieving pigment content [??g/cm2] versus concentration [%] from
canopy reflectance [J]. Remote Sensing of
Environment, 2019, 230: 111195.
[11]
Verrelst, J., Camps-Valls, G.,
Muñoz-Mar??, J., et al. Optical remote
sensing and the retrieval of terrestrial vegetation bio-geophysical
properties??a review [J]. ISPRS Journal of
Photogrammetry and Remote Sensing, 2015, 108: 273-290.
[12]
Clevers, J. G. P. W., Gitelson,
A. A. Remote estimation of crop and grass chlorophyll and nitrogen content
using red-edge bands on Sentinel-2 and -3 [J]. International Journal of Applied Earth Observation and Geoinformation,
2013, 23: 344-351.
[13]
Schlemmer, M., Gitelson, A.,
Schepers, J., et al. Remote
estimation of nitrogen and chlorophyll contents in maize at leaf and canopy levels
[J]. International Journal of Applied
Earth Observation and Geoinformation, 2013, 25: 47-54.
[14]
Croft, H., Chen, J. M., Zhang,
Y. The applicability of empirical vegetation indices for determining leaf
chlorophyll content over different leaf and canopy structures [J]. Ecological Complexity, 2014, 17: 119-130.
[15]
Inoue, Y., Guerif, M., Baret,
F., et al. Simple and robust methods
for remote sensing of canopy chlorophyll content: a comparative analysis of
hyperspectral data for different types of vegetation [J]. Plant Cell Environment, 2016, 39(12): 2609-2623.
[16]
Tong, A., He, Y. Estimating and
mapping chlorophyll content for a heterogeneous
grassland: Comparing prediction power of a suite of vegetation indices across
scales between years [J]. ISPRS Journal
of Photogrammetry and Remote Sensing, 2017, 126: 146-167.
[17]
Delloye, C., Weiss, M.,
Defourny, P. Retrieval of the canopy chlorophyll content from Sentinel-2
spectral bands to estimate nitrogen uptake in intensive winter wheat cropping
systems [J]. Remote Sensing of Environment,
2018, 216: 245-261.
[18]
Zarco-Tejada, P. J., Hornero,
A., Hernandez-Clemente, R., et al.
Understanding the temporal dimension of the red-edge spectral region for forest
decline detection using high-resolution hyperspectral and Sentinel-2a imagery [J]. ISPRS Journal of Photogrammetry and Remote
Sensing, 2018, 137: 134-148.
[19]
F??ret, J. B., Gitelson, A. A.,
Noble, S. D., et al. PROSPECT-D:
towards modeling leaf optical properties through a complete lifecycle [J]. Remote Sensing of Environment, 2017,
193: 204-215.
[20]
Schiefer, F., Schmidtlein, S.,
Kattenborn, T. The retrieval of plant functional traits from canopy spectra
through RTM-inversions and statistical models are both critically affected by
plant phenology [J]. Ecological
Indicators, 2021, 121: 107062.
[21]
Atzberger, C., Darvishzadeh,
R., Immitzer, M., et al. Comparative
analysis of different retrieval methods for mapping grassland leaf area index
using airborne imaging spectroscopy [J].
International Journal of Applied Earth Observation and Geoinformation,
2015, 43: 19-31.
[22]
Ali, A. M., Darvishzadeh, R.,
Skidmore, A., et al. Comparing
methods for mapping canopy chlorophyll content in a mixed mountain forest using
Sentinel-2 data [J]. International
Journal of Applied Earth Observation and Geoinformation, 2020, 87: 102037.
[23]
Xie, Q., Dash, J., Huete, A., et al. Retrieval of crop biophysical
parameters from Sentinel-2 remote sensing imagery [J]. International Journal of Applied Earth Observation and Geoinformation,
2019, 80: 187-195.
[24]
Croft, H., Chen, J. M., Wang,
R., et al. The global distribution of
leaf chlorophyll content [J]. Remote Sensing
of Environment, 2020, 236: 111479.
[25]
Xu, M., Liu, R., Chen, J. M., et al. Retrieving
leaf chlorophyll content using a matrix-based vegetation index combination
approach [J]. Remote Sensing of
Environment, 2019, 224: 60-73.
[26]
Weiss, M., Baret, F. S2ToolBox
Level 2 products algorithms: LAI, FAPAR, FCOVER, Version 1.1 [R]. ESA, France,
2016.
[27]
Wang, Z. X., Li, F. Sentinel-2 LAI validation dataset of winter wheat in
Yucheng, Shandong of China [J/DB/OL]. Digital
Journal of Global Change Data Repository, 2020. https://doi.org/10.3974/geodb.2020.08.01.V1.
https://cstr.escience.org.cn/CSTR:20146.11.2020.09.14.V1.
[28]
GCdataPR Editorial Office. GCdataPR data sharing policy [OL].
https://doi.org/10.3974/dp.policy.2014.05
(Updated 2017).