Yearly Spatial Dataset Development of Ecological Risk
Assessment for the Qinghai-Xizang Plateau (1 km, 2000‒2020)
Xia, Y. Q.1 Wang, H.1* Tang, B. T.1,2 Hui, L.1 Han, B. Y.1
1. School of Geography and
Tourism, Shaanxi Normal University, Xi??an 710119, China;
2. Research Center for
Eco-Environmental Sciences, Chinese Academy of Sciences, Beijing 100085, China
Abstract: Ecological risk
assessment helps identify and quantify potential risks and threats to
ecosystems, as well as evaluate impact of human activities or natural changes
on ecosystem health, functions and services. In developing the dataset, a
comprehensive assessment framework for ecosystem health and services was
established by integrating model algorithms such as the CASA model, the revised
universal soil loss equation (RUSLE), and the InVEST model, together with
multi-source data including land use, NDVI, soil type, annual precipitation,
and mean annual temperature. This framework enables a holistic evaluation of
ecosystem health and ecosystem services. Based on calculations of indicators
related to ecosystem organization, quality, and services, an annual ecological
risk assessment dataset was produced for the period 2000?C2020. The results indicate that the ecological risk index of the
Qinghai-Xizang Plateau exhibits an overall fluctuating trend over time and
gradually increases from the southeast to northwest in spatial distribution.
Low-risk areas are mainly concentrated in Garz?? and Ngawa, near Yunnan and
Guizhou, whereas high-risk areas are predominantly distributed in Nagqu and the
northern Xizang region bordering Xinjiang. The
dataset is archived in .tif data format, with a spatial resolution of 1 km, and
consists of 21 data files with the data size of 485 MB (compressed into one
file with 155 MB).
Keywords: Qinghai-Xizang Plateau;
ecological risk; ecosystem health; ecosystem services
DOI: https://doi.org/10.3974/geodp.2025.03.06
Dataset Availability Statement:
The dataset
supporting this paper was published and is accessible through the Digital Journal of
Global Change Data Repository at: https://doi.org/10.3974/geodb.2025.06.01.V1.
1 Introduction
With
the acceleration of socio-economic development, coupled with climate change and
intensified human activities, ecosystems are under greater pressure. To address
the resulting ecological risks, the China??s government has launched a series of
ecological restoration programs, including the Grain-for-Green Program and the
Grazing Withdrawal Program, which have achieved remarkable results[1,2].
The Qinghai-Xizang Plateau is an important ecological barrier in China and a
typical region characterized by ecological vulnerability and underdeveloped
economic conditions[3]. To gain a comprehensive understanding the
current ecological and environmental conditions of the Qinghai-Xizang Plateau,
the China??s government launched the Second Scientific Expedition to the
Qinghai-Xizang Plateau in 2017, aiming to provide a scientific basis for future
ecological restoration and conservation in the region. Therefore, assessing
ecological risks across Qinghai-Xizang Plateau can effectively identify regions
in need of subsequent restoration and protection, determine their
prioritization, and offer important guidance for the sustainable development of
regional ecological construction.
At present,
research on the identification and early warning of ecological risks mainly
focuses on ecosystems themselves. On the one hand, ecologically fragile areas
are identified based on ecosystem structure and its spatial patterns[4,5].
For example, some studies select indicators of ecosystem organization or
quality, such as landscape diversity, landscape fragmentation to assess
regional ecological risks[6]. On the other hand, a series of
ecological indicators simulating different ecological processes are used to
identify potential degradation risk areas[7,8]. For example, regions
with medium to low or declining ecosystem productivity or ecosystem services
are identified as high-risk or degraded areas[9]. Although existing
studies can indicate the approximate locations where ecological risks may
occur, differences remain in scholars?? understanding of the conceptual
connotations of ecological risk, and there is still no unified evaluation
methodology. Therefore, it is important to develop an ecological risk
assessment framework that not only reflects the spatiotemporal variation
patterns of ecological risk, but also incorporates ecological processes and
their driving factors. Such a framework is crucial for identifying and
providing early warning of regional ecological risks, and warranting further
in-depth research.
This paper
constructs a comprehensive assessment framework for ecosystem health and
ecosystem services, integrating ecosystem organization, quality and services
from the perspectives of ecosystems and human interests. It helps identify and
quantify the potential risks and threats faced by the Qinghai-Xizang Plateau
region, and assists decision-makers in formulating scientific and effective
ecological protection and sustainable development policies.
2 Metadata of the Dataset
The
metadata of the Yearly spatial dataset of ecological risk assessment for the
Qinghai-Xizang Plateau (1 km, 2000?C2020)[10] is summarized in Table
1. It includes the dataset??s full name, short name, authors, temporal
resolution, spatial resolution, data format, data size, data files, data
publisher, and data sharing policy.
3 Methods
3.1 Data Sources
The spatial extent and
boundary data of the Qinghai-Xizang Plateau were derived from the Datasets of the boundary and area of the
Qinghai-Xizang Plateau published by Zhang, et al[12].
Land use data for 2000?C2020 were obtained from the European Space Agency, with
a spatial resolution of 300 m.
Meteorological data were sourced from the National Meteorological Science Data
Center and include mean annual temperature, annual precipitation,
Table 1
Metadata summary of
the Yearly spatial dataset of ecological risk assessment for the Qinghai-Xizang
Plateau (1 km, 2000?C2020)
|
Items
|
Description
|
|
Dataset full name
|
Yearly spatial
dataset of ecological risk assessment for the Qinghai-Xizang Plateau (1 km,
2000?C2020)
|
|
Dataset short
name
|
ER2000-2020
|
|
Authors
|
Xia, Y. Q.,
School of Geography and Tourism, Shaanxi Normal University,
yq_xia@snnu.edu.cn
|
|
|
Wang, H., School
of Geography and Tourism, Shaanxi Normal University, foreva@snnu.edu.cn
Tang, B. T.,
School of Geography and Tourism, Shaanxi Normal University; Research Center
for Eco-Environmental Sciences, Chinese Academy of Sciences,
tangbutian@snnu.edu.cn
Hui, L., School
of Geography and Tourism, Shaanxi Normal University, 2002huile@snnu.edu.cn
Han, B. Y.,
School of Geography and Tourism, Shaanxi Normal University, byhan@snnu.edu.cn
|
|
Geographical
region
|
Qinghai-Xizang
Plateau
|
|
Year
|
2000?C2020
|
|
Temporal
resolution
|
Year
|
|
Spatial
resolution
|
1 km
|
|
Data format
|
.tif
|
|
|
|
Data size
|
155 MB (after
compression)
|
|
|
|
Data files
|
Annual ecological
risk assessment results data for the Qinghai-Xizang Plateau (2000?C2020)
|
|
Foundation
|
Ministry of
Science and Technology of P. R. China (2019QZKK0403)
|
|
Data publisher
|
Global Change Research Data Publishing & Repository,
http://www.geodoi.ac.cn
|
|
Address
|
No. 11A, Datun
Road, Chaoyang District, Beijing 100101, China
|
|
Data sharing
policy
|
(1) Data are openly available
and can be free downloaded via the Internet; (2) End users are encouraged to
use Data subject to citation; (3)
Users, who are by definition also value-added service providers, are welcome
to redistribute Data subject to
written permission from the GCdataPR Editorial Office and the issuance of a Data redistribution license; and (4)
If Data are used to compile new
datasets, the ??ten percent principal?? should be followed such that Data records utilized should not
surpass 10% of the new dataset contents, while sources should be clearly
noted in suitable places in the new dataset[11]
|
|
Communication and
searchable system
|
DOI, CSTR, Crossref, DCI, CSCD, CNKI, SciEngine, WDS, GEOSS, PubScholar,
CKRSC
|
and
solar radiation for the period 2000?C2020.
DEM data were obtained from the Geospatial Data Cloud,
with a spatial resolution of 90 m. NDVI data for 2000?C2020 were derived from
the MOD13Q1 16-day composite product,
with a spatial resolution of 250 m. Soil type data for 2000?C2020 were obtained
from the National Cryosphere Desert Data Center,
with a spatial resolution of 30 m. Based on these datasets, landscape indices,
net primary productivity (NPP), water yield, soil retention, and habitat
quality services of the Qinghai-Xizang Plateau were calculated to quantify
ecosystem organization, quality, and services, thereby enabling the annual
ecological risk assessment for the period 2000?C2020.
3.2 Algorithm
(1) Ecosystem
organization
Ecosystem
organization is derived from the coupling of ecological processes and spatial
patterns in landscape ecology, and is primarily calculated using landscape
indices such as landscape heterogeneity and landscape connectivity[13].
The ecosystem organization index was calculated using a weighted coefficient
model. Considering that landscape heterogeneity and landscape connectivity are
equally important components of the organization index, each was assigned a
weight of 0.35. Forest and grassland, as important land cover types influencing
the regional environment, were assigned a combined weight of 0.30[14].
The specific Equation is as follows:
 (1)
(1)

where
EO represents ecosystem organization; LC represents landscape
connectivity; LH represents landscape heterogeneity; IC represents
important land patches. AWMPFD represents the area-weighted mean
patch fractal dimension index; FN1 represents
landscape fragmentation index; SHDI represents the
Shannon??s diversity index; MSIDI represents the
modified Simpson??s diversity index; CONT represents the
landscape contagion index; FN2 and FN3 represent the landscape fragmentation indices
of forest and grassland, respectively; and CONNECT1 and CONNECT2
represent the patch connect index of forest and grassland, respectively.
(2) Ecosystem
quality
Ecosystem quality
refers to the condition of terrestrial ecosystems and is closely related to
regional vegetation and its productivity[15]. NPP represents the net
amount of carbon fixed by plants through photosynthesis. As an important
component of the terrestrial carbon cycle, carbon sequestration serves as a
core indicator for assessing ecosystem quality[16,17]. NPP data
calculated using the CASA model were employed to characterize carbon
sequestration services, and the normalized NPP values were used to represent
ecosystem quality. The specific Equations are as follows:
 (2)
(2)
 (3)
(3)
 (4)
(4)
where
x represents the spatial location; t represents time; NPP(x,t), APAR(x,t) and ??(x,t)
refer to the net primary productivity of vegetation (g C/m2), the
photosynthetically active radiation (MJ/m2), and the actual light
energy utilization (g C/MJ) at location x and time t,
respectively; SOL(x,t) and FPAR(x,t)
represent the total solar radiation (MJ/m2) and the fraction of the
incident photosynthetic effective radiation at location x and time t,
respectively. The constant 0.5 represents that the proportion of effective
solar radiation utilized for vegetation photosynthesis (wavelength 0.4?C0.7 ??m)
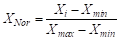
accounts for the total solar radiation[18]. XNor
represents the normalized NPP value, while Xi represents the original NPP
value; Xmin and Xmax are the minimum and
maximum values of the original NPP dataset, respectively.
(3) Ecosystem
services
Ecosystem services
refer to the ecological functions and processes that contribute to human
survival and well-being[19]. A sustained and stable supply of
ecosystem services can effectively support the sustainable development of human
society[20,21]. By integrating water yield, soil retention, and
habitat provision, an ecosystem services index was constructed to characterize
the supply level of ecosystem services on the Qinghai-Xizang Plateau[22,23].
Water yield, soil retention, and habitat provision were estimated using the
water balance method, the Revised Universal Soil Loss Equation (RUSLE), and the
InVEST model, respectively. The specific Equations are as follows:
 (5)
(5)
 (6)
(6)
 (7)
(7)
 (8)
(8)
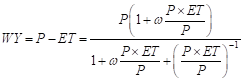
where
in Equation 5,  , P and ET represent the annual water yield
(mm), annual precipitation (mm), and actual evapotranspiration (mm),
respectively;
, P and ET represent the annual water yield
(mm), annual precipitation (mm), and actual evapotranspiration (mm),
respectively; represents the water consumption coefficient of vegetation. In
Equation 6,
represents the water consumption coefficient of vegetation. In
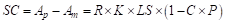
Equation 6, ,
, , and
, and represent soil conservation, potential soil erosion, and
actual soil erosion (t hm‒2 yr‒1), respectively. R
represents the rainfall erosivity factor (MJ mm hm‒2 h‒1
yr‒1); S represents the slope factor; L represents the
slope length factor; K represents the soil erodibility factor (t hm2
h hm‒2 MJ‒1 mm‒1); C represents the
vegetation cover and management factor; P represents the soil and water
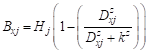
conservation factor. In Equation 7,
represent soil conservation, potential soil erosion, and
actual soil erosion (t hm‒2 yr‒1), respectively. R
represents the rainfall erosivity factor (MJ mm hm‒2 h‒1
yr‒1); S represents the slope factor; L represents the
slope length factor; K represents the soil erodibility factor (t hm2
h hm‒2 MJ‒1 mm‒1); C represents the
vegetation cover and management factor; P represents the soil and water
conservation factor. In Equation 7, represents the
quality of habitat of the grid cell x in a given habitat type j; Hj represents the habitat
suitability of that habitat type j;
represents the
quality of habitat of the grid cell x in a given habitat type j; Hj represents the habitat
suitability of that habitat type j; represents the habitat degradation degree of the grid cell x
in a given habitat type j; z represents the normalization
constant; k represents the half-saturation constant. In Equation 8, ES
represents ecosystem services; WY, SC and HP represent the
normalized values of water yield, soil conservation, and habitat provision
services, respectively.
represents the habitat degradation degree of the grid cell x
in a given habitat type j; z represents the normalization
constant; k represents the half-saturation constant. In Equation 8, ES
represents ecosystem services; WY, SC and HP represent the
normalized values of water yield, soil conservation, and habitat provision
services, respectively.
(4) Ecological risk index
Ecosystem
organization, quality, and services are 3 equally important dimensions in
evaluating ecological risk. To effectively balance these dimensions, an
ecological risk index was constructed based on previous studies[24,25]:
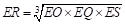 (9)
(9)
where
ER represents the ecological risk index; EO represents the
ecosystem organization; EQ represents the ecosystem quality; ES
represents the ecosystem services.
4 Data Results
4.1 Dataset Composition
The
Yearly spatial dataset of ecological risk assessment for the Qinghai-Xizang
Plateau (1 km, 2000?C2020) is archived
in .tif format and contains ecological risk assessment results for 21 years,
covering the period from 2000 to 2020. The spatial resolution is 1 km. The
smaller the value of the ecological risk data, the higher the ecological risk,
and the missing data is set to ‒9999.
4.2 Data Results
4.2.1 Temporal Distribution
Characteristics of Ecological Risk
The
ecological risk index of the Qinghai-Xizang
Plateau generally shows fluctuations trend, with overall changes being
relatively minor. In particular, ecological risk declined significantly in 2002
and 2010, indicating improvements in regional ecological conditions, followed
by a gradual increase in ecological risk (Figure 1).
4.2.2 Spatial Distribution Characteristics of Ecological Risk
The ecological risk index
shows a gradual increase from southeast to northwest. Low-risk areas are mainly
concentrated in Garz?? and Ngawa, adjacent to Yunnan and Guizhou,
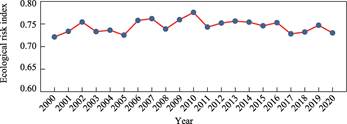
Figure 1 Changes in the average
annual ecological risk index (2000?C2020)
whereas
high-risk areas are primarily distributed in Nagqu City and the northern Xizang
region near Xinjiang (Figure 2). Overall, ecological risk in the region
exhibits a decreasing trend (decrease: 55.3%, increase: 44.7%). Areas with
significant increases are mainly located in the southern Qinghai-Xizang
Plateau, including Shigatse, Lhoka, and Nyingchi, covering 12.81% of the total
area. In contrast, areas with significant decreases are concentrated in the
northern and eastern Qinghai-Xizang Plateau, such as Jiuquan and Hotan (Figure
3).
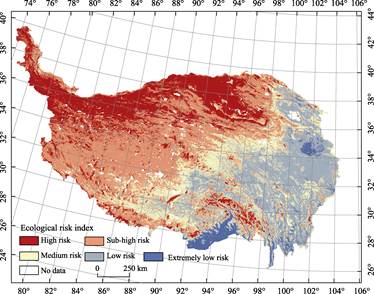
Figure 2 Map of the spatial
distribution of ecological risk index from 2000 to 2020
5 Discussion and Conclusion
Compared
with existing ecological risk assessment approaches, this dataset establishes
an assessment framework from the dual perspectives of ecosystem health and
ecosystem services, using 3 indicators: ecosystem organization, quality, and
services. Continuous data were applied for quantification and analysis,
enabling the identification of ecological risk patterns in the region from a
spatiotemporal perspective, and providing theoretical support for ecological
protection efforts aimed at safeguarding ecological security.
Based on the region??s typical
characteristics, this dataset selects and quantifies 3 ecosystem services of
the Qinghai-Xizang Plateau??water yield, soil retention, and habitat provision,
and adopts net primary productivity as the indicator for ecosystem quality.
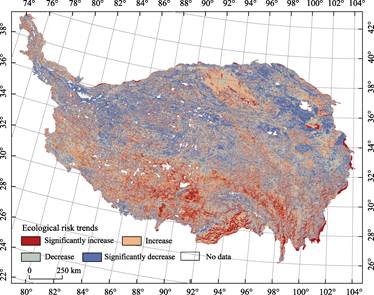
Figure 3 Map of the trend of
ecological risk index from 2000 to 2020
However,
given the vast expanse of the Qinghai-Xizang Plateau and the pronounced
heterogeneity of natural environments across subregions, the ecological
functions performed vary accordingly. Therefore, future research should refine
the assessment for different subregions by incorporating more region-specific
ecosystem services, as well as structural and quality indicators, into the
assessment framework, thereby providing a more scientific and rational
theoretical basis for local ecological risk identification and prevention. Due
to the plateau??s unique geographical environment, data sources and accuracy
remain relatively limited, future studies should integrate more diverse data
types and conduct targeted field surveys to promptly validate and adjust the
assessment results.
Author Contributions
Wang, H. conducted the
overall design of the dataset development. Xia, Y. Q. and Tang, B. T. collected
and processed the relevant remote sensing data, and performed simulations and
calculations based on the models. Hui, L. and Han, B. Y. assisted in data
processing and model calculations. Xia, Y. Q. wrote the data paper.
Conflicts of Interest
The authors declare no
conflicts of interest.
References
[1]
Liu, C., Chen, L., Vanderbeck,
R. M., et al. A Chinese route to sustainability: postsocialist
transitions and the construction of ecological civilization [J]. Sustainable
Development, 2018, 26(6): 741?C748.
[2]
Shao, Q. Q., Liu, S. C., Ning,
J., et al. Assessment of ecological benefits of key national ecological
projects in China in 2000?C2019 using remote sensing [J]. Acta Geographica
Sinica, 2022, 77(9): 2133?C2153.
[3]
Dong, S. K., Shang, Z. H., Gao,
J. X., et al. Enhancing sustainability of grassland ecosystems through
ecological restoration and grazing management in an era of climate change on
Qinghai-Tibetan Plateau [J]. Agriculture, Ecosystems &
Environment, 2020, 287: 106684.
[4]
Antongiovanni, M., Venticinque,
E. M., Tambosi, L. R., et al. Restoration priorities for caatinga dry
forests: landscape resilience, connectivity and biodiversity value [J]. Journal
of Applied Ecology, 2022, 59(9): 2287?C2298.
[5]
Guo, R., Wu, T., Liu, M. G., et
al. The construction and optimization of ecological security pattern in the
Harbin-Changchun Urban Agglomeration, China [J]. International Journal of
Environmental Research and Public Health, 2019, 16(7): 1190.
[6]
Gao, F. J., Yang, W., Zhang,
S., et al. An integrated approach to constructing ecological security
pattern in an urbanization and agricultural intensification area in Northeast
China [J]. Land, 2023, 12(2): 330.
[7]
Hasani, M., Pielesiak, I.,
Mahiny, A. S., et al. Regional ecosystem health assessment based on
landscape patterns and ecosystem services approach [J]. Acta Ecologica
Sinica, 2023, 43(2): 333?C342.
[8]
Wang, L., Ren, G., Hua, F., et
al. Integrating habitat availability into restoration efforts for
biodiversity conservation: evaluating effectiveness and setting priorities [J].
Biological Conservation, 2021, 257: 109127.
[9]
Li, S. C., Zhang, H., Zhou, X.
W., et al. Enhancing protected areas for biodiversity and ecosystem
services in the Qinghai-Tibet Plateau [J]. Ecosystem Services, 2020, 43:
101090.
[10] Xia, Y. Q., Wang, H., Tang, B. T., et al. Yearly spatial
dataset of ecological risk assessment for the Qinghai-Xizang Plateau (1 km,
2000?C2020) [J/DB/OL]. Digital Journal of Global Change Data Repository,
2025. https://doi.org/10.3974/geodb.2025.06.01.V1.
[11] GCdataPR Editorial Office. GCdataPR data sharing policy [OL].
https://doi.org/10.3974/dp.policy.2014.05 (Updated 2017).
[12] Zhang, Y. L., Li, B. Y., Zheng, D. Datasets of the boundary and area
of the Tibetan Plateau [J/DB/OL]. Digital Journal of Global Change Data
Repository, 2014. https://doi.org/10.3974/geodb.2014.01.12.V1.
[13] Frondoni, R., Mollo, B., Capotorti, G. A landscape analysis of land
cover change in the municipality of Rome (Italy): spatio-temporal
characteristics and ecological implications of land cover transitions from 1954
to 2001 [J]. Landscape and Urban Planning, 2011, 100(1): 117?C128.
[14] Kang, P., Chen, W., Hou, Y., et al. Linking ecosystem
services and ecosystem health to ecological risk assessment: a case study of
the Beijing-Tianjin-Hebei Urban Agglomeration [J]. Science of the Total
Environment, 2018, 636: 1442?C1454.
[15] Field, C. B., Behrenfeld, M. J., Randerson, J. T., et al.
Primary production of the biosphere: integrating terrestrial and oceanic
components [J]. Science, 1998, 281(5374): 237?C240.
[16] Hou, Y., Lv, Y., Chen, W. P., et al. Temporal variation and
spatial scale dependency of ecosystem service interactions: a case study on the
central Loess Plateau of China [J]. Landscape Ecology, 2017, 32(6):
1201?C1217.
[17] Tian, G. G., Qiao, Z. Assessing the impact of the urbanization
process on net primary productivity in China in 1989?C2000 [J]. Environmental
Pollution, 2014, 184: 320?C326.
[18] Sharma, S., Joshi, P. K., F??rst, C. Unravelling net primary
productivity dynamics under urbanization and climate change in the western
Himalaya [J]. Ecological Indicators, 2022, 144: 109508.
[19] Rendon, P., Steinhoff-Knopp, B., Burkhard, B. Linking ecosystem
condition and ecosystem services: a methodological approach applied to European
agroecosystems [J]. Ecosystem Services, 2022, 53: 101387.
[20] Jiang, W., Wu, T., Fu, B. J. The value
of ecosystem services in China: a systematic review for twenty years [J]. Ecosystem Services, 2021, 52: 101365.
[21] Costanza, R., D??Arge, R., De Groot, R., et al. The value of
the world??s ecosystem services and natural capital [J]. Nature, 1997,
387(6630): 253?C260.
[22] Chen, J. H., Wang, Y. F., Sun, J., et al. Precipitation
dominants synergies and trade-offs among ecosystem services across the
Qinghai-Tibet Plateau [J]. Global Ecology and Conservation, 2021, 32:
e01886.
[23] Fan, Y. P., Fang, C. L. Evolution process and obstacle factors of
ecological security in western China, a case study of Qinghai Province [J]. Ecological
Indicators, 2020, 117: 106659.
[24] Pan, Z. Z., Gao, G. Y., Fu, B. J. Spatiotemporal changes and driving
forces of ecosystem vulnerability in the Yangtze River Basin, China:
quantification using habitat-structure-function framework [J]. Science of
the Total Environment, 2022, 835: 155494.
[25] Li, K., Hou, Y., Fu, Q., et al. Integrating decision-making
preferences into ecosystem service conservation area identification: a case study of water-related ecosystem services in
the Dawen River watershed, China [J]. Journal of Environmental
Management, 2023, 340: 117972.