30-year Average Monthly/1-km Climate Variable Dataset of
China (1951?C1980, 1981?C2010)
Cheng, Q.1 Wu, X. Q.1 Wei, L. F.1 Hu, X. F.1 Ni, J.1,2*
1. College of Chemistry and
Life Sciences, Zhejiang Normal University, Jinhua 321004, China;
2. Jinhua Mountain Observation and Research Station for
Subtropical Forest Ecosystems, Jinhua 321004, China
Abstract: Spatial
climate data are widely used in meteorology, geography, and ecology. These data
are necessary for studying terrestrial ecosystems and climate change. In this
study, we collected and sorted 30-year averaged meteorological records of
China??s national weather stations in two time periods (1951?C1980, 1981?C2010).
We used the thin plate smoothing spline technique and ANUSPLIN 4.4 software to
interpolate three climatic variables (temperature, precipitation, and
percentage of sunshine). The error statistics of the observed and interpolated
data were calculated using generalized cross validation, mean absolute errors,
root mean squared errors, and linear regression to confirm the accuracy of the
interpolated data. Climate data with 1 km resolution were obtained in three
different raster formats (ASCII character set encoding text file,
two-dimensional uniform grid, and label image file). The spatial distribution
patterns and trends of temperature, precipitation, and percentage of sunshine
were further analyzed.
Keywords: China;
temperature; precipitation; percentage of sunshine; monthly; 30 years
DOI: https://doi.org/10.3974/geodp.2022.04.04
CSTR: https://cstr.escience.org.cn/CSTR:
20146.14.2022.04.04
Dataset Availability Statement:
The dataset
supporting this paper was published and is accessible through the Digital Journal of
Global Change Data Repository at: https://doi.org/10.3974/geodb.2022.06.03.V1 or https://cstr.escience.org.cn/CSTR:20146.11.
2022.06.03.V1.
1 Introduction
Meteorological
records and climate data are the basis of many ecological studies, including
those on the geographic distribution patterns of ecosystems, communities, populations
and species and their relationships with climate[1?C4], climate interpretation of biodiversity patterns[5], and climate-driven mechanisms of
spatiotemporal changes in vegetation biomass and productivity[6?C8]. In the face of climate change,
species distribution and its response to climate change can be further
simulated using climate data[9,10], and so can the impacts of
climate change on ecosystem patterns and functions[9?C13]. Therefore,
meteorological records and climate data are not only the basis of atmospheric science,
but also important driving data for many disciplines and research fields, such
as ecology and earth sciences; they are closely related to human life.
Meteorological
observation data are usually from the continuous instrumental records of
meteorological stations. However, due to the limited number of stations and uneven
spatial distribution, these data are difficult to be directly applied in
large-scale ecological studies. Therefore,
spatial climate variables need to be interpolated. Kriging and thin plate
smoothing spline (TPSS) methods are usually employed to interpolate spatial
climate variables. Many studies have shown that the TPSS method can obtain
highly accurate results[14?C16]. Therefore, this method
and the derivative software ANUSPLIN[17,18] have been widely used
internationally.
Most of the spatial
interpolation datasets of climate variables at global and regional scales are
currently available[3]. Two datasets are commonly used at the global
scale. The first one is WorldClim v2.1. This dataset
contains seven climate variables (mean annual temperature, minimum temperature,
maximum temperature, annual precipitation, solar radiation, wind speed, and
water vapor pressure) with four spatial resolutions (10??, 5??, 2.5??, and 30??) on
the average over the period of 1970?C2000 and 19 bioclimatic variables[19].
The second dataset is the UK Climate Research Unit (CRU) monthly dataset (CRU
TS v4.05) with nine climate variables having 0.5?? resolution grid cells for the
period 1901?C2020[20]. Since 1950, China has gradually established
relevant standardized and widely distributed instrumental meteorological
stations. The numbers of stations and meteorological variables increased after
1980[21]. However, due to the vast territory of China, the
meteorological stations are still limited and unevenly distributed, especially
in the western areas with high mountains and plateaus and the northwestern
desert areas. Therefore, the spatial interpolation of climate variables is
particularly important. In the past 20 years, Chinese scientists have been establishing
several spatial datasets of climate variables for different research purposes.
Examples include the recently published national monthly temperature and precipitation
datasets at 1-km spatial resolution in different time periods (2000?C2012[22],
1901?C2017[23], and 1980?C2017[24]), the dataset of
evaporation and evapotranspiration ratio every eight days at 0.05?? resolution
for 1981?C2015[25], and the national weather-driven dataset at high
spatial and temporal resolutions for 1979?C2018[26]. However, these
datasets have different time scales and used for different purposes by
different groups of scientists. Many time series datasets are available, but
long-term, multi-year-averaged climatic datasets, which are crucial for
ecological studies, are scarce. Given the temporal variability, multi-year
averages of climate variables are commonly used in ecological studies to
characterize the regional patterns of climate. These variables are particularly
important for the simulation of vegetation and species distribution[4].
Therefore, a
multi-year-average climate dataset covering long-time series and having a high
spatial resolution needs to be established. In this study, the observational
records of mean monthly temperature, precipitation, and sunshine percentage
from national meteorological stations in two periods of 1951?C1980 and 1981?C2010
are interpolated into 1-km spatial resolution data by using the TPSS method and
ANUSPLIN software to provide a multi-year-average climate dataset for
ecological and geological studies in China.
2 Metadata of the Dataset
The metadata of the
30-year average monthly/1-km climate variables dataset of China (1951?C1980 and
1981?C2010)[27] are shown in Table 1.
Table 1 Metadata summary of the 30-year average monthly/1-km climate variables dataset of
China (1951?C1980 and 1981?C2010)
|
Items
|
Description
|
|
Dataset full name
|
30-year average
monthly/1-km climate variables dataset of China (1951?C1980 and 1981?C2010)
|
|
Dataset short
name
|
ChinaClimate_1951-2010
|
|
Authors
|
Cheng, Q.,
Zhejiang Normal University, 875544767@qq.com
Wu, X. Q.,
Zhejiang Normal University, 1632314650@qq.com
Wei, L. F.,
Zhejiang Normal University, 552535060@qq.com
Hu, X. F.,
Zhejiang Normal University, 976860215@qq.com
Ni, J.
I-7067-2012, Zhejiang Normal University, nijian@zjnu.edu.cn
|
|
Geographical
region
|
China
|
Time coverage
|
1951?C1980??1981?C2010
|
|
Temporal
resolution
|
Monthly for
30-year average
|
Spatial
resolution
|
1 km
|
|
Data format
|
.asc, .tif, .grd
|
Data size
|
3.35 GB (after
compression)
|
|
Data files
|
Eight files
divided into two time periods: 1951?C1980 and 1981?C2010. Each period consists
of three different file formats
|
|
Foundation
|
Ministry of
Science and Technology of P. R. China (2019QZKK0402)
|
|
Data publisher
|
Global Change
Research Data Publishing & Repository, http://www.geodoi.ac.cn
|
|
Address
|
No. 11A, Datun
Road, Chaoyang District, Beijing 100101, China
|
|
Data sharing
policy
|
Data from
the Global Change Research Data Publishing & Repository includes metadata, datasets
(in the Digital Journal of Global Change Data Repository), and
publications (in the Journal of Global Change Data & Discovery). Data sharing policy
includes: (1) Data are openly available and can be free downloaded via the
Internet; (2) End users are encouraged to use Data subject to citation;
(3) Users, who are by definition also value-added service providers, are welcome
to redistribute Data subject to written permission from the GCdataPR Editorial
Office and the issuance of a Data redistribution license; and (4)
If Data
are used to compile new datasets, the ??ten per cent principal?? should be
followed such that Data records utilized should not
surpass 10% of the new dataset contents, while sources should be clearly
noted in suitable places in the new dataset[28]
|
|
Communication and searchable system
|
DOI, CSTR, Crossref, DCI, CSCD,
CNKI, SciEngine, WDS/ISC, GEOSS
|
3 Methods
3.1 Data collection
The
meteorological data included the standardized monthly records of surface
climates during 1951?C1980 and 1981?C2010. The former originated from the Chinese
Surface Climate Dataset (1951?C1980)[29] and a personal collection of
a small amount of data. The latter was from the China Meteorological Data
Service Center, and the data on Taiwan Province were from the Central Weather
Bureau of Taiwan. The metadata of the dataset consisted originally of standardized
monthly values of temperature, precipitation, sunshine duration, percentage of
sunshine, air humidity, evaporation, snow accumulation, and wind and soil temperatures
recorded by the national basic and benchmark surface meteorological stations.
In this study, only three variables (temperature, precipitation, and percentage
of sunshine) were selected for interpolation. For 1951?C1980, the publicly
available data of 673 national benchmark and basic stations were included together
with the personal collection of 200 national or provincial general stations.
The records with short time spans were excluded, and 858 meteorological station
records were finally used for interpolation. For 1981?C2010, 2152 meteorological
records of national benchmark, basic, and general stations were included
(Figure 1). Given the differences in the number of stations between the two
time periods, especially in the western region, and the ambiguous
classification of some early stations, all meteorological stations were
referred to as national surface meteorological stations.
The two monthly
datasets of standard surface climates used in this study were processed by the
National Meteorological Information Center in accordance with the standard
national statistical compilation method for climate data. The station files
with problems and disagreements were revised separately, and stations with
obvious non-uniformity (e.g., station removal) were processed separately in
accordance with different time periods before and after the station removal,
thus ensuring the uniformity and accuracy of the data. The two original
datasets were interpolated separately, and the results were relatively
independent so that problems, such as station removal, in one set of data would
not affect the other.

Figure 1 Spatial distribution of weather stations
in China
3.2 Algorithms
The
12 monthly values of each climate variable were interpolated into raster data
with a spatial resolution of 0.01?? (??1 km) by using the georeferenced TPSS method[17,18] and
ANUSPLIN 4.4 software[30]. This interpolation was combined with the
U.S. Shuttle Radar Topographic Mapping Mission digital elevation model[31],
whose original record had 90 m spatial resolution and resampled to 0.01??.
The TPSS method
is a widely validated approach for fitting and interpolating climate surfaces.
It can fit discrete data as spline function curves with one to multiple independent
variables, so it is widely used in global and regional climate interpolations.
The method and its software ANUSPLIN are commonly used in China, and their
solid reliability and superiority over other interpolation methods have been
proven[14,32,33]. In the interpolation of ANUSPLIN software based on
this method, the latitude and longitude are used as the independent variables
of the spline function, and elevation is adopted as the covariate to establish
the change in temperature along the altitudinal gradient (temperature lapse
rate). A local TPSS is constructed to fit the 12-month temperature ratio change
in time and space and achieve temperature interpolation. For precipitation interpolation,
the original TPSS function is used to fit the surface, and elevation is adopted
as the independent variable instead of the covariate. For the interpolation of
the percentage of sunshine, the altitude is not used for fitting, but
precipitation data can be used for verification. This study employed the
above-mentioned common parameter settings and the default settings in the
software[30] for the other parameters to fit and interpolate the
monthly temperature, precipitation, and sunshine percentage.
4 Data Results and Validation
4.1 Data Composition
The
0.01?? spatial resolution raster datasets of temperature, precipitation, and
percentage of sunshine for 1951?C1980 and 1981?C2010 were available in eight
compressed folders. The file naming rules were as follows.
ChinaClimate_S_Z.rar. S indicated the years, including 1951?C1980 and 1981?C2010.
Z indicated the format of the data, namely, a two-dimensional uniform grid
format (.grd), ASCII character set encoded text file format (.asc), and labeled
image file format (.tif), which could be used for different research purposes.
4.2 Data Products
By
ANUSPLIN interpolation, the data with geo-location longitude, latitude, and
climate values were obtained as two-dimensional uniform grid files, which were
then converted into ASCII character set encoded text files and label image
files by the Python program of ArcGIS 10.5 version. The spatial distribution
characteristics of three climate variables were statistically analyzed, and the
spatial distribution of each climate variable was mapped using ArcGIS based on
the vegetation regionalization map of China[34]. For the two 30-year
periods, the spatial distribution characteristics of the January, July, and annual
values of each climate variable were briefly described, and the temporal trends
between the two time periods were compared. The comparisons included the
differences between two climate variables (mean annual temperature and
percentage of sunshine) and the rate of annual precipitation change (precipitation
in 1981?C2010 - precipitation in 1951?C1980) /
precipitation in 1981?C2010).
4.2.1 Temperature
The
overall trend of temperature in China showed a decreasing trend from the
southeast to the northwest. The mean temperature in January (Figure 2a, 2b)
decreased greatly from south to north, with relatively high temperatures in
southern and central China and relatively low temperatures in northeast, north,
and northwest areas and the Qinghai?CTibet Plateau. The maximum values appeared
in the tropical monsoon and rain forest region, followed by the subtropical
evergreen broadleaf forest region, both of which had temperatures higher than
0 ??. The third
highest value was in the warm-temperate deciduous broadleaf forest region with
a temperature of −5 ??, followed by the temperate desert region and the temperate steppe
region with temperatures lower than −10 ?? and −15 ??, respectively. The January temperature in the Qinghai-Tibet Plateau
alpine vegetation region was between the values for the desert and steppe
regions. The temperate mixed coniferous and broadleaf deciduous forest region
had a temperature near −20 ??, and the cold-temperate coniferous forest region had a temperature
near −30 ??. The mean
temperature in January increased in 1981?C2010 compared with the average during
1951?C1980, with a relatively large increase in the cold-temperate coniferous forest
region, the tropical monsoon and rain forest region, and the temperate mixed
coniferous and broadleaf deciduous forest region. The smallest increase was in
the Qinghai?CTibet Plateau alpine vegetation region.
The differences
between the north and south in terms of the mean temperature in July (Figure
2c, 2d) were relatively small, but relatively low in the Qinghai?CTibet Plateau
and central and western alpine regions. The regional differences in the mean
temperature in July were smaller than those of the mean temperature in January.
The Qinghai?CTibet Plateau alpine vegetation region had the minimum July
temperature of about 6?C7 ??, followed by the cold-temperate coniferous forest region with a
minimum July temperature between 17 ?? and 18 ?? and other regions with temperatures above 20 ??. The maximum July temperature of
about 24 ?? appeared in
the warm-temperate deciduous broadleaf forest region. The mean temperature in
July in the last 30 years also increased, especially in the Qinghai?CTibet
Plateau alpine vegetation region (more than 1 ??).
The mean annual
temperature (Figure 2e, 2f) also showed a decreasing trend from south to north
and from southeast to northwest, with relatively high temperatures in southern,
central, and northwestern China and relatively low temperatures in the northeast
of China and the Qinghai?CTibet Plateau. The difference in the mean annual temperature
in each vegetation region was small. The minimum mean temperature of about
−4 ?? appeared in
the Qinghai?CTibet Plateau alpine vegetation region, which was colder than the
cold-temperate coniferous forest region (less than 0 ??). The mean annual temperature was higher
than 1?? and 5 ?? in the temperate mixed coniferous
and broadleaf deciduous forest region and temperate desert region,
respectively, and the temperature of the temperate steppe region was in between.
The other regions had a temperature above 10 ??. The maximum value of 16???C17 ?? appeared in the tropical monsoon
and tropical forest region. The mean annual temperature in the majority of
China increased generally over the past 60 years, especially in the Hengduan
Mountain region on the southern edge of the Qinghai?CTibet Plateau (Figure 2g).
However, the minority of the regions in central and southwestern China,
particularly Tianshan Mountains, showed a downward trend.
4.2.2 Precipitation
Generally,
the precipitation in China showed a decreasing trend from southeast to northwest.
The precipitation in January (Figure 3a, 3b) decreased widely from southeast to
northwest, with a relatively high value in the southern areas. The maximum
value of about 30?C35 mm appeared in the subtropical evergreen broadleaf forest
region. The next value of about 18?C19 mm was in the tropical monsoon and
tropical rain forest region, and the other regions had precipitation below 10
mm. The minimum value of about 2.5 mm appeared in the temperate desert region.
Compared with the period of 1951?C1980, the last 30 years showed an overall
increase. The increase in the subtropical evergreen broadleaf forest region was
relatively high and reached 6 mm per year. Meanwhile, the other regions showed
a small decrease, with a maximum decrease of 1 mm in the tropical monsoon and
tropical rain forest regions.
The differences
between north and south in terms of the precipitation of July (Figure 3c, 3d)
were relatively large, which meant that the precipitation in summer was
generally high across China but relatively low in the northwest. The July
precipitation in the different regions varied significantly. The minimum of
about 30 mm appeared in the temperate desert region, which is drier than the
temperate steppe region with precipitation of about 100 mm and the other regions
with precipitation above 130 mm. The maximum value of above 200 mm appeared in
the tropical monsoon and tropical rain forest region. Compared with the period
of 1951?C1980, the last 30 years showed an overall increase, except for the
slight decrements in the cold-temperate coniferous forest region,
warm-temperate deciduous broadleaf forest region, and temperate steppe region.
The largest increase was observed in the tropical monsoon and tropical rain
forest regions, the values of which exceeded 30 mm.
The annual precipitation (Figure 3e, 3f) also showed a decreasing trend
from south to north and from southeast to northwest. The precipitation in south
China was relatively high, whereas that in northwest, north, and Qinghai?CTibet
Plateau was relatively low. The maximum annual precipitation (near 1,350 mm)
appeared in the tropical monsoon and tropical rain forest region (above 1,200
mm), followed by the temperate coniferous and deciduous broadleaf mixed forest
and the warm-temperate deciduous broadleaf forest region (600?C700 mm) then the
cold-temperate coniferous forest region and the Qinghai?CTibet Plateau alpine
vegetation region (500 and 350 mm, respectively). The annual precipitation of
the temperate steppe region was in between. The minimum of about 140 mm
appeared in the temperate desert region. Compared with the annual precipitation
in 1951?C1980, the annual precipitation in 1981?C2010 decreased, especially in
the warm-temperate broadleaf deciduous forest region, by more than 48 mm. The
change rate of annual precipitation in the two time periods (Figure 3g) was complex.
The increasing trend was obvious in the southeast, south, and part of southwest
China. The annual precipitation in the northwest, Qinghai?CTibet Plateau, and
northeast of China greatly increased, whereas the precipitation in the central
regions decreased obviously.
|
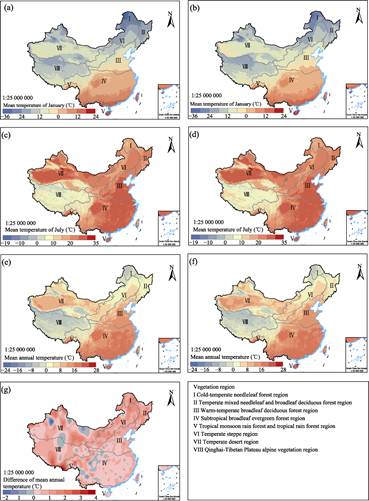
Figure 2 Maps of spatial distribution of temperature
in China (1951?C1980, 1981?C2021)
|

Figure 3 Maps of spatial distribution of precipitation
in China (1951?C1980, 1981?C2021)
|
4.2.3 Percentage of Sunshine
The differences between north and south in
terms of the percentage of sunshine in January across China (Figure 4a, 4b)
were large. The sunshine percentage was low in the south and northwest of China
and in the southeastern part of the Qinghai?CTibet Plateau but relatively high
in the other regions. The sunshine percentages in January in the temperate
steppe region, temperate desert region, and Qinghai?CTibet Plateau alpine vegetation
region were higher than 65%, followed by those of the cold-temperate coniferous
forest region and tropical monsoon and tropical forest region (less than 65%
and 50%, respectively). The sunshine percentages of the temperate mixed
coniferous and broadleaf deciduous forest region and the warm-temperate deciduous
broadleaf forest region were in between. The minimum value of about 35%?C40%
appeared in the subtropical evergreen broadleaf forest region. The January
sunshine percentage decreased from 1951?C1980 to 1981?C2010, especially in the
temperate mixed coniferous and broadleaf deciduous forest region and the
warm-temperate deciduous broadleaf forest region (reduction > 5%), whereas
that in the Qinghai?CTibet Plateau alpine vegetation region increased by nearly
2%.
The percentage of sunshine in July (Figure 4c,
4d) varied considerably between the east and the west, which meant that
percentage of sunshine in summer was generally high across China but relatively
low in the southwest and northeast regions. The maximum July sunshine
percentage appeared in the temperate desert region, followed by the steppe
region and Qinghai?CTibet Plateau alpine vegetation region (all higher than
55%). The next value of about 50% was observed in the warm-temperate deciduous
broadleaf forest region and the cold-temperate coniferous forest region. The
values for the other regions were below 50%. The amount of July sunshine
generally decreased from 1951?C1980 to 1981?C2010, especially in the
warm-temperate deciduous broadleaf forest region and the subtropical evergreen
broadleaf forest region (>5%), whereas that in the Qinghai?CTibet Plateau
alpine vegetation region increased by nearly 1%. The mean annual percentage of
sunshine (Figure 4e, 4f) also showed an increasing trend from south to north
and from southeast to northwest. It was high in the north and northwest of
China and in the Qinghai?CTibet Plateau, but relatively high in the southern
regions. It was higher than 60% in the temperate steppe region, the temperate
desert region, and the Qinghai?CTibet Plateau alpine vegetation region. The
next values were between 50% and 60% in the cold-temperate coniferous forest
region, the temperate mixed coniferous and broadleaf deciduous forest region,
and the warm-temperate deciduous broadleaf forest region, followed by the
subtropical broadleaf evergreen forest region and the tropical monsoon and
tropical rain forest region (all < 50%).
|
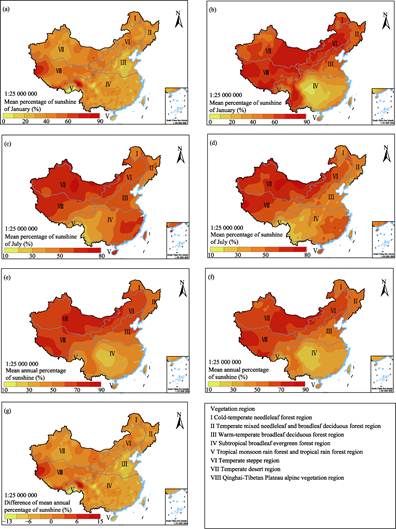
Figure 4 Maps of spatial distribution of percentage
of sunshine in China (1951?C1980,1981?C2021)
|
Compared with
the sunshine percentage of 1951?C1980, that of 1981?C2010 generally decreased by
within 5%, except for an increase of nearly 1% in most part of the Qinghai?CTibet
Plateau alpine vegetation region. The values for the other regions decreased by
within 5%. Meanwhile, the central and western parts of northern China and the
western and northeastern parts of the Qinghai?CTibet Plateau showed an increasing
trend (Figure 4g).
4.3 Data Validation
4.3.1 Quality Control
The
generalized cross validation (GCV) method is used in ANUSPLIN to compare the interpolated
and observed climates and test the reliability of the interpolated data. In
this study, the generalized cross-validation root mean square (RTGCV), mean
absolute error (MAE), and root mean square error (RMSE) were used as the
indicators of evaluation[24,30]. The calculation formulas were as
follows:
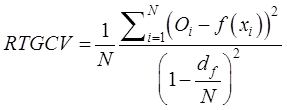 , (1)
, (1)
 , (2)
, (2)
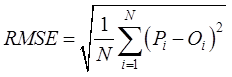 , (.3)
where Oi is the true observed value, f(xi) is the smooth function value of component
variable x around point i,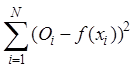 is the residual sum of squares, df
is the degree of freedom of the model, Pi the interpolation result, and N is the number of samples.
is the residual sum of squares, df
is the degree of freedom of the model, Pi the interpolation result, and N is the number of samples.
In accordance with the geographical
coordinates of the meteorological stations in the two datasets and their
original climate data, the corresponding values of each element of the interpolation
dataset were extracted using the ??Extract values from point?? tool in ArcGIS
software, and the correlation between the original and interpolation data was
verified through linear fitting to further test the accuracy and credibility of
the interpolated data. In addition, the density and distribution patterns of
meteorological stations can affect the accuracy of interpolated data. In this
study, the number of stations in the two time periods was different. We further
compared the difference between the MAE and RMSE of the interpolated data with
different station densities.
4.3.2 Quality Evaluation
Through the GCV test on all input
data, the overall data could be judged based on its RTGCV. The RTGCV of the
monthly climate variables in 1951?C1980 and 1981?C2010 (Figure 5) showed that the
RTGCV changes in temperature and precipitation were relatively stable. In the
first 30 years, the RTGCV of temperature fluctuated in the range of
0.7?C1.5 ??C, with the largest change in winter and the smallest in summer.
The RTGCV of precipitation fluctuated roughly in the range of 0.7?C1.6 mm, with
the maximum in autumn and the minimum in spring. For the next 30 years, the
RTGCV of temperature fluctuated in the range of 0.4?C0.7 ??C, with the
largest in winter and the smallest in summer. The RTGCV of precipitation
fluctuated roughly in the range of 0.3?C0.8 mm, with the maximum in summer and
the minimum in spring.
|
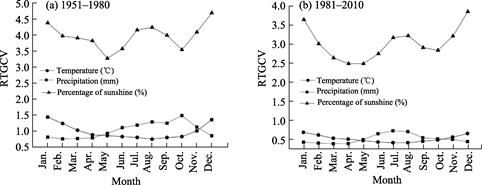
Figure 5 The generalized
cross-validation root mean square (RTGCV) of temperature, precipitation, and
percentage of sunshine
|
The sunshine percentage was affected by many factors,
and its RTGCV fluctuated in the range of 2.5%?C4.8%. The seasonal variation of
the meteorological data inevitably increased the interpolation error of the
climate variables, but the data quality was controllable and reasonable as a
whole. The MAE and RMSE (Table 2) of the interpolation can also be used to test
the accuracy of the interpolated data. MAE reflects the size of the estimated
error, and the closer the value is to zero, the better the result is[32].
In this study, the MAE of temperature in winter and spring was large, whereas
that in summer and autumn was small, but both were relatively small. The value
was between 0.75 and 1.41 in 1951?C1980, and between 0.42 and 0.69 in 1981?C2010,
indicating that the temperature interpolation was accurate and reliable. On the
contrary, the MAE of precipitation in winter and spring was smaller than that
in summer and autumn, which was related to the amount of precipitation in
different seasons. However, it was also relatively small, and the coefficient
of variation was low, with an average of 28% in the first 30 years and 13% in
the next 30 years. The seasonal characteristics of the MAE of sunshine
percentage were unobvious and mostly between 2.5 and 4.6, so the data accuracy
was good. RMSE measures the average dispersion of a set of data. The smaller
the standard deviation is, the more stable the data are. In this study, the
mean RMSE of temperature in the first 30 years was within 0.06 (Table 2), and
that in the next 30 years was within 0.04, indicating that the temperature
interpolations were highly stable. The average RMSE of sunshine percentage was
within 0.2, indicating that the data were also stable.
Table 2 Statistics of mean absolute errors
(MAE) and root mean squared errors (RMSE) of temperature, precipitation, and
percentage of sunshine in China (1951?C1980, 1981?C2010)
|
|
Temperature
(??)
|
Precipitation
(mm)
|
Sunshine
percentage (%)
|
|
Month
|
1951?C1980
|
1981?C2010
|
1951?C1980
|
1981?C2010
|
1951?C1980
|
1981?C2010
|
|
|
MAE
|
RMSE
|
MAE
|
RMSE
|
MAE
|
RMSE
|
MAE
|
RMSE
|
MAE
|
RMSE
|
MAE
|
RMSE
|
|
1
|
1.41
|
0.083
|
0.69
|
0.049
|
4.05
|
0.264
|
2.13
|
0.121
|
4.30
|
0.216
|
3.72
|
0.223
|
|
2
|
1.21
|
0.071
|
0.62
|
0.044
|
4.25
|
0.265
|
2.23
|
0.117
|
3.88
|
0.195
|
3.07
|
0.185
|
|
3
|
1.02
|
0.060
|
0.54
|
0.038
|
5.45
|
0.315
|
2.82
|
0.135
|
3.79
|
0.190
|
2.69
|
0.162
|
|
4
|
0.87
|
0.051
|
0.52
|
0.037
|
7.60
|
0.400
|
3.63
|
0.173
|
3.77
|
0.190
|
2.56
|
0.154
|
|
5
|
0.85
|
0.050
|
0.48
|
0.034
|
12.00
|
0.645
|
6.19
|
0.321
|
3.18
|
0.159
|
2.57
|
0.154
|
|
6
|
0.82
|
0.048
|
0.44
|
0.030
|
17.80
|
0.998
|
10.30
|
0.589
|
3.52
|
0.177
|
2.82
|
0.169
|
|
7
|
0.80
|
0.047
|
0.42
|
0.030
|
22.00
|
1.260
|
13.20
|
0.806
|
4.14
|
0.209
|
3.27
|
0.196
|
|
8
|
0.75
|
0.044
|
0.43
|
0.030
|
23.20
|
1.350
|
12.00
|
0.752
|
4.25
|
0.214
|
3.34
|
0.200
|
|
9
|
0.81
|
0.047
|
0.47
|
0.033
|
17.60
|
1.010
|
6.96
|
0.418
|
3.96
|
0.200
|
3.00
|
0.180
|
|
10
|
0.83
|
0.049
|
0.51
|
0.035
|
14.90
|
0.893
|
4.51
|
0.237
|
3.47
|
0.175
|
2.91
|
0.175
|
|
11
|
1.01
|
0.059
|
0.58
|
0.041
|
7.55
|
0.470
|
3.00
|
0.160
|
4.02
|
0.202
|
3.27
|
0.197
|
|
12
|
1.33
|
0.078
|
0.67
|
0.047
|
4.21
|
0.275
|
2.07
|
0.122
|
4.62
|
0.232
|
3.92
|
0.236
|
|
Mean
|
0.98
|
0.057
|
0.53
|
0.037
|
11.72
|
0.679
|
5.75
|
0.329
|
3.91
|
0.197
|
3.10
|
0.186
|
|
|
|
|
|
|
|
|
|
|
|
|
|
|
For historical reasons, the number of meteorological
stations from 1951 to 1980 accounted for only about 40% of that from 1981 to
2010. The number and density of stations increased significantly in the last 30
years, but the spatial distribution pattern of the meteorological stations in
the two periods was basically the same. The greater the density of the stations
was, the smaller the interpolation error was and the better the interpolation
was, especially for the two variables of temperature and precipitation.
The comparison between the observation of
meteorological stations in the two time periods and the corresponding grid
point interpolation showed a significant linear positive correlation (Figure 6),
effectively reflecting the real climate situation. Regardless of the time
period, the R2 of
temperature (Figure 6a, 6b) and sunshine percentage (Figure 3e, 3f) were
between 0.97 and 0.99, indicating that the accuracy of the interpolation was
extremely high. The R2 of
precipitation fitting was 0.93 and 0.98 (Figure 6c, 6d), and the accuracy of
the interpolation was relatively low probably because ANUSPLIN underestimated
the precipitation.
5 Discussion and Conclusion
In this study. The temperature,
precipitation, and sunshine percentage were interpolated into grid data with a
spatial resolution of 0.01?? (??1
km) on the basis of the monthly records of China??s surface meteorological
stations and by using the TPSS method and ANUSPLIN 4.4 software. The
interpolation method applied in this study, TPSS, is a well-verified general
geographic reference interpolation method and has been proven to be effective
and reliable. For the dataset, three methods were employed for quality control
and evaluation: generalized cross validation was used to test the validity of
the original station data, mean absolute and root mean square errors were
employed to evaluate the accuracy of the interpolated data, and linear fitting
of the station and interpolated data was applied to verify the accuracy again.
The
interpolation method adopted in this study has some advantages, and the spatial
resolution of 0.01?? is high, both of which mean that the climate interpolations
are reliable and can be used as an effective substitute for the extraction of
Chinese climate data from global datasets. In addition to the three climate
variables considered in this study, other variables, such as underground
temperature, relative humidity, evaporation, and wind speed, can also be
interpolated. This dataset can be further utilized or referenced as: (1) basic
data for studying the relationship between species or ecosystems and climate at
national or regional scales to analyze their geographical distribution, dynamic
changes, and climate driving mechanisms; (2) input data for driving species distribution
models to simulate the potential
|
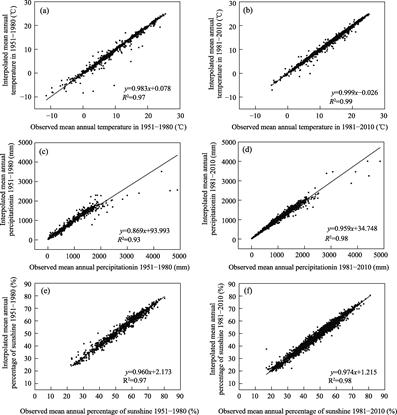
Figur 6 Comparative validation of
observed and interpolated climate data
|
geographical distribution of plant and animal
species in China. At the early stage of plant species modeling, Chinese
scientists mostly used the WorldClim climate dataset[4]. The dataset
proposed in this study, especially the data from 1981 to 2010, may produce
improved simulations if it can be combined with other ecologically meaningful
bioclimatic variables[3,35] because this regional interpolation
approach uses numerous meteorological stations, and its accuracy has been well
verified. This dataset can also be further utilized as (3) input data for
driving large-scale terrestrial biosphere models or other vegetation models to
simulate the potential geographical distribution of vegetation in China and its
productivity and carbon cycles. CRU or WorldClim data have been commonly used
in the past, but the current dataset could be a reliable substitute. If it is
combined with the interpolation of time series climate data[36], the
dynamic change in vegetation can be further simulated. Moreover, this dataset
can be further utilized as (4) basic data that can be applied in the study of
climate and vegetation regionalization and in other studies in ecology, atmosphere
science, and geography.
Author Contributions
Cheng, Q. collected, processed, and analyzed
the data and wrote the manuscript. Wu, X. Q., Wei, L. F., and Hu, X. F. contributed
to the data processing and analyses. Ni, J. designed the research and interpolation
method and finalized the paper.
Acknowledgements
The authors are grateful to the China Meteorological Data
Service Center and the Central Weather Bureau of Taiwan province for providing
the observational records of the meteorological stations. The authors also
thank Chen, X. Y. for assisting in the climate data processing.
Conflicts of Interest
The authors declare no conflicts of interest.
References
[1]
Fang, J. Y. Ecoclimatological
analysis of the forest zones in China [J]. Acta
Ecologica Sinica, 1991, 11(4): 377‒387.
[2]
Zhang, X. S. A
vegetation-climate classification system for global change studies in China
[J]. Quaternary Sciences, 1993,
13(2): 157‒169, 193.
[3]
Ni, J. An introduction to
bioclimatic factors in global change research [J]. Quaternary Sciences, 2017, 37(3): 431‒441.
[4]
Liu, X. T., Yuan, Q., Ni, J.
Research advances in modelling plant species distribution in China [J]. Chinese Journal of Plant Ecology, 2019,
43(4): 273‒283.
[5]
Feng, J. M. Spatial patterns of
species diversity of seed plants in China and their climatic explanation [J]. Biodiversity Science, 2008, 16(5):
470‒476.
[6]
Piao, S. L., Fang, J. Y., He,
J. S., et al. Spatial distribution of
grassland biomass in China [J]. Chinese
Journal of Plant Ecology, 2004, 28(4): 491‒498.
[7]
Piao, S. L., Fang, J. Y., Zhou,
L. M., et al. Changes in vegetation
net primary productivity from 1982 to 1999 in China [J]. Global Biogeochemical Cycles, 2005, 19(2): GB2027.
[8]
Liu, L., Yang, H., Xu, Y., et al. Forest biomass and net primary
productivity in southwestern China: a meta-analysis focusing on environmental
driving factors [J]. Forests, 2016,
7(12): 173.
[9]
Cui, S. P., Luo, X., Li, C. W.,
et al. Predicting the potential
distribution of white-lipped deer using the MaxEnt model [J]. Biodiversity Science, 2018, 26(2):
171‒176.
[10]
Zhang, X. J., Gao, X. M., Ji,
C. J., et al. Response of abundance
distribution of five species of Quercus to climate change in Northern China
[J]. Chinese Journal of Plant Ecology,
2019, 43(9): 774‒782.
[11]
Ni,
J., Sykes, M. T., Prentice, I. C., et al.
Modelling the vegetation of China using the process-based equilibrium
terrestrial biosphere model BIOME3 [J]. Global
Ecology and Biogeography, 2000, 9(6): 463‒479.
[12]
Ni, J. Carbon storage in
terrestrial ecosystems of China: estimates at different spatial resolutions and
their responses to climate change [J]. Climatic
Change, 2001, 49(3): 339‒358.
[13]
Piao, S., Ciais, P., Huang, Y.,
et al. The impacts of climate change
on water resources and agriculture in China [J]. Nature, 467(7311): 43‒51.
[14]
Yan, H. Modeling spatial
distribution of climate in China using thin plate smoothing spline interpolation
[J]. Scientia Geographica Sinica,
2004, 24(2): 163‒169.
[15]
Hijmans. R. J., Cameron, S. E.,
Parra, J. L., et al. Very high
resolution interpolated climate surfaces for global land areas [J]. International Journal of Climatology,
2005, 25(15): 1965‒1978.
[16]
Tan, J. B., Li, A. N., Lei, G.
B. Contrast on Anusplin and Cokriging meteorological spatial interpolation in
southeastern margin of Qinghai-Xizang Plateau [J]. Plateau Meteorology, 2016, 35(4): 875‒886.
[17]
Hancock, P. A., Hutchinson, M.
F. Spatial interpolation of large climate data sets using bivariate thin plate
smoothing splines [J]. Environmental
Modelling & Software, 2006,
21(12): 1684‒1694.
[18]
Xu, T. B., Hutchinson, M. F. New
developments and applications in the ANUCLIM spatial climatic and bioclimatic
modelling package [J]. Environmental
Modelling & Software, 2013,
40: 267‒279.
[19]
Fick, S. E., Hijmans, R. J.
WorldClim 2: new 1-km spatial resolution climate surfaces for global land areas
[J]. International Journal of Climatology,
2017, 37(12): 4302‒4315.
[20]
Harris, I., Osborn, T. J.,
Jones, P., et al. Version 4 of the
CRU TS monthly high-resolution gridded multivariate climate dataset [J]. Scientific Data, 2020, 7: 109.
[21]
Chen, L. X., Zhou, X. J., Li,
W. L., et al. Characteristics of the
climate change and its formation mechanism in China in last 80 years [J]. Acta Meteorologica Sinica, 2004, 62(5):
634‒646.
[22]
Wang, J. B., Wang, J. W., Ye,
H., et al. An interpolated
temperature and precipitation dataset at 1 km grid resolution in China
(2000??2012) [J/OL]. China Scientific Data,
2017, 2(1): 73‒80.
[23]
Peng, S. Z., Ding, Y. X., Liu,
W. Z., et al. 1 km monthly
temperature and precipitation dataset for China from 1901 to 2017 [J]. Earth System Science Data, 2019, 11(4):
1931‒1946.
[24]
Chen, W., Sun, L. Q., Li, Q.
L., et al. An interpolation dataset
for temperature and precipitation at 1km grid resolution in Chinese mainland
for recent 38 Years [J]. Meteorological
Science and Technology, 2021, 49(3): 355‒361.
[25]
Niu, Z. G., He, H. L., Zhu, G.
F., et al. A spatial-temporal
continuous dataset of the transpiration to evapotranspiration ratio in China
from 1981-2015 [J]. Scientific Data, 2020, 7: 369.
[26]
He, J., Yang, K., Tang, W., et al. The first high-resolution
meteorological forcing dataset for land process studies over China [J]. Scientific Data, 2020, 7: 25.
[27]
Cheng Q., Wu, X. Q., Wei, L.
F., et al. 30-year average
monthly/1-km climate variables dataset of China (1951-1980, 1981-2010)
[J/DB/OL]. Digital Journal of Global
Change Data Repository, 2022, https://doi.org/10.3974/geodb.2022.06.03.V1.
https://cstr.escience.org.cn/CSTR:20146.11.2022.06.03.V1.
[28]
GCdataPR Editorial Office.
GCdataPR data sharing policy [OL]. https://doi.org/10.3974/dp.policy.2014.05
(Updated 2017).
[29]
The Central Meteorological
Administration Information Office. The Dataset of China??s Climate Surface [M].
Beijing: Meteorological Press, 1984.
[30]
Hutchinson, M. F., Xu, T. B.
ANUSPLIN Version 4.4 User Guide [M]. Canberra: Fenner School of Environment and
Society, the Australian National University, 2013.
[31]
Farr, T. G., Rosen, P. A.,
Caro, E., et al. The shuttle radar
topography mission [J]. Reviews of Geophysics,
2007, 45(2): RG2004.
[32]
Liu, Z. H., Li, L. T., McVicar,
T. R., et al. Introduction of the
professional interpolation software for meteorology data: ANUSPLINN [J]. Meteorological Monthly, 2008, 34(2): 92-100.
[33]
Jiang, X. J., Liu, X. J.,
Huang, F., et al. Comparison of
spatial interpolation methods for daily meteorological elements [J]. Chinese Journal of Applied Ecology,
2010, 21(3): 624‒630.
[34]
The Editorial Committee of
Vegetation Map of China, Chinese Academy of Science. Vegetation Atlas of China
(1:1000 000) [M]. Beijing: Science Press, 2001.
[35]
Wei, L. F., Hu, X. F., Cheng,
Q., et al. A dataset of spatial
distribution of bioclimatic variables in China at 1km resolution [J/OL]. China Scientific Data, 2022. DOI:
10.11922/11-6035.csd.2022.0003.zh.
[36]
Wu, X. Q., Cheng, Q., Wei, L.
F., et al. A time series dataset of
climate variables from 1951 to 2014 in karst region of southwestern China
[J/OL]. China Scientific Data, 2022.
DOI: 10.11922/11-6035.csd. 2022.0004.zh.