Remote
Sensing Technology Based on an Algorithm for Cotton Spatial Distribution in Aksu-Alaer
Region (2020)
1. National
Engineering Technology Research Center for Desert-Oasis Ecological
Construction, Xinjiang Institute of Ecology and Geography,
Chinese Academy of Sciences, Urumqi 830054, China;
2. University of
Chinese Academy of Sciences, Beijing 100049, China;
3.
Division of Risk Monitoring and Comprehensive Disaster
Reduction, Department of Emergency Management, Xinjiang Uygur Autonomous Region, Urumqi 830011,
China
Abstract: Aksu
and Alaer region means the Aksu prefecture and Alaer city
in the central region of Xinjiang, China. Based on images from Landsat 8,
Sentinel-2, and MOD13Q1 acquired in 2020 and the Google Earth Engine (GEE)
platform, the authors extracted the cotton planting area (cotton fields) using
the random forest method and classification post-processing in the Aksu
Prefecture and Alaer city (excluding Wushi and Baicheng due to extremely low
cotton planting). The overall classification accuracy of the images in each
county was above 0.9, with Kappa coefficients all exceeding 0.8. The dataset
includes: (1) distribution of cotton fields with
spatial resolution of 250 m; (2) sample point data. This dataset is archived in
.tif and .shp formats, and consists of 17 data files with data size of 385 KB
(compressed into 1 file with 134 KB).
Keywords: Aksu
prefecture; Alaer city; cotton; random forest
DOI: https://doi.org/10.3974/geodp.2023.04.05
CSTR: https://cstr.escience.org.cn/CSTR:20146.14.2023.04.05
Dataset Availability Statement:
The dataset supporting this paper
was published and is accessible through the Digital Journal of Global Change Data Repository
at: https://doi.org/10.3974/geodb.2024.02.10.V1
or https://cstr.escience.org.cn/CSTR:20146.11.2024.02.10.V1.
1 Introduction
Cotton, the second largest crop after grain in China??s agricultural
landscape, is becoming increasingly prominent. In China, there are three major
cotton-growing regions: the Yangtze River basin, the Yellow River basin, and
the northwest inland region, with Xinjiang as the main hub[1].
Xinjiang cotton, a crucial link in the global cotton industry chain, represents
a pillar industry in the domestic economy and international market. Among the
key cotton-producing areas in Xinjiang, the Aksu-Alaer region is of paramount
importance; according to statistics from 2020, the cotton cultivation area in
the Aksu-Alaer region reached 664 thousand hectares, accounting for 26.52% of
the total cotton cultivation area in Xinjiang[2,3]. Therefore,
gaining a comprehensive understanding of the spatial distribution pattern of
cotton in the Aksu-Alaer region is crucial for the effective planning of
planting spaces for cotton in this area. However, extracting spatial
distribution patterns of cotton fields using remote sensing imagery often
requires large amounts of ground survey data as training samples and field
surveys consume considerable manpower and resources; thus, obtaining sufficient
training samples over large areas remains challenging[4]. However,
the Google Earth Engine (GEE) has emerged as an effective approach to address
this issue. The GEE is a cloud-based platform for planetary-scale geographic
spatial analysis that leverages Google??s immense computational power to address
various high-impact societal issues, including
deforestation, droughts, disasters, diseases, food security, water management,
climate monitoring, and environmental protection. Many machine learning
algorithms can be employed for remote sensing image classification, such as
artificial neural networks[5], decision trees[6,7], and support vector machines[8]. Of these, the Random Forest (RF) approach, which has the advantages of high classification accuracy, ability
to handle large numbers of input variables, and capability to balance errors,
has been widely used for land-cover classification[9,10].
Remote-sensing cloud-computing technology and RF methods have been extensively
applied to extract cotton information in Xinjiang. For instance, Zhou[11] utilised the PIE Engine Studio and GEE
platforms to extract the spatial distribution of cotton in Shihezi, Xinjiang,
using the RF method based on NDVI and EVI data as feature indices. Similarly,
Lv[12] utilised
the PIE platform and Sentinel-2 data from the GEE platform to extract the
spatial distribution of cotton in Alaer city in 2020. Finally, Wang[13], using Sentinel-2 data from the GEE platform,
applied random forest, support vector machine, and decision tree methods to
extract cotton information in the Mosuowan reclamation area. However, further
research is needed on the spatial distribution of cotton in the Aksu-Alaer
region.
Therefore, this study, using the GEE
platform and data from Landsat 8, Sentinel-2, and MOD13Q1, used the random forest classification
method to construct a dataset of cotton spatial distribution in the Aksu-Alaer
region of Xinjiang in 2020, with the aim of providing a reference for planning
the spatial distribution pattern of cotton planting in the Aksu-Alaer region.
2 Metadata of
the Dataset
The metadata of the Cotton field dataset based on multi-satellite
images in the Aksu and Alaer region (2020)[14] are summarised in Table 1.
3 Methods
3.1 Data
Sources
This
study uses the Google Earth Engine (GEE) platform and high-resolution remote
sensing imagery, including 30-m spatial resolution Landsat8 data and 10-m
spatial resolution Sentinel-2 data, for visual interpretation of the cotton
area in the Aksu-Alaer region. Enhanced Vegetation Index (EVI) data were
sourced from the MOD13Q1 dataset available on the GEE platform. The basic
parameters of remote sensing data are shown in Table 2. Land use data were
obtained from the Chinese 30-m annual land cover dataset (CLCD)[16],
and spatial distribution data of the digital elevation models were sourced from
Shuttle Radar Topography Mission (SRTM) data collected by the United States
Space Shuttle Endeavour.
Table 1 Metadata
summary of the Cotton field dataset based on multi-satellite images in the Aksu
and Alaer region (2020)
|
Items
|
Description
|
|
Dataset full
name
|
Cotton field
dataset based on multi-satellite images in Aksu and Alaer region (2020)
|
|
Dataset short
name
|
Aksu_Alaer_Cotton_2020
|
|
Authors
|
Zhang, P., Xinjiang Institute of Ecology and Geography, Chinese Academy of
Sciences, z1571824849@163.com
Fan, J. L., Xinjiang Institute of Ecology and Geography, Chinese Academy of
Sciences, fanjl@ms.xjb.ac.cn
Li, S. Y.,
Xinjiang Institute of Ecology and Geography, Chinese Academy of Sciences, oasis@mx.xjb.ac.cn
|
|
Geographical
region
|
Aksu-Alaer
region
|
|
Year
|
2020
|
|
Spatial
resolution
|
250 m
|
|
Data format
|
.tif, .shp
|
|
Data size
|
385 KB (Compress
into one file, 134 KB)
|
|
Data files
|
(1)
distribution of cotton fields, (2) Sample point data
|
|
Foundation
|
Ministry of
Science and Technology of P. R. China (2021xjkk0305)
|
|
Data computing
environment
|
GEE platform,
ArcGIS
|
|
Data publisher
|
Global Change
Research Data Publishing & Repository, http://www.geodoi.ac.cn
|
|
Address
|
No. 11A, Datun
Road, Chaoyang District, Beijing 100101, China
|
|
Data sharing policy
|
(1) Data
are openly available and can be free downloaded via the Internet; (2) End users are encouraged to
use Data
subject to citation; (3) Users, who are by definition
also value-added service providers, are welcome to redistribute Data subject to written permission from
the GCdataPR Editorial Office and the issuance of a Data
redistribution license; and (4) If Data are used to
compile new datasets, the ??ten per cent principal??
should be followed, such that Data records
utilized should not surpass 10% of the new
dataset contents, while sources should be clearly noted in suitable
places in the new dataset[15]
|
|
Communication and searchable systems
|
DOI, CSTR,
Crossref, DCI, CSCD, CNKI, SciEngine, WDS/ISC, GEOSS
|
Table
2 Data sources and basic parameters
|
Research data
|
Data timeframe
|
Image names in GEE
|
Temporal resolution
|
Spatial resolution
|
Orbit number
|
|
Landsat8
|
2020.3.1?C2020.10.31
|
USGS Landsat 8 Collection 2 Tier 1 TOA Reflectance
|
30 m
|
16 d
|
145032 145033 146031 146032 146033 147031 147032
|
|
Sentinel-2
|
2020.3.1?C2020.10.31
|
Sentinel-2 MSI: Multispectral Instrument, Level-2A
|
10 m
|
5 d
|
44SNJ 44TLK 44TLL 44SMJ 44TNK 44TML 44TMK 44TNL
44TMN 44TMM
|
|
MOD13Q1
|
2020.3.1?C2020.10.31
|
MOD13Q1.061 Terra Vegetation Indices 16-Day Global 250m
|
250 m
|
16 d
|
h23v04 h24v04 h23v05 h24v05
|
3.2 Research Methodology
Data
used in this study were obtained from the GEE platform. First, vector maps of
the cultivated land boundaries for each county in the Aksu-Alaer region were
utilised with the geographic coordinate system set to GCS_WGS_1984. Then, high
spatial resolution remote sensing imagery from Sentinel-2 and Landsat 8 during
the 2020 cotton-growing season was visually interpreted to obtain sample points
of cotton and non-cotton areas in each region. The acquired sample point data
for each county were archived in .shp files. This study employed RF as the
classifier owing to its efficiency in handling large training samples and
high-dimensional data, along with its strong fault-tolerance capability[17].
The RF model comprised multiple classification trees[18]. During the
training of the RF model, two-thirds of the total training samples were used to
construct each decision tree, and the remaining samples were used to validate
the classification results of each tree. During classification, each decision
tree in the RF produced a classification result, which was then combined using
a majority voting method to obtain the final RF classification result.
Sentinel-2 NDVI data and MOD13Q1 EVI data were used as feature values for RF
classification. An RF classifier was built to classify each county and to
determine the cotton planting distribution for each county. Additionally, the
connectedPixelCount method was applied to the GEE platform to eliminate the
influence of small patches. Finally, the spatial distribution of cotton in the
Aksu-Alaer region was obtained. A flowchart of the study process is shown in
Figure 1.
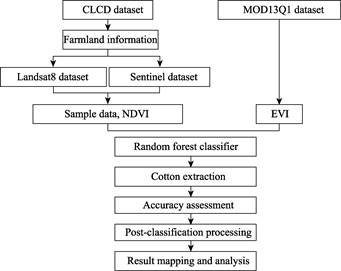
Figure
1 Aksu-Alaer region cotton distribution
dataset technical workflow diagram
4 Data Results
and Validation
4.1 Dataset Characteristics
The dataset comprises two data files: (1) the spatial distribution
of cotton in the Aksu-Alaer region (.tif), with a spatial resolution of 250 m
and a timeframe of 2020, and (2) sample point data for cotton and non-cotton
areas in the Aksu-Alaer region (.shp).
4.2 Data Analysis
Aksu prefecture, located in
the Xinjiang Uygur autonomous region of China, consists of two county-level
cities and seven counties: Aksu, Kuqa, Wensu, Xayar, Xinhe, Awat, Kalpin, Baicheng, and Wushi. Considering the research scope, Alaer city
was also included in the study. However, Wushi and Baicheng counties, where
cotton distribution is minimal, were not considered for cotton extraction in
this study. This research was based on the GEE platform, utilising visual interpretation
to select cotton sample points, as shown in Figure 2. A total of 1,706 cotton
sample points and 1,277 non-cotton sample points were selected, amounting to
2,893 total sample points. The Aksu-Alaer region was classified by county using
supervised classification, and the cotton distribution was obtained using the
random forest method. From the spatial distribution pattern of cotton in the
Aksu-Alaer region (Figure 3), cotton fields are concentrated in the central
area (mainly in Alaer city), the northern parts of Awat county, the southern
parts of Wensu county, the northern parts of Xayar county, and the southern
parts of Kuqa city. Furthermore, there were significant differences in the
proportion of cotton-grown area to arable land among the counties in the
Aksu-Alaer region, as shown in Table 3. Among them, Alaer city had the highest
proportion, at 67.33%, followed by Xayar county, with a cotton-to-arable-land
ratio of 64.63%. Kuqa city and Awat county also had high proportions of 58.82%
and 52.41%, respectively.
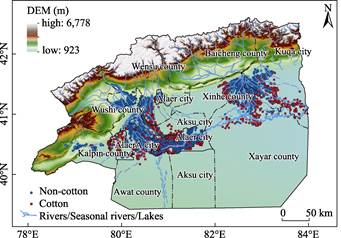
Figure 2 The distribution
map of sample points of cotton and non-cotton in the Aksu-Alaer region
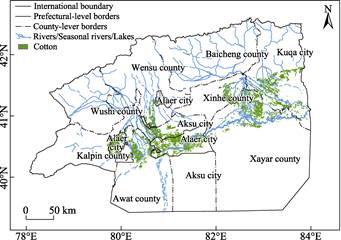
Figure 3 The spatial distribution map of cotton
in the Aksu-Alaer region of Xinjiang
Table 3 Cotton area percentages in the Aksu-Alaer
region
|
Location
|
Arable land area (103
ha)
|
Cotton area (103
ha)
|
Percentage (%)
|
|
Aksu city
|
156
|
74
|
47.44
|
|
Kuqa city
|
238
|
140
|
58.82
|
|
Awat county
|
166
|
87
|
52.41
|
|
Kalpin county
|
16
|
2
|
12.50
|
|
Xayar county
|
229
|
148
|
64.63
|
|
Wensu county
|
180
|
37
|
20.56
|
|
Xinhe county
|
114
|
47
|
41.23
|
|
Alaer city
|
303
|
204
|
67.33
|
4.3 Data
Validation
The
study also assessed the accuracy of the extraction results for each county by
validating the dataset using the overall classification accuracy, Kappa
coefficient, producer's accuracy, and user??s accuracy, as detailed in Table 4.
The validation results for each county indicated that the overall
classification accuracy was above 0.9 and the Kappa coefficient was above 0.8 for all counties. Among them, Wensu county has the
highest accuracy, with an overall classification accuracy of 0.99 and a Kappa
accuracy of 0.97, while Kalpin county has the lowest accuracy, with an overall classification accuracy
of 0.94 and a Kappa accuracy of 0.83.
Table
4 Accuracy validation results by county in
the Aksu-Alaer region
|
Place names
(2020)
|
Overall classification accuracy
|
Kappa coefficient
|
User??s accuracy
|
Producer??s accuracy
|
|
Aksu city
|
0.97
|
0.94
|
[0.94, 1]
|
[1], [0.94]
|
|
Kuqa city
|
0.98
|
0.95
|
[0.98, 0.97]
|
[0.98], [0.97]
|
|
Awat county
|
0.93
|
0.86
|
[0.92, 0.94]
|
[0.92], [0.94]
|
|
Kalpin county
|
0.94
|
0.83
|
[0.88, 0.95]
|
[0.88], [0.95]
|
|
Xayar county
|
0.93
|
0.85
|
[0.88, 1]
|
[1], [0.85]
|
|
Wensu county
|
0.99
|
0.97
|
[0.95, 1]
|
[1], [0.99]
|
|
Xinhe county
|
0.97
|
0.93
|
[0.92, 1]
|
[1], [0.95]
|
|
Alaer city
|
0.95
|
0.87
|
[0.95, 0.93]
|
[0.97], [0.88]
|
5 Discussion and Conclusions
This
study constructed a dataset based on in-depth analysis of cotton distribution
in the Aksu-Alaer region using the GEE platform. Specifically, by visually
interpreting high-resolution remote sensing images from Sentinel-2 and Landsat
8 data, a total of 2,893 cotton and non-cotton sample points were obtained.
Supervised classification using the RF method was then used to generate cotton
distribution maps for each county in the region. Finally, a spatial
distribution dataset of cotton in the Aksu-Alaer region in 2020 was
constructed. The results revealed that cotton fields in the Aksu-Alaer region
are centrally-concentrated, primarily distributed in the northern parts of
Alaer city and Awat county, the southern parts of Wensu county, the northern
part of Xayar county, and the southern part of Kuqa city. In recent years,
research on cotton in the Aksu-Alaer region has mostly treated Alaer city and
the Aksu area as a whole[19], focusing solely on Alaer city[12]
for cotton extraction, or has carried out detailed cotton extraction for only
specific regions[20]. Therefore, this study extracted cotton by
county in the Aksu-Alaer region, and through validation, demonstrated accurate
classification for each county, reflected by the overall classification
accuracy and Kappa coefficient both exceeding 0.8 in all counties. The research
results provide important spatial information for agricultural planning and
resource management in the Aksu-Alaer region. In future cotton extraction
efforts, improving spatial resolution can achieve greater precision and
accuracy.
Author Contributions
Fan, J. L., Ding, G., and Li,
S. Y. designed algorithms for the dataset. Zhang, P. contributed to data
processing and wrote the paper.
Conflicts of
Interest
The
authors declare no conflicts of interest.
References
[1]
Yu, S. X., Zhang, L., Feng, W.
J. Study on strategy of large scale, mechanization, informationization,
intelligence and social services for cotton production [J]. Engineering Science, 2016, 18: 137?C148.
[2]
National Bureau of Statistics.
China Statistical Yearbook [M]. Beijing:
China Statistics Press, 2021: 4-5.
[3]
Statistics Bureau of XPCC and
NBS Survey Office in XPCC. Xinjiang Production & Construction Corps
Statistical Yearbook [M]. Beijing:
China Statistics Press, 2021: 5.
[4]
Hao, P. Y., Wang, L., Zhan, Y.
L., et al. Using moderate-resolution temporal NDVI profiles for
high-resolution crop mapping in years of absent ground reference data: a case
study of bole and Manas counties in Xinjiang, China [J]. ISPRS International Journal of Geo-Information, 2016, 5: 23. DOI: 10.3390/ijgi5050067.
[5]
Hassan-Esfahani, L.,
Torres-Rua, A., Jensen, A., et al. Assessment of surface soil moisture
using high-resolution multi-spectral imagery and artificial neural networks
[J]. Remote Sensing, 2015, 7: 2627?C2646. DOI: 10.3390/rs70302627.
[6]
Berhane, T. M., Lane, C. R.,
Wu, Q. S., et al. Decision-tree, rule-based, and random forest
classification of high-resolution multispectral imagery for wetland mapping and
inventory [J]. Remote Sensing, 2018, 10: 26. DOI: 10.3390/rs10040580.
[7]
Hubert-Moy, L., Thibault, J.,
Fabre, E., et al. Mapping grassland frequency using decadal MODIS 250 m time-series:
towards a national inventory of semi-natural grasslands [J]. Remote Sensing,
2019, 11: 21. DOI: 10.3390/rs11243041.
[8]
Xiong, J., Thenkabail, P. S.,
Tilton, J. C., et al. Nominal 30-m cropland extent map of continental
Africa by Integrating pixel-based and object-based algorithms using Sentinel-2
and Landsat-8 data on Google Earth Engine [J]. Remote Sensing. 2017, 9:
27. DOI: 10.3390/rs9101065.
[9]
Rodriguez-Galiano, V. F.,
Ghimire, B., Rogan, J., et al. An assessment of the effectiveness of a
random forest classifier for land-cover classification [J]. ISPRS Journal
of Photogrammetry and Remote Sensing, 2012, 67: 93?C104.
DOI: 10.1016/j.isprsjprs.2011.11.002.
[10]
Rodriguez-Galiano, V. F.,
Chica-Olmo, M., Abarca-Hernandez, F., et al. Random forest classification
of Mediterranean land cover using multi-seasonal imagery and multi-seasonal
texture [J]. Remote Sensing of
Environment, 2012, 121: 93?C107. DOI: 10.1016/j.rse.2011.12.003.
[11]
Zhou, L., Lin, Z. S., Wang, L.
H., et al. Dynamic monitoring of cotton planting area under PIE platform
[J]. Spacecraft Recovery &
Remote Sensing, 2023, 44(3): 108?C118.
[12]
Lv, S. L., Zhao, Y., Chen, W.
J., et al. Extraction of cotton planting area in Alaer based on remote
sensing cloud computing [J]. Cotton
Sciences, 2022, 44: 19?C25.
[13]
Wang, H. H., Zhang, Z., Kang,
X. Y., et al. Cotton planting area extraction and yield prediction based on
Sentinel-2A [J]. Transactions of
the Chinese Society of Agricultural Engineering, 2022, 38(9): 205?C214.
[14]
Zhang, P., Fan, J. L., Li, S.
Y. Cotton field dataset based on multi-satellite images in Aksu and Alaer
region (2020) [J/DB/OL]. Digital Journal
of Global Change Data Repository, 2024. https://doi.org/10.3974/geodb.2024.02.10.V1.
https://cstr.escience.org.cn/CSTR:20146.11.2024.02.10.V1.
[15]
GCdataPR Editorial Office.
GCdataPR data sharing policy [OL]. https://doi.org/10.3974/dp.policy.2014.05
(Updated 2017).
[16]
Yang, J., Huang, X. The 30 m
annual land cover dataset and its dynamics in China from 1990 to 2019 [J]. Earth System Science Data, 2021, 13: 3907?C3925. DOI: 10.5194/essd-13-3907-2021.
[17]
Immitzer, M., Vuolo, F.,
Atzberger, C. First experience with Sentinel-2 data for crop and tree species
classifications in Central Europe [J]. Remote Sensing, 2016, 8: 27. DOI: 10.3390/rs8030166.
[18]
Breiman, L. Random forests [J].
Machine Learning, 2001,
4: 5?C32. DOI: 10.1023/a:1010933404324.
[19]
Liu, C. J., Jin, X. B., Xu, W.
Y., et al. Analysis of the spatial distribution and variation
characteristics of cotton planting in southern Xinjiang from 2000 to 2020 [J]. Transactions
of the Chinese Society of Agricultural Engineering, 2021, 37(16): 223?C232.
[20]
Zhang, N. N., Zhang,
X., Bai, T. C., et al. Field scale cotton land feature recognition based
on UAV visible light images in Xinjiang [J]. Transactions of the Chinese Society for Agricultural Machinery, 2023, 54: 199?C205.