Hydrologic CTD Dataset Obtained through
Chinese Antarctic Expeditions
Lin, L. N.1 Wang, Y. J.1 Zhang, J.2 Liu, N.1* Chen, H. X.1 Kong, B.1,3 He, Y.1
1. The First Institute of Oceanography, State Oceanic Administration, P. R. China, Qingdao 266061, China;
2. Polar Research Institute of China, Shanghai 200136, China;
3. School of Ocean and Earth Science, Tongji University, Shanghai 200092, China
Abstract: China has carried out the Antarctic scientific expedition for over 30 years (1984-2014). by 2014, China has completed 30 expeditions to the Antarctic region. The main activities had cover the areas including Antarctic Peninsula, Prydz Bay and the seas nearby. On the basis of the hydrological CTD survey data obtained during each Antarctic voyage, in combination with the field observation records on each voyage, this paper unifies the format of the data obtained from different surveying equipment and data collecting and processing tools. The dataset is consisted of pressure, depth, temperature, salinity, density, sound velocity and potential temperature. It facilitates the Antarctic-related studies.
Keywords: Antarctic; CHINARE; hydrologic; CTD
1 Introduction
Chinese scientific expeditions to the Antarctic have lasted for over 30 years, during which CTD survey has been a basic method applied in the surveys on the comprehensive hydrographic ocean environment due to its reliability and stability. CTD survey has been made during each of the hydrologic survey-based voyages excluding the 2nd, 4th, 5th, 10th, 12th, 17th, 20th and 23th expeditions because of the surveying equipment not available[1].
During the over 30 years of scientific expeditions, the ocean survey technologies have been rapidly developed. The research equipment updated and the members of the polar expedition changed. Before the ship Xue Long was equipped with the SBE 911 CTD in 1984, the equipment used for hydrologic survey was different, such as equipment on board and those provided by the supporting companies. Due to the differences in data sampling equipment, data processing personnel and data archiving management, there were large di-
fferences between the data formats both in vertical resolution and data items, which caused the data so difficulties to be effectively used by researchers.
The paper described how the hydrologic CTD data obtained by the China Antarctic voyage and whether the data is based on original records or has been processed afterwards. Based on this, in combination with the field records on each voyage or the oral description of voyagers, the data was kept a record every 1 m as required for data processing by equipment. To avoid any disturbance generated in the process of sampling water, due to the late response in the course of lifting pressure sensor, original records kept in the process of lowering are used to process data as necessary. In consideration of the overall deviation, incomplete or incorrect original data records arising out of instruments or the lack of complete records on each level, original records are reflected as complete and authentic as possible.
As the primary basis of researching the physical ocean environment of the Antarctic, the CTD data obtained through the scientific expeditions is considered important and basic to understand the hydrologic properties and circulation feature of the seas and developed on the basis of those collected in the process of each expedition to the Antarctic, including the pressure, depth, temperature, salinity, density, sound velocity and potential temperature[2].
2 Metadata of Dataset
The descriptions of the “CTD Dataset from CHINARE (1985-2014)” [2] are recorded. These information include the dataset full name, dataset short name, authors, geographical regions of the dataset content, year of the dataset, spatial and temporal resolution, data publisher, data access and services platform. Table 1 below summarizes the main metadata of the dataset.
Table 1 Summary of the metadata
|
Items
|
Descriptions
|
|
Dataset full name
|
CTD Dataset from CHINARE (1985-2014)
|
|
Dataset short name
|
CTD_data_CHINARE_1985-2014
|
|
Authors
|
Lin, L. N. L-6637-2016, the First Institute of Oceanography (SOA), linln@fio.org.cn
Wang, Y. J. A-3180-2017, the First Institute of Oceanography (SOA), wangyj@fio.org.cn
Zhang, J. L-4784-2016, Polar Research Institute of China, zhangjie@pric.org.cn
Liu, N. L-6646-2016, the First Institute of Oceanography (SOA), liun@fio.org.cn
Chen, H. X. A-4871-2017, the First Institute of Oceanography (SOA), chenhx@fio.org.cn
Kong, B. A-3202-2017, Tongji University, kongbin@fio.org.cn
He, Y. A-3216-2017, the First Institute of Oceanography (SOA), heyan@fio.org.cn
|
|
Geographical region
|
50°S-69°S, 70°W-110°E, mainly the Antarctic Peninsula, the Prydz Bay and the seas nearby
|
|
Year
|
1984, 1986, 1989, 1990, 1991, 1992, 1994, 1996, 1997, 1998, 1999, 2001, 2002, 2004, 2005, 2007, 2008, 2009, 2010, 2011, 2012, 2013, 2014
|
|
Spatial resolution
|
1 m in vertical
|
|
Data format
|
.dat
|
Data Size
|
90 MB
|
|
Foundation(s)
|
Ministry of Science and Technology of P. R. China (2014T02, 2014G02, 2011AA090401); State Oceanic Administration of P. R. China (201405031, 20150102)
|
|
Data publisher
|
Global Change Research Data Publishing & Repository, http://www.geodoi.ac.cn
|
|
Address
|
No. 11A, Datun Road, Chaoyang District, Beijing 100101, China
|
|
Data sharing policy
|
Data from the Global Change Research Data Publishing & Repository includes metadata, datasets (data products), and publications (in this case, in the Journal of Global Change Data & Discovery). Data sharing policy includes: (1) Data are openly available and can be free downloaded via the Internet; (2) End users are encouraged to use Data subject to citation; (3) Users, who are by definition also value-added service providers, are welcome to redistribute Data subject to written permission from the GCdataPR Editorial Office and the issuance of a Data redistribution license; and (4) If Data are used to compile new datasets, the ‘ten per cent principal’ should be followed such that Data records utilized should not surpass 10% of the new dataset contents, while sources should be clearly noted in suitable places in the new dataset[3]
|
3 Coverage and Components of the Dataset
3.1 Antarctic Geographical Range Covered
The hydrologic CTD dataset of the Antarctic expeditions is associated with the areas of 50°00′S-69°00′S and 70°00′W-110°00′E shown in Figure 1, which mainly include the An-
tarctic Peninsula, the Prydz Bay and the seas nearby. To facilitate data development and downloading, the hydrologic features of each station are included in a data file.

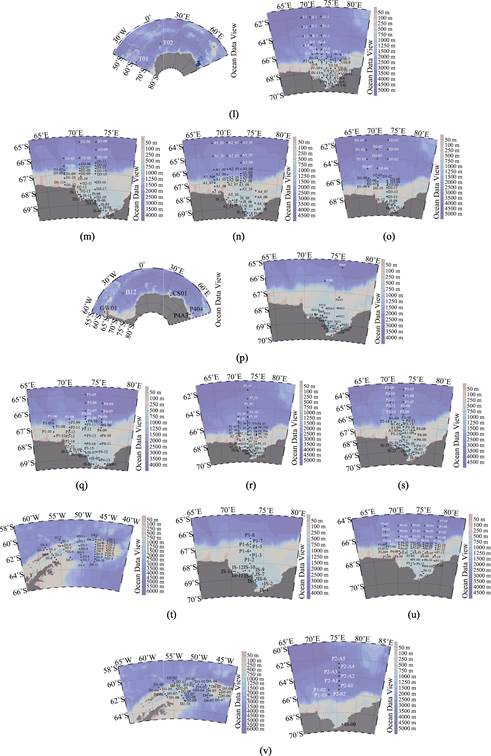
Figure 1 CTD stations of Chinese Antarctic expeditions (a) 1st; (b) 3rd; (c) 6th; (d) 7th; (e) 8th; (f) 9th;
(g) 11th; (h) 13th; (i) 14th; (j) 15th; (k) 16th; (l) 18th; (m) 19th; (n) 21th; (o) 22th; (p) 24th; (q) 25th;
(r) 26th; (s) 27th; (t) 28th; (u) 29th; (v) 30th
3.2 Components
The hydrologic CTD dataset of the Antarctic seas consists of 912 data files (.dat), each of which covers pressure (db), depth (m), temperature (°C), salinity (psu), density (kg/m3), sound velocity (m/s) and potential temperature (°C). Each dataset is named after the measurement station name. For example, IS-01.dat covers the hydrologic CTD data of IS-01 station.
Table 2 CTD Data Statistics of Chinese Antarctic expeditions
|
Cruise No.
|
No. of data files
|
CTD type
|
Main geographical region
|
Remarks
|
|
1
|
34
|
MarkIII
|
seas near the Antarctic Peninsula
|
standard layer data
|
|
3
|
28
|
unlabeled
|
the Antarctic Peninsula and the seas nearby
|
standard layer data
|
|
6
|
19
|
unlabeled
|
the Prydz Bay and its external
|
standard layer data
|
|
7
|
37
|
unlabeled
|
the Prydz Bay and its eastern waters
|
standard layer data
|
|
8
|
32
|
unlabeled
|
the Prydz Bay and its eastern waters
|
standard layer data
|
|
9
|
38
|
unlabeled
|
the Prydz Bay and its external, the Antarctic Peninsula and the
seas nearby
|
standard layer data
|
|
11
|
7
|
MarkIII
|
the Prydz Bay and its external
|
standard layer data
|
|
13
|
24
|
MarkIII
|
the Prydz Bay and its external
|
2 m interval
|
|
14
|
15
|
unlabeled
|
inside the Prydz Bay
|
1 m interval
|
|
15
|
21
|
unlabeled
|
the Prydz Bay and its external
|
1 m interval
|
|
16
|
19
|
MarkIII
|
the Prydz Bay and its external
|
1 m interval
|
|
18
|
68
|
MarkIII
|
the Prydz Bay and its external
|
1 m interval
|
|
19
|
44
|
MarkIII/SBE 25
|
the Prydz Bay and its external, sections fore the ice shelf edge
|
1 m interval
|
|
21
|
94
|
MarkIII
|
the Prydz Bay and its external, the route between Zhongshan
Station and the Great Wall Station
|
1 m interval
|
|
22
|
48
|
MarkIII
|
the Prydz Bay and its external, ACC south of Australia
|
1 m interval
|
|
24
|
50
|
ALEC/SBE 25
|
the Prydz Bay and its external, routes among stations
|
1 m interval
|
|
25
|
47
|
SBE 911
|
the Prydz Bay and its external
|
1 m interval
|
|
26
|
52
|
SBE 911
|
the Prydz Bay and its external
|
1 m interval
|
|
27
|
62
|
SBE 911
|
the Prydz Bay and its external, sections fore the ice shelf edge
|
1 m interval
|
|
28
|
67
|
SBE 911
|
the Prydz Bay and its external, sections fore the ice shelf edge,
seas near the Antarctic Peninsula
|
1 m interval
|
|
29
|
66
|
SBE 911
|
the Prydz Bay
|
1 m interval
|
|
30
|
40
|
SBE 911
|
the Antarctic Peninsula, the Prydz Bay
|
1 m interval
|
4 Data Processing and Quality Control
Before the Chinese 24th Antarctic scientific expedition, there were various types of CTD unit, resulting in differences in data format, vertical resolution, and elements contained. After the 25th expedition to the Antarctic when the ship Xue Long was equipped with SBE 911 CTD, the polar hydrologic survey became more standard. Accordingly, data should be processed as indicated in the following.
4.1 CTD Data Processing of the Chinese 1st to 24th Antarctic Scientific Expedition
It is difficult to obtain original data to reprocess due to the long time spent in data acquisition, different field survey and data processing personnel for each voyage and failure to understand the current situations on the site. On the basis of the voyage collection data, such data is mainly processed in terms of the following:
(1) Format unification
It is inconvenient to check and process the original data stored under the files of .xls, .txt, .cnv and .dat, so an adjustment is made to store the data of each station under the files of .dat. Furthermore, the information of each station is extracted to form a voyage station information table containing such basic information as station name, time, longitude, latitude, depth of water and maximum depth of observation.
Particularly, if a data file contains both the data obtained in the process of lowering and lifting, the former is preferred; if the data obtained in the process of lowering has a large error or only those obtained in the process of lifting is available, the latter is preferred.
(2) Content unification
a. Unify each of the oceanographic parameters including depth, pressure, temperature, salinity, density, sound velocity and potential temperature and include them in each data file. Any missing parameter should be calculated with the SBE 911 data processing method. Density is converted into conditional density, that is, the density of seawater under a standard barometric pressure. In such case, only a function containing temperature and salinity is required to be solved based on the 1980 International Equation of Seawater State (EOS80). Sound velocity is calculated with the Chen-Millero[4] algorithm for the reason that research shows that this algorithm is most advantageous and accurate within the range of 200-800 m among the three algorithms of sound velocity (Wilson, Del Grosso and Chen-Millero algorithms)[5].
b. Unify data interval. The data obtained before the 13th expedition is mainly associated with the standard levels, between which the interval was 2 m or 5 m within 100 m and 100 m within the range over 100 m but below 200 m, making it difficult to insert values at such a large interval and thus failing to process such data; as to the data between which the interval became 1 m or 0.1 m after the 14th expedition or those which has not processed under 24 Hz, each of the interval of less than 1 m is changed into 1 m.
(3) Data quality control
Unless quality control measures are taken, no high-quality data will be obtained regardless of the quality and measurement accuracy of the CTD used[6]. After data-related unification, the data quality should be controlled initially. First, check the on-site observation records on each voyage, understand the calibration and maintenance before observation, on-site ratio measurement and the environmental condition under which real-time observation is made and review whether any error occurs by accident for the purpose of having an initial understanding of the data quality. For example, through check of the report on the 19th voyage, such problems as the MarkIII-CTD fault, poor data quality and binding the SBE 25-CTD and MarkIII-CTD to lower together in some stations were discovered. Therefore, importance must be paid to the processing of the data of SBE 25-CTD.
Second, draw a CTD profile map for each station and amend it manually. Directly delete the false values determined through analyses if there is obvious deviation from 1-3 values measured or the density changes in a unreasonable manner in case of any obvious abnormal value. As shown in Figure 2, the negative salinity of a point at the depth of around 1,800 m is considered typically abnormal and could be deleted through programming or manually. Those unidentified should be reserved as some abnormal values may truly reflect the abnormal changes of ocean environment parameters.
4.2 CTD Data Processing of the Chinese 25th to 30th Antarctic Scientific Expedition
From the 25th expedition to the Antarctic, CTD observation was made with the SBE 911 system with which the ship Xue Long is equipped. This is a highly accurate system of measuring temperature, salinity and depth, with a dual-temperature and dual-conductor probe. Despite high frequency of sampling with the SBE 911 system, the data obtained has a high quality. However, under the impact of the instrument and site conditions, it is difficult to ensure the data obtained is fully accurate[7]. Therefore, it is necessary to process the data collected by the system. The SBE data processing software of the system could be used for initial processing of the data. In particular, the software cannot delete the data obtained before the pump startup, so programming is required to delete such data before processing according to the following steps:
|
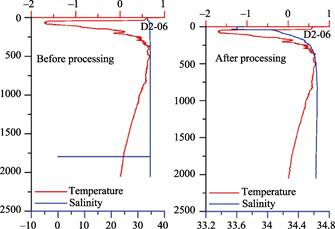
Figure 2 Eliminating outliers sample (left: before processing;
right: after processing)
|
(1) Data Conversion: Convert the data of original binary or hexadecimal data files to turn them into project files (.cnv) available for further processing. Use the correct standard files to check the compliance of the parameters of each sensor. Furthermore, ensure the observation mode selected from the menu is correct. Just convert the variables directly measured including pressure, temperature and conductivity, other than the data calculated based on pressure, temperature (ITS-90) and conductivity (s/m), such as salinity and density.
(2) Delete the data obtained before pump startup through programming. In addition, delete the data obtained in the course from lowering of CTD for a distance of around 5 m until pump startup to lifting.
(3) Filter: A filter is designed to match the time constant of temperature and salinity, and smooth pressure signals for deleting knotted data resulting from the shaking ship. As indicated in the CTD file, conductivity = 0.03 s, pressure = 0.15 s;
(4) Align CTD: Adjust the difference between the temperature and salinity sensors and the pressure sensor in time to obtain accurate data. With the SBE911plus unit, the above works could be done by the CTD deck unit at the time of real-time transmission of data.
(5) Cell Thermal Mass: the conductivity is required to be amended since the measured and calculated value will be affected in the process of heat conduction between the conductive unit and the surroundings. As a conductive cell is made of plastics and glasses which may store energy, the water flowing through the conductive cell will be heated when the hot water in an electrode cell become cold; otherwise, the water flowing through will be cooled. For the heat conversion, the module could be used to amend the conductivity. Accordingly, primary and secondary all with alpha=0.03, 1/beta=7.0.
(6) Loop Edit: The main function is to delete the false data resulting from the up-and-down motion of ship, during which the speed of lowering the instruments will change. The reduction in the lowering speed will make the sensor repeatedly sample water at the same layer and thus result in inaccurate data. Since such false data cannot be amended, it has to be deleted.
(7) Bin Average: As required for scientific research, original data is averaged in terms of time or depth.
(8) Derive: Calculate the salinity, density, potential temperature and density based on the measured P, T and C. In most cases, the parameters like depth, temperature, salinity, density and sound velocity are finally output through pre-processing of original data. In the process, the required parameters could be calculated based on such basic parameters[8].
(9) Split: Separate the data obtained in the course of lifting and lowering respectively.
(10) Strip: Extract the parameters required. (Optional)
(11) AscII Out: Delete header information. (Optional)
(12) Sea plot and amend: Draft a map and amend it manually. Directly delete the false values determined through analyses if there is obvious deviation from 1-3 values measured or the density changes in a unreasonable manner in case of any obvious abnormal value.
In recent years, the SBE 911 CTD unit has been used for the Antarctic expeditions, ensuring the quality and accuracy of the original data collected; through the above standard processing, the data maintains a high quality, with a uniform and definite format. The application of the CTD data processed in each subject will gain a good effect[9].
5 Conclusion
On the basis of the CTD survey data obtained through Chinese Antarctic scientific expeditions, the CTD dataset forms with uniform format, resolution and hydrologic features and collects the hydrologic survey results of the expeditions. As the basis of hydrological research of the Antarctic and a main achievement of China’s expeditions to the polar regions, it provides an important reference for model simulation and other subjects and facilitates the understanding of the Antarctic ocean environment.
Author Contributions
Liu, N. designed the study. Lin, L.N., Wang, Y.J., Zhang, J. wrote the paper. Chen, H. X., Kong, B., He, Y. contributed to the data processing and analysis.
References
[1] Chen, H. X., Liu, N., Zhang J., et al. China Polar Scientific Expedition Hydrological Data Atlas Introduction [M]. Beijing: Ocean Press, 2014.
[2] Lin, L. N., Wang, Y. J., Zhang, J., et al. CTD Dataset from CHINARE (1985-2014) [DB/OL]. Global Change Research Data Publishing & Repository, 2016. DOI: 10.3974/geodb.2016.01.13.V1.
[3] GCdataPR Editorial Office. GCdataPR Data Sharing Policy [OL]. DOI:10.3974/dp.policy.2014.05 (Updated 2017).
[4] Chen, C. T., Millero, F. J. Speed of sound in sea water at high pressures [J]. Journal of the Acoustical Society of America, 1977, 62(5): 1129-1135.
[5] Chen, H. X., Lv, L. G., Hua, F., et al. Comparison between three commonly used algorithms of sound speed [J]. Advances in Marine Science, 2005, 23(003): 359-362.
[6] Chen, M., Li, Z. Q., Yuan, Y. M., et al. Analysis of processing of CTD data of seabird series [J]. Hydrographic Surveying and Charting, 2004, 24(6): 62-64.
[7] Yang, S. L., Xie, L. L., Yang, Q. X. Field calibration and data-processing of SBE 911 plus CTD profiler [J]. Ocean Technology, 2008, 27(3): 23-26.
[8] Xu, J. P., Su, J. L. Simple analysis of the qualitative control for CTD data [J]. Acta Oceanologica Sinica, 1999, 21(1): 126-132.
[9] Kuang, X. D., Guo, X. S., Fan, H. T. Pre-processing and standardization discussion of CTD data [J]. Ocean Technology, 2009, 28(2): 33-36.