Development of the Heat Wave Dataset for the Belt and Road
Region (1989?C2018)
Yin, C.1,2 Yang, F.1,3*
1. Institute of Geographic Sciences and Natural Resources
Research, Chinese Academy of Sciences, Beijing 100101, China;
2. College of resources and environment, University of
Chinese Academy of Sciences, Beijing 100049, China;
3. Jiangsu Center for
Collaborative Innovation in Geographical Information Resource Development and
Application, Nanjing 210023, China
Abstract: Heat waves seriously affect the productivity
and daily life of human beings. Therefore, they bring great risks and
uncertainties for the future development of countries in the Belt and Road
region. Accurate and reliable data are an important basis for future research
on the spatiotemporal distribution of heat waves and disaster risk in this
region. In this study, we use daily monitoring data from 2,833 NOAA
meteorological stations as source data and integrated air temperature, humidity
and wind speed to calculate apparent temperature based on Humidex. The
elevation-correction interpolation method is used to produce the gridded daily
apparent temperature dataset from 1989 to 2018. Based on apparent temperature
data, we produced an annual heat wave dataset from 1989 to 2018 using the
combination of the absolute temperature threshold and relative temperature
threshold. The spatial resolution of this dataset is 0.1?? in .tif format, with
a total size of 233 GB and 99,927 pieces. The dataset consists of two parts: a
daily apparent temperature dataset and an annual heat wave dataset. The daily
apparent temperature dataset includes three subdatasets: daily mean, minimum
and maximum apparent temperature. Each file is named with the corresponding
8-digit date. The annual heat wave dataset includes 5 subdatasets, including
two subdatasets based on the combination of climatological relative temperature
threshold (CRTT) and absolute temperature threshold (ATT), two subdatasets
based on the combination of annual relative temperature threshold (ARTT) and
ATT, and one subdataset based on ATT. Each subdataset includes ten attributes,
such as the frequency, duration, and intensity of heat waves.
Keywords: heat wave; apparent
temperature; the Belt and Road Region; 1989?C2018
DOI: https://doi.org/10.3974/geodp.2021.02.02
CSTR:
https://cstr.escience.org.cn/CSTR:20146.14.2021.02.02
Dataset Availability Statement:
The dataset supporting this paper was published and
is accessible through
the Digital Journal of Global Change Data
Repository at: https://doi.org/10.3974/geodb.2020.09.08.V1 or https://cstr.escience.org.cn/CSTR:20146.11.2020.09.08.V1.
1 Introduction
In recent years,
the frequency of heat wave events around the world has shown an increasing
trend, causing serious casualties and property losses. In 2003, a severe heat
wave occurred in Western Europe, and the temperature reached the highest level
since 1500[1], resulting in approximately
70,000 deaths[2] and a decrease of more than
23 million tons in grain production compared with the same period in the
previous year[3]. In 2010, a heat wave in Russia claimed
approximately 54,000 lives[4,5]. In 2009, a heat wave in
southeastern Australia killed 374 people and triggered devastating forest
fires. In 2015, India was hit by an intense heat wave, resulting in more than 2,500
deaths across the country. Heat waves refer to high-temperature weather that
lasts for several days. Global warming will continue to enhance the frequency,
duration and intensity of heat waves[8]. Coupled climate model
results show that in the second half of the 21st century, heat waves
will become more frequent, longer lasting and more intense[9,10].
The Belt and Road Region covers 3 continents
and more than 66 countries and regions, and approximately 4.4 billion people[11],
who are seriously affected by meteorological disasters. From 1995 to 2015,
among the 10 countries most severely affected by meteorological disasters in
the world, countries in the Belt and Road Region accounted for 7[12].
In addition, numerous countries along the Belt and Road are developing
countries with limited ability to withstand natural disasters, and it is one of
the regions with the most frequent and severe losses from natural disasters in
the world[13]. Heat wave disasters have brought great risks and
uncertainties to the advancement of the Belt and Road Initiative. Further study
of the spatiotemporal distribution of heat waves in the region can provide
information and decision-making support for the government, residents,
enterprises, and tourists and can play a guiding role in the government??s
disaster prevention and mitigation and development planning, residents?? lives,
enterprise investment and tourist travel planning. In this study, based on
meteorological observation data, we produced daily apparent temperature and annual
heat wave datasets.
2 Metadata of
the Dataset
The metadata of the
Heat
wave dataset for the Belt and Road Region (1989?C2018)
is summarized in Table 1. It includes the dataset full name, short name,
authors, year of the dataset, temporal resolution, spatial resolution, data
format, data size, data files, data publisher, and data sharing policy, etc.
3 Data
Development Method
In this study,
meteorological observation data are used as the source data to calculate
apparent temperature by integrating air temperature, humidity, and wind speed.
The interpolation method based on elevation correction is used to produce the
daily apparent temperature dataset. Then, the combined threshold method is used
to produce the annual heat wave dataset.
3.1 Algorithm Principle
3.1.1 Elevation-correction Interpolation Method
In this study, we
use the monitoring data of 2,833 NOAA meteorological stations as the source
data. Because of the discrete distribution of meteorological stations in
the study area, interpolation is needed. In addition, due to the large study
area, the vertical variation in temperature must be considered; therefore, we
adopt the interpolation method based on elevation correction[16?C19].
Table 1 Metadata summary
of the Heat wave dataset for the Belt and Road Region (1989?C2018)
|
Item
|
Description
|
|
Dataset full name
|
Heat wave dataset for the Belt and Road Region (1989‒2018)
|
|
Dataset short name
|
HeatWave_Belt&Road_1989-2018
|
|
Authors
|
Yin, C. ABA-9865-2020, Institute of Geographic Sciences and
Natural Resources Research??Chinese Academy of Sciences, yinc.18s@igsnrr.ac.cn
Yang, F., Institute of Geographic Sciences and Natural
Resources Research??Chinese Academy of Sciences, yangfei@igsnrr.ac.cn
|
|
Geographical
region
|
the Belt and Road Region
Year 1989?C2018
|
|
Temporal
resolution
|
Year Spatial
resolution 0.1??
|
|
Data format
|
.tif
|
Data size 233 GB
|
|
Data files
|
Daily apparent temperature dataset and annual heat wave
dataset (frequency, duration and intensity)
|
|
Foundation
|
The Construction Project of China Knowledge Center for
Engineering Sciences and
Technology (CKCEST-2020-2-4); Chinese Academy of Sciences
(XDA20030302)
|
|
Computing environment
|
Python
|
|
Data
publisher
|
Global Change Research Data Publishing & Repository,
http://www.geodoi.ac.cn
|
|
Address
|
No.
11A, Datun Road, Chaoyang District, Beijing 100101, China
|
|
Data sharing policy
|
Data from
the Global Change Research Data Publishing & Repository includes metadata, datasets
(in the Digital Journal of Global Change Data Repository), and
publications (in the Journal of Global Change Data & Discovery). Data sharing policy
includes: (1) Data are openly available and can be free downloaded via the
Internet; (2) End users are encouraged to use Data subject to
citation; (3) Users, who are by definition also value-added service
providers, are welcome to redistribute Data subject to written permission
from the GCdataPR Editorial Office and the issuance of a Data redistribution
license; and (4) If Data are used to compile new
datasets, the ??ten per cent principal?? should be followed such that Data
records utilized should not surpass 10% of the new dataset contents, while
sources should be clearly noted in suitable places in the new dataset[15]
|
|
Communication and searchable system
|
DOI, CSTR, Crossref, DCI, CSCD,
CNKI, SciEngine, WDS/ISC, GEOSS
|
According to this method, the temperature
decreases linearly with increasing altitude (0.006,5 ??C/m). The method consists of three steps.
First, the observed temperature is transformed to temperature at zero altitude,
that is, 0.006,5 ??C/m on
the basis of the observed temperature plus the temperature decrease due to
above zero altitude. Second, the kriging method is used for interpolation based
on the corrected temperature. Finally, the interpolated temperature is
corrected to the real altitude, that is, on the basis of the interpolated
temperature, 0.006,5 ??C /m
minus the temperature decrease due to elevation above zero.
3.1.2 Apparent Temperature
The adverse effects of heat waves on human health have been widely
studied and reported[20?C22]. The human body??s
perception of cold and heat to the external environment is comprehensively
affected by air temperature, wind speed, humidity, solar radiation and other
factors[23,24]. Based on the availability of data and calculation
methods, we focus on air temperature, humidity, and wind speed. Obviously,
apparent temperature can more accurately reflect the human body??s cold and hot
feelings than air temperature. The Humidex index is simple to calculate and
highly interpretable[25]. It has been increasingly and widely used
in the evaluation of human comfort[23,26]. The index considers air
temperature and dew point temperature and is calculated as follows:
 (1)
(1)
where AT
is the apparent temperature (??C), Ta
is the air temperature (??C),
and Td is the dew point temperature (??C).
3.1.3
Combined Heat Wave Threshold
Different regions have different standards
for defining heat waves[27?C29]. For example, the World
Meteorological Organization (WMO) defines the weather process in which the
daily maximum temperature exceeds 32 ??C and lasts for more than 3 days as a heat wave[22].
Most of China adopts 35 ??C as
the high-temperature threshold. Therefore, it is
unreasonable to use the same heat wave threshold for the entire region[30].
In the combined heat wave threshold (CHWT) method, we use the combination of
the relative temperature threshold (RTT) and absolute temperature threshold
(ATT) to define heat waves.
For the climatological relative temperature
threshold (CRTT): when the temperature of a certain location is higher than the
long-term historical temperature, the possibility of heat waves increases.
Therefore, for each date, we rank the apparent temperature of each grid from
1989 to 2018, select the temperature corresponding to different percentiles as
the RTT to judge heat waves, and define it as the CRTT. CHWT allows setting
different percentile thresholds to adapt to different heat wave standards.
For the annual relative temperature threshold
(ARTT): when the temperature of a certain day is at a high level in the daily
temperature series of that year, it also reflects the possibility of heat
waves. Therefore, for each year, we rank the daily apparent temperature of each
grid and select different percentile thresholds to define RTT, namely, ARTT.
For the absolute temperature threshold (ATT):
when the temperature reaches RTT, heat waves do not necessarily occur (such as
in winter). Therefore, we also set an absolute temperature threshold to avoid
this situation. In this study, we use different combinations of RTT and ATT to
define a high-temperature threshold. The weather process that reaches the
high-temperature threshold and duration threshold (DT) is called a heat wave.
3.2
Technical Route
The main process
of dataset development is as follows. First, the daily monitoring data from
NOAA meteorological stations is downloaded, including the observation records
of temperature, wind speed, humidity and other variables, and the missing values
and outliers are processed. Second, the monitoring data from meteorological
stations are interpolated into grid data by using the elevation-correction
interpolation method. Then, the daily apparent temperature grid data are
calculated based on Humidex. Finally, the combined heat wave threshold method
is used to produce an annual heat wave dataset in the Belt and Road region,
which mainly includes the frequency, duration, and intensity of heat waves. The
technical route is shown in Figure 1.
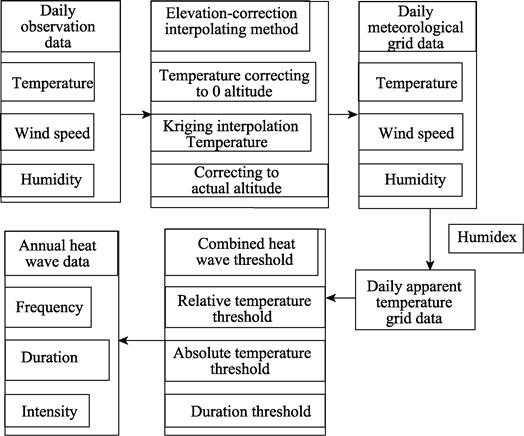
Figure 1 Technical route of the dataset
development
4 Data Results and Validation
4.1 Dataset Composition
The 1989‒2018 heat wave dataset of the Belt
and Road region includes two parts: a daily apparent temperature dataset and an
annual heat wave dataset. The daily apparent temperature dataset includes three
sub datasets of daily mean, minimum and maximum apparent temperature file is
named with the corresponding 8-digit date. The annual heat wave dataset
includes five sub-datasets, two of them are based on the combination of CRTT
and ATT, two based on the combination of ARTT and ATT, and one based on ATT.
Each sub-dataset includes 10 attribute items, such as the frequency, duration,
and intensity of heat waves.
4.2 Data Results
Figure 2 shows
the mean apparent temperature of 6 days in the Belt and Road region in 2018. On
January 1 (Figure 2a), the apparent temperature in Southeast Asia, South Asia
and the Arabian Peninsula reached above 20 ??C, and the extreme apparent temperature in
Indonesia reached even above 40 ??C. In
eastern China and most regions of Europe, the apparent temperature was
approximately 0 ??C; in
the hinterland of the Eurasian continent, the apparent temperature was between
‒10 ??C and ?C20 ??C; and in the Russian Far East, the extreme
apparent temperature was below ‒40 ??C. On March 1 (Figure 2b), with the northward
shift of direct solar radiation, the regional apparent temperature near the
Tropic of Cancer continued to rise, while the low temperature area in the
northern Eurasian continent expanded. Extreme cold temperatures in eastern
Siberia moved westward, and the apparent temperature in Europe decreased to
approximately ‒10 ??C. On
May 1 (Figure 2c), the high-temperature region expanded northward, and the
apparent temperature in the region south of 30?? N generally reached more than
30 ??C. The apparent temperature in most regions in the middle of the Eurasian
continent was approximately 0 ??C, and
the extremely low temperature rose to ‒25 ??C. On July 1 (Figure 2d), the area of the
high-temperature area reached the maximum value for the six dates. The extreme
maximum temperature appeared on the India-Pakistan border, reaching above
40 ??C, and the
apparent temperature in the Eurasian hinterland reached approximately 20 ??C. On September 1 (Figure 2e), the overall
apparent temperature began to decrease, and the high-temperature area shrank
southward, but extreme apparent temperatures above 50 ??C appeared in India and Pakistan. On
November 1 (Figure 2f), the apparent temperature continued to show a decreasing
trend, and the high-temperature area was limited to within the tropics.
Table 1 Dataset composition and description
|
Folder
name
|
Data
content
|
Nomenclature
|
Data
introduction
|
Data
format
|
Data
record
|
Data
volume
|
|
HTMEAN_yyyy_1(2)
|
Daily
mean apparent temperature of the first (second) half of yyyy
|
yyyymmdd
|
Mean
apparent temperature
|
.tif
|
10,975
|
74.8
GB
|
|
HTMIN_yyyy_1
(2)
|
Daily
minimum apparent temperature of the first (second) half of yyyy
|
yyyymmdd
|
Minimum
apparent temperature
|
.tif
|
10,975
|
74.7
GB
|
|
HTMAX_yyyy_1
(2)
|
Daily
maximum apparent temperature of the first (second) half of yyyy
|
yyyymmdd
|
Maximum
apparent temperature
|
.tif
|
10,975
|
74.7
GB
|
|
HW_HTMEAN_CRTT_90_29_3
|
HTMEAN,
CRTT=90, ATT=29, DT=3
|
yyyy_freq
yyyy_dura
yyyy_dmean
yyyy_dmin
yyyy_dmax
yyyy_tmean
yyyy_tmin
yyyy_tmax
yyyy_start
yyyy_end
|
Frequency
Total
duration
Mean
duration
Maximum
duration
Minimum
duration
Mean
apparent temperature
Minimum
apparent temperature
Maximum
apparent temperature
Start
date of the first heat wave
End
date of the last heat wave
|
.tif
|
150
|
9.25
GB
|
|
HW_HTMEAN_CRTT_95_29_3
|
HTMEAN,
CRTT=95, ATT=29, DT=3
|
|
HW_HTMEAN_ARTT_80_29_3
|
HTMEAN,
ARTT=80, ATT=29, DT=3
|
|
HW_HTMEAN_ARTT_85_29_3
|
HTMEAN,
ARTT=85, ATT=29, DT=3
|
|
HW_HTMEAN_ATT_29_3
|
HTMEAN,
ATT=29, DT=3
|
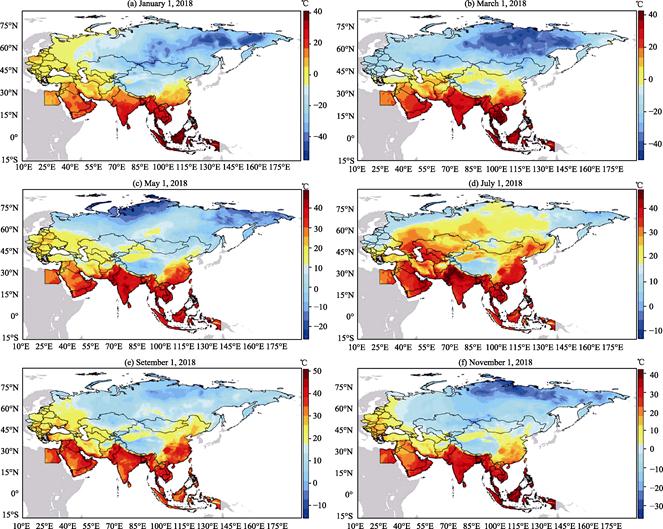
Figure 2 Daily apparent temperature
Based
on ARTT=80, ATT=29, and DT=3, Figure 3 shows the main attributes of heat waves
in the Belt and Road region in 2018. In 2018, the southeastern coast of China,
northern Southeast Asia, northern South Asia, and parts of the Arabian
Peninsula had the highest frequency of heat waves, reaching more than eight
times. Except for the Qinghai-Tibet Plateau, the frequency of heat waves in the
region south of 45??N was generally 4?C6 times, while no heat waves were detected
in other regions (Figure 3a).
Eastern
China, South Asia and West Asia had the longest heat wave duration, lasting
more than 40 days, and the longest single heat wave duration in these regions
was also longer (Figure 3b, c). The extreme apparent temperature in eastern
China reached more than 40 ??C, while in South Asia, it reached more than
50 ??C (Figure 3d). According to Figure 3e and Figure 3f, the first heat
wave started earlier in the southern area of the Belt and Road region, while
the last heat wave ended later, while the opposite was true in the north.
Specifically, the start date of the first heat wave in southern China, South
Asia and the Arabian Peninsula was approximately the 120th day,
while the end date of the last heat wave was approximately the 250th
day.
4.3 Verification of Data
Results
Based on ARTT=80, ATT=29, and DT=3, Figure 4 shows heat wave
events in western Russia in 2010 to compare the results of this study with the
work of Raei et al.[31].
According
to the results of this study, a total of
3?C5 heat waves were detected in western Russia in 2010 (Figure 4a1), and the
total duration of heat waves was 25?C40 days, with the longest duration lasting
20?C30 days. The total duration of the heat wave near Moscow lasted 40 days,
among which the longest heat wave lasted for 30 days (Figure 4b1, 4c1).
The
extreme apparent temperature in western Russia was 34?C38 ??C (Figure 4d1). The
first heat wave occurred from 170?C200 days, and the last heat wave ended from
220?C240 days (Figure 4e1, 4f1). Raei et
al. established the probability distribution function of daily temperature
in different time windows and defined heat waves by the temperature
corresponding to different percentile thresholds. Based on a 21-day time
window, the 90th percentile, and a 3-day duration. Figure 3 shows
the results calculated by Raei et al.
Compared with the results of this study, the frequency and total duration of
heat waves are close to each other, but the spatial distribution is very
different, and the high value area is relatively discrete (Figure 4a2, 4b2).
The
heat wave with the longest duration was detected near Moscow, lasting 10?C12
days (Figure 4c2, 4d2). The spatial distribution of extreme apparent
temperature, the start date of the first heat wave and the end date of the last
heat wave are difficult to explain. First, it is unreasonable for the
temperature to be lower than 0 ??C in the area where heat waves occur. Second,
for western Russia, it is not practical to detect a large area of heat waves
after 300 days (Figure 4e2, 5f2). In general, the results of this study are
basically consistent with existing studies but with better interpretability and
higher spatial resolution.
5 Discussion and Conclusions
(1) In
this study, a dataset of heat waves in the Belt and Road region from 1989 to
2018 was developed pared with air temperature, using apparent temperature can
more accurately reflect the real feeling of the human body toward the external
environment. Therefore, the heat wave dataset produced based on apparent
temperature is more accurate and reliable.
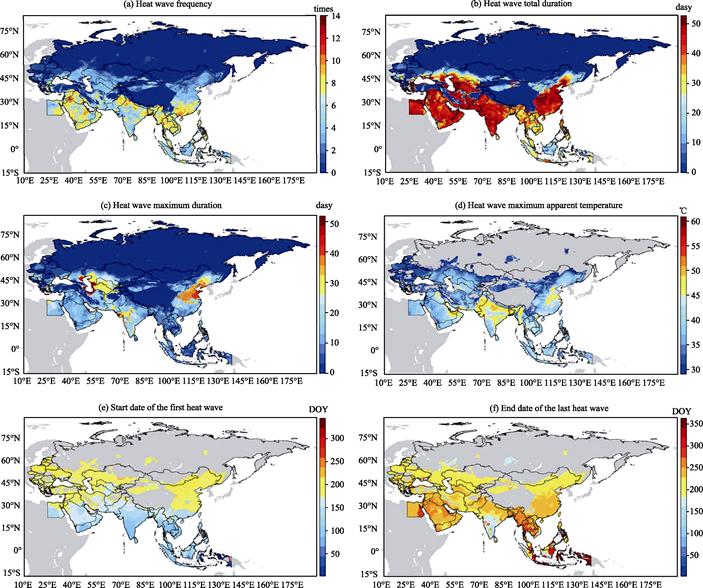
Figure 3 Heat waves in
2018 (ARTT=80, ATT=29, DT=3)

Figure 4 Comparison with the work of Raei et al. (the heat wave event in western
Russia in 2010)
(2) In
this study, the combination of the absolute temperature threshold and relative
temperature threshold was adopted to calculate heat waves, making the heat wave
threshold more in line with the actual situation of different periods in
different places. In addition, the different combinations of each threshold can
be adjusted to meet different use needs. (3) The dataset developed in this
study has higher spatial resolution and can display more details.
By comparing typical
heat wave events with other research results, the results presented in this
dataset are more reasonable, more detailed, and more scientific. This dataset
can provide data support for research related to heat waves.
Author Contributions
Yang, F.
designed the overall dataset; Yin, C. collected and processed heat wave
datasets in the One Belt and One Road region from 1989 to 2018 based on
apparent temperature. Yin, C. designed the model and algorithm. Yin, C.
performed data verification; Yin, C. wrote data papers and so on.
Conflicts
of Interest
The authors declare no
conflicts of interest.
References
[1]
Luterbacher,
J., Dietrich, D., Xoplaki, E., et al.
European seasonal and annual temperature variability, trends, and extremes
since 1500 [J]. Science, 2004, 303(5663): 1499‒1503.
[2]
Coumou, D.,
Rahmstorf, S. A decade of weather extremes [J]. Nature climate change,
2012, 2(7): 491.
[3]
De Bono, A.,
Giuliani, G., Kluser, S., et al.
Impacts of summer 2003 heat wave in Europe [J]. Environment Alert Bulletin, 2004, 35(1/2):
19-24.
[4]
Gutterman,
S. Heat, smoke sent Russia deaths soaring in 2010: govt [N]. Healthcare & Pharma, 2010.
[5]
Mcmichael,
A. J., Lindgren, E. Climate change: present and future risks to health, and
necessary responses [J]. Journal of internal medicine, 2011, 270(5):
401‒413.
[6]
Carnie, J.
January 2009 Heatwave in Victoria: an assessment of health impacts [R].
Victorian Government Department of Human Services, Melbourne, 2009.
[7]
Mazdiyasni,
O., Aghakouchak, A., Davis, S. J., et al.
Increasing probability of mortality during Indian heat waves [J]. Science
Advances, 2017, 3: e1700066.
[8]
Yan, H. M.,
Chen, W. N., Yang, F. X., et al.
Spatial and temporal patterns of extreme climate events in Inner Mongolia
during the past 50 years [J]. Geographical
Research, 2014, 33(01): 13‒22.
[9]
Meehl, G. A.,
Tebaldi, C. More intense, more frequent, and longer lasting heat waves in the
21st century [J]. Science, 2004, 305(5686): 994‒997.
[10]
Perkins-Kirkpatrick,
S., Alexander, L., Nairn, J. Increasing frequency, intensity and duration of
observed global heatwaves and warm spells [J]. Geophysical Research Letters,
2012, 39(20): L20714.
[11]
Peng, C.,
Regmi, A. D., Qiang, Z., et al.
Natural Hazards and Disaster Risk in One Belt One Road Corridors [C].
Proceedings of the Workshop on World Landslide Forum, 2017.
[12]
Cui, P., Su,
F. H. Application of domestic high resolution satellite in natural disaster
risk management of the Belt and Road Initiative [J]. Satellite Application, 2016, 10: 8‒11.
[13]
Mao, X. Z.,
Liu, J. H., Li, T. S., et al. Spatial
and temporal distribution characteristics of natural disasters in countries
along the Belt and Road [J]. Journal of
Natural Disasters, 2018, 27(1): 1‒8.
[14]
Yin, C.,
Yang, F. Dataset of high temperature and heat wave in the Belt and Road Region
(1989?C2018) [J /DB/OL]. Digital Journal
of Global Change Data Repository, 2020. https://doi.org/10.3974/10.3974/
geodb.2020.09.08.V1.
https://cstr.escience.org.cn/STR:20146.11.2020.09.08.V1.
[15]
GCdataPR
Editorial Office. GCdataPR data sharing policy [OL]. https://doi.org/10.3974/dp.policy.2014.05
(Updated 2017).
[16]
Li, M.,
Wang, X. L., Ding, Y. Y. Comparison of several daily temperature interpolation
methods [J]. Anhui Agricultural Science, 2014, (25): 8670‒4.
[17]
Chen, D. H.,
Chen, Z., Wang, S. Y., et al. Study
on spatial interpolation of the average temperature in the Yili River Valley
based on DEM [J]. Spectroscopy &
Spectral Analysis, 2011, 31(7): 1925‒1929.
[18]
Zhao, J.,
Fei, L., Fu, H., et al. A DEM-based
partition adjustment for the interpolation of annual cumulative temperature in
China [C]. Proceedings of SPIE?Dthe International Society for Optical
Engineering, 2007.
[19]
Pan, Y., He,
C., Zhang, Q., et al. Smart distance
searching and DEM-informed interpolation of surface air temperature of
climatology in China [C]. Proceedings of the IGARSS 2004 2004 IEEE
International Geoscience and Remote Sensing Symposium, 2004.
[20]
Khanjani, N.,
Bahrampour, A. Temperature and cardiovascular and respiratory mortality in
desert climate: a case study of Kerman, Iran [J]. Iranian Journal of Environmental Health Science & Engineering, 2013, 10(1): 11.
[21]
Lowe, D.,
Ebi, K. L., Forsberg, B. Heatwave early warning systems and adaptation advice
to reduce human health consequences of heatwaves [J]. International Journal of Environmental Research and Public
Health, 2011, 8(12): 4623‒48.
[22]
Wang, Y.,
Nordio, F., Nairn, J., et al.
Accounting for adaptation and intensity in projecting heat wave-related
mortality [J]. Environmental Research, 2018, 161: 464‒471.
[23]
Li, N., Xu,
Y. M., He, M., et al. Retrieval of
apparent temperature in Beijing based on remote sensing [J]. Journal of
Ecology and Environment, 2018, 27(6): 1113‒1121.
[24]
Hodder, S.
G., Parsons, K. The effects of solar radiation on thermal comfort [J]. International
Journal of Biometeorology, 2007, 51(3): 233‒50.
[25]
Masterson,
J., Richardson, F. A. Humidex: a method of quantifying human discomfort due to
excessive heat and humidity, Environment Canada [Z]. Environment Canada,
Atmospheric Environment Service, Ontario, Canada, 1979.
[26]
Francesca
Romana, D. A. A., Boris Igor, P., Giuseppe, R. Thermal environment assessment
reliability using temperature?Dhumidity indices [J]. Industrial Health,
2011, 49(1): 95‒106.
[27]
Bobb, J. F.,
Dominici, F., Peng, R. D. A Bayesian model averaging approach for estimating
the relative risk of mortality associated with heat waves in 105 U. S. cities [J].
Biometrics, 2011, 67(4): 1605‒1616.
[28]
Roetzel, A.,
Tsangrassoulis, A., Dietrich, U., et al.
A review of occupant control on natural ventilation [J]. Renewable & Sustainable Energy Reviews,
2010, 14(3): 1001‒1013.
[29]
Zuo, J.,
Pullen, S., Palmer, J., et al. Impacts
of heat waves and corresponding measures: a review [J]. Journal of Cleaner
Production, 2015, 92: 1‒12.
[30]
Chen, Y.,
Li, Y. An Inter-comparison of three heat wave types in China during 1961?C2010:
observed basic features and linear trends [J]. Scientific Reports, 2017,
7(1): 45619.
[31]
Raei, E.,
Nikoo, M. R., Aghakouchak, A., et al.
Data descriptor: GHWR, a multi-method global heatwave and warm-spell record and
toolbox [J]. Scientific Data, 2018, 5(1): 180206.