Simulation-Prediction Dataset of Annual Irrigation
Water Requirement of Cotton and Winter Wheat in Five Central Asian Countries
under RCP2.6 and RCP4.5 Scenarios (2020-2100)
Tian, J.
Key Laboratory of Water Cycle and Related Land Surface
Processes, Institute of Geographic Sciences and Natural Resources Research,
Chinese Academy of Sciences, Beijing 100101, China
Abstract: Central Asia is one of the
largest arid and semi-arid regions in the world. The region is currently facing
significant shortage of water resources for agricultural irrigation.
Agricultural irrigation is the largest water consumer and hence understanding
the water requirement of the main crops is important
for planning of agricultural water resources. The study presented in this paper
was based on the Representative Concentration Pathway RCP2.6 and RCP4.5 climate
change scenarios of Coupled Model Intercomparison Project Phase 5 (CMIP5). The
water requirements of cotton and winter wheat in five Central Asian countries
(Kazakhstan, Kyrgyzstan, Tajikistan, Uzbekistan and Turkmenistan) in 2020-2100 were estimated using the crop coefficient approach. The dataset is
archived in .shp and .tif formats in 332 data files, with the data size of 4.65
MB (compressed to 2.16 MB in one file).
Keywords: Central Asian countries;
cotton and winter wheat; future irrigation water requirement; RCP2.6 scenario;
RCP4.5 scenario
Dataset Available Statement:
The dataset supporting this paper was published at: Tian,
J. Irrigation water requirement for cotton and winter wheat in five Central
Asian countries under RCP2.6 and RCP4.5 scenarios (2020?C2100) [J/DB/OL]. Digital Journal of Global
Change Data Repository, 2020. DOI: 10.3974/geodb.2020.01.04.V1.
1 Introduction
The five countries located in
Central Asia include Kazakhstan, Kyrgyzstan, Tajikistan,
Uzbekistan and Turkmenistan. Central
Asia is one of the largest arid and semi-arid regions in the world, with scarce
precipitation, intensive evaporation and a serious shortage of water resource.
According to World Bank??s Monthly Rainfall Database (https://climateknowledgeportal.worldbank.org/),
the average rainfall in 2000?C2016 was 523 mm in Tajikistan, 414 mm in
Kyrgyzstan, 270 mm in Kazakhstan, 211 mm in Uzbekistan, and 155 mm in Turkmenistan.
In addition to the energy sector, agriculture occupies an important position in
the economic development of the five Central Asian countries.
Irrigated
farmlands in the five Central Asian countries are mainly distributed in the
south and southeast of the entire region. According to the land use data of
European Space Agency (ESA, https://www.esa-landcover-cci.org/) Climate Change
Initiative (CCI) in 2015, the area of irrigated farmland was 86,269 km2
in Kazakhstan, 81,198 km2 in Uzbekistan, 40,233 km2 in
Turkmenistan, 32,178 km2 in Kyrgyzstan and 14,283 km2 in
Tajikistan. In terms of crop production, the planting area of wheat and cotton
in the five Central Asian countries accounted for 93% of the total area
cultivated in 2015 based on the statistics of Food and Agriculture Organization
(FAO, http://www.fao.org/faostat/en/#data). Irrigation is the most important
means of agricultural production, and the most important consumer of water resources
in Central Asia[1]. The
agricultural irrigation water requirements in Central Asia exceed 90% of all
water withdrawals of the two major rivers, the Amu Darya and the Syr Darya[2?C3]. Therefore, the changes in
agricultural irrigation have significant impacts on the water resources in this
region. The crop water requirement is the key to determining the water requirement
of agricultural irrigation[4].
In the present
study, which is based on the Representative Concentration Pathway RCP2.6 and
RCP4.5 climate change scenarios of Coupled Model Intercomparison Project Phase
5 (CMIP5), the water requirements of cotton and winter wheat in the five
Central Asian countries in 2020?C2100 were estimated using the crop coefficient
approach. This will provide guidance for the exploration of the development of
agricultural water resources in Central Asia in the future. This is also
expected to facilitate the future agricultural cooperation between China and
the five Central Asian countries under the strategic initiative of the ??the
Belt and Road Initiative??.
2 Metadata of
the Dataset
The
name, author, geographical region, temporal resolution, spatial resolution,
data format, data publisher, and data sharing policy of the dataset[5]
are shown in Table 1.
3 Methods
3.1 Algorithm Principle
The method of FAO
crop water requirement (mm) was used, as shown in equation (1).
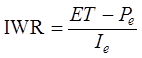 (1)
(1)
Table 1 Metadata summary of the dataset
|
Items
|
Description
|
|
Dataset full name
|
Irrigation water requirement for cotton and winter wheat in five Central
Asian countries under RCP2.6 and RCP4.5 Scenarios
|
|
Dataset short name
|
IrriWaterRe_CottonWheat_CenAsia_2020-2100
|
|
Authors
|
Tian, J. AAO-7972-2020, Institute
of Geographic Sciences and Natural Resources Research, Chinese Academy of Sciences, tianj.04b@igsnrr.ac.cn
|
|
Geographical region
|
Five Central Asian countries Year
2020?C2100
|
|
Temporal resolution
|
Year
|
Spatial resolution 0.5
degree
|
|
Data format
|
.tif
|
Data size 2.16 MB
(after compression)
|
|
Data files
|
Annual irrigation water requirement of cotton and winter wheat under
scenarios of RCP2.6 and RCP4.5 (2020?C2100)
|
(To be continued on the next page)
(Continued)
|
Items
|
Description
|
|
Foundation
|
Chinese Academy
of Sciences (XDA2004030201)
|
|
Computing environment
|
ENVI & IDL (5.1 & 8.3)
|
|
Data publisher
|
Global Change Research Data Publishing
& Repository, http://www.geodoi.ac.cn
|
|
Address
|
No. 11A, Datun Road, Chaoyang District,
Beijing 100101, China
|
|
Data sharing policy
|
Data from the Global Change Research Data Publishing
&Repository includes metadata, datasets (in the Digital Journal of Global
Change Data Repository), and publications (in the Journal of Global
Change Data & Discovery). Data sharing policy includes:
(1) Data are openly available and can be free downloaded via
the Internet; (2) End users are encouraged to use Data subject
to cita-tion; (3) Users, who are by definition also value-added service
providers, are welcome to redistribute Data subject to written
permission from the GCdataPR Editorial Office and the issuance of a Data
redistribution license; and (4) If Data are used to
compile new datasets, the ??ten per cent principal?? should be followed such
that Data records utilized should not surpass 10% of the new
dataset contents, while sources should be clearly noted in suitable places in
the new dataset[6]
|
|
Communication and
searchable system
|
DOI, DCI, CSCD, WDS/ISC, GEOSS, China GEOSS, Crossref
|
where Pe indicates the effective rainfall, namely the rainfall
actually used by the crops and was calculated using the USDA method [see
equation (2)]; ET indicates the
actual crop evapotranspiration, calculated using the crop coefficient approach
[equation (3)]; and Ie indicates
the irrigation efficiency, namely the ratio of the irrigation water volume
actually used by crops to the actual water withdrawals. According to Rost et al.[7], the
irrigation efficiency in Central Asia is 56.6% based on a global scale.
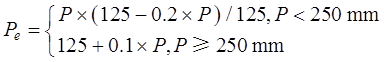 (2)
(2)
where P represents the monthly rainfall (mm).
The actual crop
evapotranspiration was calculated using the crop coefficient approach and
reference evapotranspiration approach:
 (3)
(3)
where Kc represents
the crop coefficient. In this study, the crop coefficients of cotton and winter
wheat in the four growth stages in Central Asia given by Scientific Information
Centre of Interstate Commission on Water Coordination
in Central Asia (SIC-ICWC) were used[8?C9]
(Table 2). ET0 is
the reference crop evapotranspiration (mm??day?C1), calculated by
equation (4)[10]. This method is
an improved version of the original FAO method, with particular attention given
to the impact of atmospheric CO2 concentration on crop evapotranspiration.
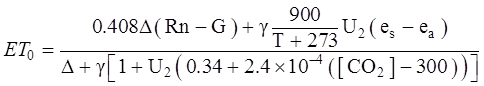 (4)
(4)
where ?? indicates
the slope of changes in water vapor pressure with temperature (kPa??ºC-1), Rn indicates the net
radiation (MJ??m?C2??day?C1), G represents the soil heat flux
(MJ??m?C2??day?C1), ?? represents the psychrometric constant (kPa??ºC-1), T is the daily average temperature
(ºC), U2 is the daily average wind velocity at a height of
2 m (m??s-1), es
refers to the saturation vapor pressure (kPa), ea refers to the
actual vapor pressure (kPa), and [CO2] refers to the atmospheric CO2
concentration (ppm). The specific calculation method of each variable is shown
in the ??FAO No.56 Irrigation and
Drainage Manual??[11].
Table 2 Kc values for cotton and for winter wheat at the four
different growth stages
|
Growing stage
|
Planting/Harvesting (date)
Cotton Winter
wheat
|
Growth stages (days)
Cotton Winter wheat
|
Crop coefficients (Kc)
Cotton Winter
wheat
|
|
Planting: initial
|
Early-April
|
Mid-October
|
30
|
30
|
0.55
|
0.65
|
|
Development phase
|
|
|
50
|
140
|
0.55
|
0.65
|
|
Mid-season
|
|
|
55
|
40
|
0.95-1.15
|
1.15
|
|
Harvest: late-season
|
Early-October
|
Early-June
|
45
|
30
|
0.65
|
0.65
|
3.2 Technical Route
|

Figure 1 Technical route
|
The procedures of generating
dataset are as follows: the monthly average daily maximum temperature, monthly
average daily minimum temperature and monthly rainfall were downloaded from the
outputs of 15 climate models under the CMIP5 RCP2.6 and RCP4.5 scenarios. The
information about growth phases and crop coefficients of cotton and winter
wheat in Central Asia were obtained through literature review. The averages of
monthly average daily maximum temperature, monthly average daily minimum temperature
and monthly rainfall for the 15 climate models under RCP2.6 and RCP4.5
scenarios were calculated. The effective monthly rainfall was calculated based
on the monthly rainfall data. The reference evapotranspiration of cotton and
winter wheat was calculated based on the monthly average daily maximum temperature
and monthly average daily minimum temperature. The actual evapotranspiration of
cotton and winter wheat was calculated using the crop coefficient and reference
crop evapotranspiration. Finally, the crop water requirement was obtained using
the actual evapotranspiration, effective rainfall and irrigation coefficient.
An extreme and hypothetical situation was
assumed in this study, that is, cotton or winter wheat is planted in the entire
Central Asia. The results obtained based on such a hypothesis are helpful for
analyzing the spatial pattern of the water requirements of cotton and winter
wheat in Central Asia in the future. They can be combined with the prediction
results of future agricultural lands to analyze the total irrigation water
requirement more accurately.
4 Data Results and Verification
4.1 Dataset Composition
This
dataset consisted of four parts:
(1) Annual water
requirement of cotton in 2020?C2100 under the RCP2.6 scenario;
(2) Annual water
requirement of cotton in 2020?C2100 under the RCP4.5 scenario;
(3) Annual water
requirement of winter wheat in 2020?C2100 under the RCP2.6 scenario;
(4) Annual water
requirement of winter wheat in 2020?C2100 under the RCP4.5 scenario.
The files were
named in a uniform way (Table 3).
4.2 Data Results
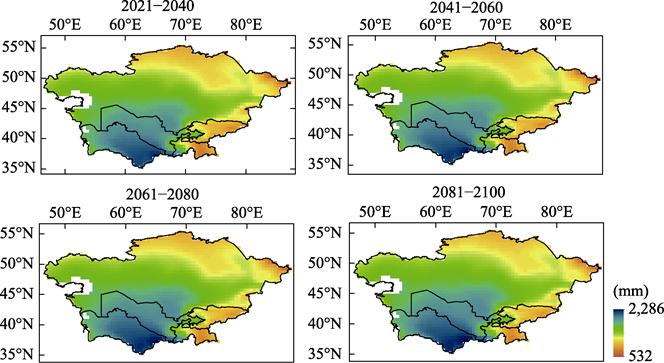
(1)
Future water requirement of cotton under the RCP2.6 and RCP4.5 scenarios
In terms of
the spatial distribution, the future water requirement of cotton gradually declined
from southwest to north and east under the RCP2.6 and RCP4.5 scenarios (Figure
2-3). It was the highest in
Turkmenistan, followed by Uzbekistan, and it was the lowest in Tajikistan and
Kyrgyzstan. The future water requirement was also lower in northern Kazakhstan.
Such a spatial distribution pattern (532-2,286 mm) remained unchanged in 2020?C2100. Compared with
Turkmenistan and Uzbekistan, the higher rainfall during the cotton growing
season in Tajikistan, Kyrgyzstan and northern Kazakhstan was the main reason
for the lower water requirement of cotton. According to the calculation method
of crop water requirement, the spatial characteristics of meteorological
conditions (mainly including rainfall, temperature, wind velocity and
radiation) basically determined the spatial characteristics of crop water
requirement. The spatial distribution characteristics of meteorological
conditions under the RCP2.6 and RCP4.5 scenarios were basically the same.
Therefore, the spatial distribution pattern of crop water requirement remained
unchanged.
Table 3 Data files of the dataset
|
Fold name
|
Nomination
|
Description
|
Format
|
Number
|
Data size
|
|
CottonRCP26
|
CA_yearly_CottonIWR_CO2_RCP26_yeaer_NAN.tif
|
WGS84: NAN
|
.tif
|
81
|
1.1 MB
|
|
CottonRCP45
|
CA_yearly_CottonIWR_CO2_RCP45_year_NAN.tif
|
WGS84: NAN
|
.tif
|
81
|
1.1 MB
|
|
WheatRCP26
|
CA_yearly_WheatIWR_CO2_RCP26_year_NAN.tif
|
WGS84: NAN
|
.tif
|
81
|
1.1 MB
|
|
WheatRCP45
|
CA_yearly_WheatIWR_CO2_RCP45_year_NAN.tif
|
WGS84: NAN
|
.tif
|
81
|
1.1 MB
|
(2)
Future water requirement of winter wheat under the RCP2.6 and RCP4.5 scenarios
Under the RCP2.6 and RCP4.5 scenarios, the spatial distribution of
future water requirement of winter wheat was the same as that of cotton, and
also gradually declined from southwest to north and east (Figure 3-4). It was the highest in Turkmenistan, followed by Uzbekistan, and
it was the lowest in Tajikistan and Kyrgyzstan. Such a spatial distribution
pattern (-329-1,440 mm) remained unchanged in
2020?C2100. The negative value indicated the higher effective rainfall than the
crop water requirement, that is, rainfall can meet the requirement of crop
growth. Obviously, the water requirement of winter wheat was lower
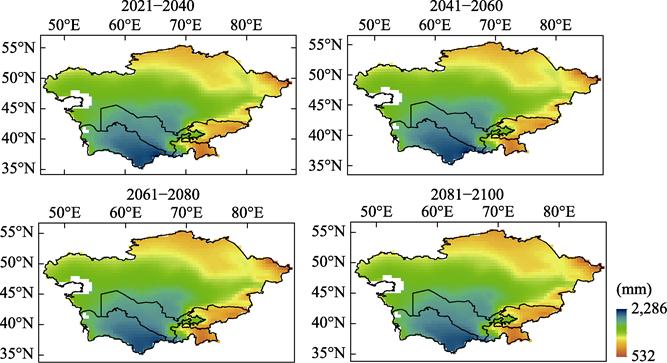
Figure
2 Spatial
distribution of water requirement of cotton in five Central Asian countries in
four periods under the RCP2.6 scenario
Figure
3 Spatial
distribution of water requirement of cotton in five Central Asian countries in
four periods under the RCP4.5 scenario
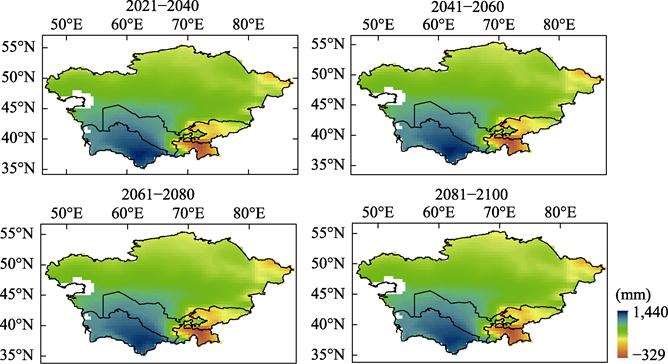
Figure
4 Spatial
distribution map of water requirement of winter wheat in five Central Asian
countries in four periods under the RCP2.6 scenario
than that of cotton. In Tajikistan, the rainfall during the winter wheat
growing season was even higher than the crop water consumption, and hence the
crop water requirement was negative. The spatial distribution characteristics
of meteorological conditions were basically the same under the RCP2.6 and
RCP4.5 scenarios, and therefore the spatial distribution pattern of crop water
requirement basically remained unchanged.
(3)
Future change trends of water requirements of cotton and winter wheat under the
RCP2.6 and RCP4.5 scenarios
The future change trends of water
requirements of cotton and winter wheat in 2020?C2100 were analyzed using the
Mann-Kendall test. The slope of change trends at the 0.05 level is shown in
Figure 6. Under the RCP2.6 scenario, the water requirement of cotton displayed
a significant downward trend in mid-eastern and northeastern Kazakhstan, and in
eastern Turkmenistan. There was insignificant change in cotton water
requirement in other regions. Under the RCP4.5 scenario, the water requirement
of cotton increased in the entire Central
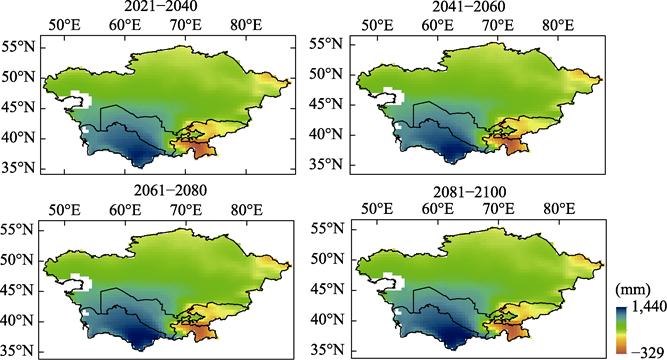
Figure 5 Spatial
distribution map of water requirement of winter wheat in five Central Asian
countries in four periods under the RCP4.5 scenario
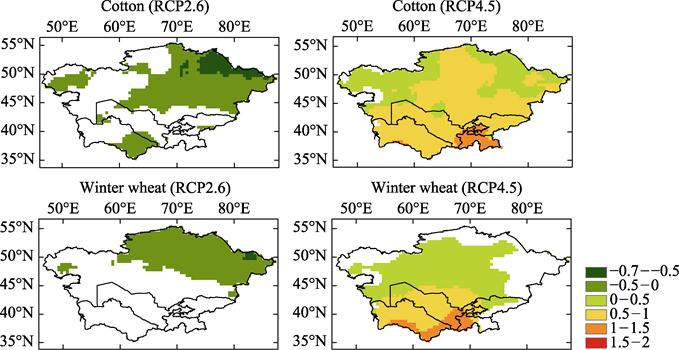
Figure
6 Slope of change
trends of water requirements of cotton and winter wheat under the RCP2.6 and
RCP4.5 scenarios in 2020?C2100 (at the 0.05 level)
Asia, especially in
Tajikistan. Besides, under the RCP2.6 scenario,
the water requirement of winter wheat showed a significant downward trend in
northeastern Kazakhstan, while it had no obvious trend in other regions. Under
the RCP4.5 scenario, except a few regions in eastern, southeastern and northern
Central Asia, the water requirement of winter wheat almost increased in the
entire Central Asia. This increase was more pronounced in the south of Central
Asia. It can be seen that the change trends of water requirements of cotton and
winter wheat under the RCP2.6 and RCP4.5 scenarios have great differences,
which is mainly due to the differences in the two climate change scenarios.
RCP2.6 is a scenario where the radiative forcing first rises to 3.1 W??m-2 by the middle of the 21st
century and then gradually declines, and reaches 2.6 W??m-2 by 2100. RCP4.5 is a scenario where
the radiative forcing gradually rises and reaches 4.5 W??m-2 by 2100. Therefore, the change
trends of meteorological elements vary with time under the two scenarios,
leading to different change trends of crop water requirement.
5 Discussion and Conclusion
The water requirements of cotton and
winter wheat in five Central Asian countries (Kazakhstan, Kyrgyzstan,
Tajikistan, Uzbekistan and Turkmenistan) in 2020?C2100 were estimated through
the crop coefficient approach. The attributes of the datasets generated set as
follows time span: 2020?C2100, temporal resolution: year, spatial
resolution: 0.5 degrees, and data format: .tif. It is worth noting that the
crop water requirement was estimated under an extreme and hypothetical situation,
which assumed that cotton or winter wheat is planted in the entire Central
Asia. The main reason for this assumption is that it is difficult to predict
the specific planting of cotton and winter wheat in the next few decades. The
hypothesis used in this paper is more helpful for analyzing the changes in crop
water requirement in the entire Central Asia. The dataset reflected the temporal-spatial
patterns and change pattern of the water requirements of cotton and winter
wheat in the five Central Asian countries in the next 80 years.
According to the
data analyzed, it was found that: (1) Under the RCP2.6 and RCP4.5 scenarios, it
was the highest in Turkmenistan, followed by Uzbekistan. The future water requirement was the lowest in Tajikistan and Kyrgyzstan, and also
lower in northern Kazakhstan. (2) Under the RCP2.6 and RCP4.5 scenarios,
it was the highest in Turkmenistan, followed by Uzbekistan, and it was the
lowest in Tajikistan and Kyrgyzstan. (3) The spatial distribution patterns of
cotton and winter wheat remained basically unchanged under the RCP2.6 and
RCP4.5 scenarios in 2020?C2100. (4) The change trends of water requirements of
cotton and winter wheat under the RCP2.6 and RCP4.5 scenarios varied
significantly. Under the RCP2.6 scenario, the water requirements of cotton and
winter wheat displayed significant downward trends only in the northeast of
Central Asia, while there were no major changes in other regions. Under the
RCP4.5 scenario, the water requirements of cotton and winter wheat remarkably
increased almost in the entire Central Asia.
References
[1]
Yang, S. T., Yu, X. Y., Ding,
J. L., et al. A review of water
issues research in Central Asia [J]. Acta
Gegraphica Sinica, 2017, 72(1): 79-93.
[2]
Deng, M. J., Long, A. H.,
Zhang, Y., et al. Assessment of water
resources development and utilization in the five Central Asia countries [J]. Advances in Earth Science, 2010,
25(12): 1347-1356.
[3]
Yuldasheva, G., Hashimova, U.,
Callahan, J. Current trends in water management in Central Asia [J]. Peace and Conflict Review, 2010, 5: 1-11.
[4]
Tian, J., Zhang, Y. Q.
Detecting changes in irrigation water requirement in Central Asia under CO2
fertilization and land use changes [J]. Journal
of Hydrology, 2020, 48: 124315.
[5]
Tian, J. Dataset of annual
irrigation water requirements of cotton and winter wheat in the five entral
Asian countries under RCP2.6 and RCP4.5 scenarios (2020-2100) [J/DB/OL]. Digital
Journal of Global Change Data Repository, 2020. DOI:
10.3974/geodb.2020.01.04.V1.
[6]
GCdataPR
Editorial Office. GCdataPR data sharing policy [OL]. DOI:
10.3974/dp.policy.2014.05 (Updated 2017).
[7]
Rost, S., Gerten, D., Bondeau,
A., et al. Agricultural green and
blue water consumption and its influence on the global water system [J]. Water Resources Research, 2008, 44:
10.1029/2007wr006331.
[8]
Stulina,
G. Recommendations on hydromodule zoning and crop irrigation rate [Z]. SIC
ICWC, Tashkent, 2010.
[9]
Conrad, C., Rahmann, M.,
Machwitz, M., et al. Satellite based
calculation of spatially distributed crop water requirements for cotton and wheat
cultivation in Fergana Valley, Uzbekistan [J]. Global and Planetary Change, 2013, 110: 88-98.
[10]
Yang, Y. T., Roderick, M. L.,
Zhang, S. L., et al. Hydrologic
implications of vegetation response to elevated CO2 in climate
projections [J]. Nature Climate Change,
2019, 9: 44-48.
[11]
Allen,
R. G., Pereira, L. S., Raes, D., et al.
FAO irrigation and drainage No.56: crop evapotranspiration [Z].