Dataset of Risk Assessment of Tropical Cyclone on the
Western North Pacific Basin (1980-2022)
Tong, J. Y.1, 2 Wu, Q. T.1* Qian, Q. L.2
1. Guangzhou Institute of
Geography, Guangzhou Academy of Science, Guangzhou 510070, China;
2. Guangzhou University, School
of Geography and Remote Sensing, Guangzhou 510006, China
Abstract: A tropical cyclone is a cyclonic vortex that
originates on the surface of tropical or subtropical oceans. It can cause
several natural disasters including intense winds, large waves, torrential
rain, storm surges, and others, all of which can seriously harm human lives and
productivity. China is one of the nations most severely affected by tropical
cyclones, suffering enormous annual losses of human life and direct financial
damage in the Western North Pacific basin. Hence, for the preservation of the
marine biological environment and the growth of the marine economy, scientific
evaluation of the risk level of tropical cyclone disasters is important. The
China Meteorological Administration??s ??TC best-track datasets for the Western
North Pacific basin?? served as the foundation for this dataset. An analysis of
the tropical cyclone track data obtained between 1980 and 2022 was conducted
using the ArcGIS platform and Python application. First, the kernel density
approach was used to examine the degree of impact of tropical cyclones in the
Western North Pacific basin between 99??E?C160??E and 2??N?C52??N, classifying the
danger of disaster. Second, the total number of tropical cyclones that occurred
in China's land area from 1980 to 2022 was calculated. The findings indicate
that: (1) The South China Sea and the Philippine Sea have the highest risk
levels and are most severely impacted by tropical storms in the Western North
Pacific basin. (2) The pattern of gradually decreasing tropical cyclone frequency from coastal to interior locations is
evident in China??s land area. Hainan province experienced the highest number of
tropical cyclones, followed by Taiwan province and Leizhou Peninsula in
Guangdong province. The dataset comprises the following components: (1) the
risk level of tropical cyclone disasters in the Western North Pacific basin,
(2) the cumulative number of tropical cyclones in the Chinese land area, and
(3) tropical cyclone statistics for the Western North Pacific basin. The
dataset was archived in .tif and .xls formats, consisting of three data files
with a data size of 1.15 MB (compressed into one file, 224 KB).
Keywords: tropical cyclone; risk assessment
of tropical cyclone; risk level of tropical cyclone; kernel density estimation;
cumulative number of tropical cyclone
DOI: https://doi.org/10.3974/geodp.2023.04.01
CSTR: https://cstr.escience.org.cn/CSTR:20146.14.2023.04.01
Dataset Availability Statement:
The
dataset supporting this paper was published and is accessible through the Digital Journal of
Global Change Data Repository at: https://doi.org/10.3974/geodb.2024.01.04.V1 or
https://cstr.escience.org.cn/CSTR:20146.11.2024.01.04.V1.
1 Introduction
The
National Comprehensive Disaster Prevention and Reduction Plan was established
as part of 14th Five-Year Plan of China[1]. Natural disasters are
common in China and follow the trends of multiple disaster agglomerations and
disaster chains[2]. In the face of complex and changeable natural disasters,
it is vital to strengthen research, monitoring, and early warning systems of
natural disasters. Tropical cyclones generated in the Western North Pacific
basin are one of the main natural disasters affecting China. Their secondary
effects, such as rainstorms and strong winds, often lead to major losses in
social production. Therefore, scientific assessment of the risk level of
tropical cyclones is of great practical significance and can serve as a guide
for the comprehensive prevention and management of tropical cyclones by land
and sea. Additionally, it can enhance China??s strategy to mitigate disasters,
provide relief, and encourage superior development of the marine economy.
Currently, risk
assessment of tropical cyclone disasters in China mainly focuses on loss
assessment, risk zoning, and transmission models[3]. The three
primary categories of assessment methods are those that rely on physical
simulation[4] and those that rely on the entire index systems[5,
6], as well as mathematical model-based techniques for risk assessments[7,
8]. Among these methods, risk assessments based on physical simulations
are usually applicable to smaller-scale analyses because of their high
requirements for simulation environments and experimental equipment. Comprehensive
indicators are based on the regional disaster system theory, selecting
variables of disaster factors, pregnant disaster environments, and disaster
carriers, and assigning corresponding weights for comprehensive risk assessments.
However, the evaluation of this approach is highly dependent on the rationality
of the index system. Moreover, significant disparities exist in the analysis
findings under different index systems, leading to doubts regarding the
scientific nature of the assessment. With the continuous development of digital
technologies, many scholars have begun to assess the risk of tropical cyclone
disasters by combining mathematical modeling and machine learning. This method
offers the advantage of overcoming the limitations of physical simulations and
the subjectivity of index selection by processing and analyzing vast amounts of
data comprehensively. Compared to other methods, analysis methods based on
mathematical models are more suitable for large-scale tropical cyclone disaster
risk assessments. Therefore, this dataset uses the ??TC best-track datasets of the Western North Pacific basin??
provided by the China Meteorological Administration and employs the big data
analysis method to conduct a spatial risk assessment of tropical cyclone disasters.
2 Metadata of the Dataset
The
dataset of risk assessment of tropical cyclone on the Northwest Pacific
(1980?C2022)[9] is summarized in Table 1.
3 Methods
3.1 Data Sources
The tropical cyclone data
was obtained from the ??TC best-track datasets for the Western North Pacific
basin??[10?C12], provided
by the China Meteorological Administration (CMA), This dataset records the
optimal tropical cyclone path information
generated in the Western North Pacific basin since 1949. Its attributes include
the occurrence date
Table
1 Metadata summary
of the Dataset of risk assessment of tropical cyclone on the Western North Pacific
(1980?C2022)
|
Items
|
Description
|
|
Dataset full name
|
Dataset of risk assessment of tropical
cyclone on the Western North Pacific basin (1980?C2022)
|
|
Dataset short name
|
RiskTropCycloneNWPacific
|
|
Authors
|
Tong, J. Y., Guangzhou Institute of
Geography, Guangdong Academy of Sciences / School of Geographic Sciences and
Remote Sensing, Guangzhou University, junyuetong10@163.com
Wu, Q. T., Guangzhou Institute of
Geography, Guangdong Academy of Sciences, wuqitao@gdas.ac.cn
Qian, Q. L., School of Geographic Sciences
and Remote Sensing, Guangzhou University, Qianlynn@21c n.com
|
|
Geographic area
|
99??E?C160??E, 2??N?C52??N and China land area
|
|
Year
|
1980?C2022
|
|
Temporal resolution
|
Year
|
|
Spatial
resolution
|
20 km
|
|
Data format
|
.tif, .xls
|
|
Data size
|
1.15 MB (224 KB after compression)
|
|
Dataset files
|
The dataset consists of two raster data
and one table data. It contains ??the risk level of tropical cyclone disasters
in the Western North Pacific basin??, ??the cumulative number of tropical
cyclones in China land area?? and ??the tropical cyclone statistics for the
Western North Pacific?? calculated using the TC best-track datasets for the
Western North Pacific basin from 1980?C2022
|
|
Foundations
|
National Natural Science Foundation of
China (42071165)
|
|
Data computing
environment
|
Python, ArcGIS, Microsoft Excel 2019
|
|
Data
publisher
|
Global
Change Research Data Publishing & Repository, http://www.geodoi.ac.cn
|
|
Address
|
No.
11A, Datun Road, Chaoyang District, Beijing 100101, China
|
|
Data sharing policy
|
(1) Data
are openly available and can be free downloaded via the Internet; (2) End
users are encouraged to use Data subject to citation; (3)
Users, who are by definition also value-added service providers, are welcome
to redistribute Data subject to written permission from the GCdataPR
Editorial Office and the issuance of a Data redistribution license; and
(4) If Data are used to compile new datasets, the ??ten per cent
principal?? should be followed such that Data records utilized should not
surpass 10% of the new dataset contents, while sources should be clearly
noted in suitable places in the new dataset[14]
|
|
Communication and searchable system
|
DOI, CSTR, Crossref, DCI,
CSCD, CNKI, SciEngine, WDS/ISC, GEOSS
|
(year/month/day/hour
(UTC)), intensity category, longitude, latitude, central minimum pressure
(hPa), 2 minutes average maximum wind speed (MSW, m/s), and 2 minutes average
wind speed (m/s)[13], This dataset is made available for download in
a text-file format. The intensity category in the TC best-track datasets for
the western North Pacific basin is divided according to the national standard
??Grade of Tropical Cyclones (GB/T 19201?D2006)??[15],
which is based on the average wind speed within 2 minutes: 0-weaker than the
tropical depression or class of unknown, 1-tropical depression (TD, 10.8?C17.1
m/s), 2-tropical storm (TS, 17.2?C24.4 m/s), 3-Severe tropical storm (STS,
24.5?C32.6 m/s), 4-Typhoon (TY, 32.7?C41.4 m/s), 5-strong typhoon (STY, 41.5?C50.9
m/s), 6-super typhoon (Super TY, 51.0 m/s) and 9-denaturation in 8 classes. The
spatial visualization of the TC best-track datasets for the Western North
Pacific basin is shown in Figure 1.
3.2 Algorithms
This dataset considers the Western North
Pacific basin within 99??E?C160??E, 2??N?C52??N as the study area. The TC best-track
datasets for the Western North Pacific basin, recorded by the CMA from 1980 to
2022, were selected for disaster risk assessment in the Western North
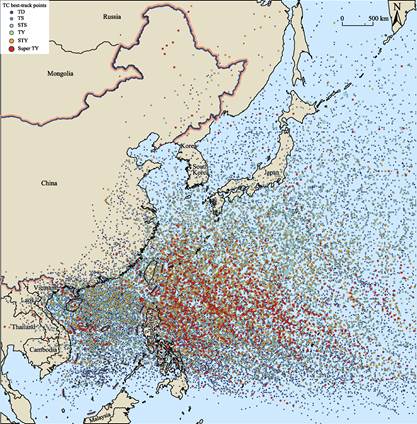
Figure 1 Spatial
visualization of the TC best-track datasets for the Western North Pacific basin
(Notes: TD, tropical
depression; TS, tropical storm; STS, strong tropical storm; TY, typhoon; STY,
strong typhoon; Super TY, super typhoon)
Pacific
basin and the land area of China. The results included the extent of tropical
cyclone impact and the cumulative number of tropical cyclone intrusions in
China??s land area. Some missing records were removed during data processing and
the impact range of the tropical cyclone recording points was estimated (using
the Level 7 wind circle radius) from the IBTrACS dataset published by the
National Oceanic and Atmospheric Administration (NOAA). Geographic information
technology and big data analysis tools, such as Python were predominantly used
in the data analysis process.
The study area
was divided into 20 km by 20 km spatial units for spatial analysis. Second, the
range of influence of the TC best-track points should be defined according to
the intensity level of each best-track point. This would enable the
characterization of their life cycle into the stages of generation,
development, maturity, and extinction. The generation of new best-track points
indicates attenuation or extinction of the previous best-track point. Additionally,
the radius of the strong wind designates the direct weather range of the
tropical cyclone, which can be divided into radii of 12, 10, and 7 wind
circles; the latter is believed to be the most common, causing strong winds and
waves. For a certain spatial unit, it can be assumed that the early stage of
tropical cyclone development is within the Level 7 wind circle and is impacted
by tropical cyclones. However, with the continuous movement of the tropical
cyclone, when the spatial unit is outside the wind circle of the above-track
point, it can be considered almost unaffected by the tropical cyclone disaster.
Figure 2 shows the trajectory data of tropical cyclone ??QingSong?? (Sonamu) in
2000. Initially, the range of influence of each tropical cyclone trajectory
point was set according to the radius of the level 7 wind circle. In the early
stages of development, tropical cyclones belong to the tropical depression
(TD), and with an increase in time and movement of the trajectory, they continuously
evolve into tropical storms (TS), strong tropical storms (STS), typhoons (TY),
and other stages. For space unit A, the influence of the tropical cyclone ??QingSong??
is the sum of points 1 and 2 only when the tropical cyclone trajectory moves to
these points and A falls into the wind field range of the cyclone. However,
when the trajectory moves to point 3, the influence range does not cover unit
A. Therefore, iterating through each TC best-track point is necessary to calculate the impact and effects of
disasters within its influence range. If an iterative algorithm is not used for
the calculation, the core density surface construction and intrusion times are
calculated simultaneously, potentially expanding the scope of the disaster.
|
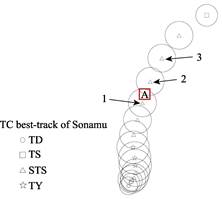
Figure 2 An example of TC best-track datasets
(Notes: TD, tropical depression; TS, tropical storm; STS,
strong tropical storm; TY, typhoon)
|
The impact rank
of tropical cyclones in the sea area and the cumulative number of impacts in
the land area were calculated separately to summarize the tropical cyclone
disaster risk at each 20 km resolution space unit between 1980 and 2022. Due to
the presence of varied landforms or living and production environments, the
disaster risks of tropical cyclones need to be comprehensively analyzed in
combination with natural landform attributes and disaster statistics.
Therefore, this analysis focused on the number of intrusions in the land area.
(1) Using the
nuclear density algorithm, the intensity level value was recorded as the assignment
field and the radius of the seven wind circles was set as the search radius.
The nuclear density analysis was performed by iterating each TC best-track
point to calculate its influence. After the iterative calculation was completed,
the density results of all waypoints were superimposed to obtain the impact
results of tropical cyclone disasters based on intensity grade values. Finally,
the disaster impact analysis results were divided into regions and the spatial
distribution of tropical cyclone disaster impacts in the sea area was obtained.
(2) Using the
iterative idea, the influence range of each TC best-track point was defined by
the radius of the 7-level wind circle, the spatial unit within the range was
considered to be disturbed once, the number of intrusions of each spatial unit
within the land range was counted, and the cumulative number of intrusions of
each spatial unit from 1980 to 2022 was obtained.
3.3 Technical Routes
The
establishment process of this dataset is shown in Figure 3, which includes: (1)
data preprocessing; (2) dataset operation (visualization of TC best-track
points, tropical cyclone disaster risk level in the Western North Pacific
basin, and cumulative number of tropical cyclone intrusions in China); and (3)
data accuracy verification.
First, Python was used to conduct data
pre-processing, including invalid record elimination,
|
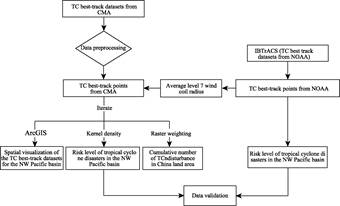
Figure
3 Technical flow
chart of the spatial risk assessment dataset of tropical cyclone disasters in
the Western North Pacific basin
(Notes:
TC, tropical cycle; CMA, China Meteorological Administration; NOAA, National
Oceanic and Atmospheric Administration)
|
data format correction, and attribute information classification.
Second, the text format data was transformed into an SHP format for processing in ArcGIS according to latitude and
longitude coordinates. Values were assigned according to the intensity
category, and points weaker than TD or with an unknown grade were deleted. For
best-track points in a denatured state, the corresponding intensity category
value was assigned based on the central maximum wind speed. Finally, the
TC best-track point assignment table was obtained, as shown in Table 2.
Table 2 The assigned tropical cycle best-track
points
|
Tropical
cyclone strength grade
|
2-min
average wind speed (m/s)
|
assignment
|
|
Tropical
depression (TD)
|
10.8?C17.1
|
1
|
|
Tropical
storm (TS)
|
17.2?C24.4
|
2
|
|
Severe
tropical storm (STS)
|
24.5?C32.6
|
3
|
|
Typhoon
(TY)
|
32.7?C41.4
|
4
|
|
Strong
typhoon (STY)
|
41.5?C50.9
|
5
|
|
Super
typhoon (Super TY)
|
??51.0
|
6
|
In addition, the
influence range of the cyclone point is necessary for algorithm processing.
However, the tropical cyclone attribute information recorded by the CMA does
not contain the wind coil radius; therefore, this study used the average wind
coil radius from the International Best Track Archive for Climate Stewardship
(IBTrACS) dataset, recorded by the National Marine Atmospheric Administration
(NOAA), as the influence range of the best-track point. The statistical results
are presented in Table 3.
Table 3 Average
level 7 wind coil radius of tropical cyclones during different intensity levels
|
Tropical
cyclone strength grade
|
2-min
average wind speed (m/s)
|
Average
level 7 wind coil radius (km)
|
|
Tropical
depression (TD)
|
10.8?C17.1
|
180
|
|
Tropical
storm (TS)
|
17.2?C24.4
|
220
|
|
Severe
tropical storm (STS)
|
24.5?C32.6
|
280
|
|
Typhoon
(TY)
|
32.7?C41.4
|
325
|
|
Strong
typhoon (STY)
|
41.5?C50.9
|
362
|
|
Super
typhoon (Super TY)
|
??51.0
|
376
|
Finally, the TC best-track datasets for the
Western North Pacific basin were characterized in different colors according to
different intensity levels to visualize the TC best-track datasets between 1980
and 2022.
Risk level of tropical cyclone disasters in the Western North
Pacific basin: To create a continuous grid surface
with a spatial resolution of 20 km, each best-track point was iterated and the
kernel density within the radius of a class 7 wind circle was interpolated. The
grid surfaces created above were superimposed individually to obtain the
results of the tropical cyclone disaster risk assessment in the Northwest
Pacific basin. The natural breakpoint method was used to classify the results.
The higher the value, the more severely the region has been affected by
tropical cyclones over the historical period.
Cumulative
number of tropical cyclone disturbances in China??s land area: First, the radius of seven wind circles was taken as the influence
range of tropical cyclones, and the tropical cyclone best-track points were
iterated successively to create the influence range buffer of each cyclone path
point. A space unit in a buffer zone is considered to be affected by one
tropical cyclone.
The
core value of this dataset was to effectively distinguish the different spatial
risks of tropical cyclone disasters; therefore, the risk level of each spatial
unit is the key to evaluating the accuracy and validity of this dataset. Hence,
the TC best-track datasets for the western North Pacific basin from two
different data sources, CMA and NOAA, were used to conduct a spatial risk
assessment of tropical cyclone disasters and to compare the correlation of the
two results and the distribution of high and low values. By calculating the
Pearson correlation coefficient of the two results, we can judge the
correlation between the two analysis results and further test the relative
trend of the two results to determine whether there is a consistent
distribution between them and then verify the accuracy of the spatial partition
of the risk level.
4 Data Results and Validation
4.1 Data Composition
This
dataset consisted of three data files, titled the ??Tropical cyclone statistics
for the Western North Pacific basin??, the ??Risk level of tropical cyclone
disaster in the Western North Pacific basin??, and the ??Cumulative number of
tropical cyclone infestations in China??. The research scope of the data was
99??E?C160??E, 2??N?C52??N, within the Western North Pacific basin and China. The
spatial coordinate system used was the WGS 1984 Mercator Projection. The dataset
was archived in the .tif and .xls formats.
4.2 Data Products
A
total of 1,259 tropical cyclones were recorded in the Western North Pacific
basin between 1980 and 2022. Statistical information for each year is shown in
Figure 4, including the number of tropical cyclones occurring in that year and
the maximum 2-minute average near-center wind speed (MSW, m/s) at the tropical
cyclone point monitored in that year.
According to the results of the nuclear density
analysis, high levels of disaster are mainly located from the West Philippine
Sea to the Sea basin, Maria Trench, and South China Sea, and there is a trend
of decreasing influence from the Philippine Sea to the outer Pacific Ocean.

Figure 4 Statistics of the Western North Pacific
tropical cyclone (TC) from 1980 to 2022
(According to the TC
best-track datasets for the western North Pacific basin. Note: Individual
missing records were not included in the statistics)
The kernel
density analysis can specify the meaning of the values of the output grid divided
into density (where the output value represents the density value per unit area
of the space unit) and expected count (where the output value represents the
density value of the space unit). In this dataset, the value of each grid pixel
in the figure represents the fact that the density intensity of the 20 ?? 20 km
space unit was affected by tropical cyclone disasters from 1980 to 2022, and
the unit of analysis result was scored per square kilometer (a score of 1?C6,
according to the above assignment of the grid cell).
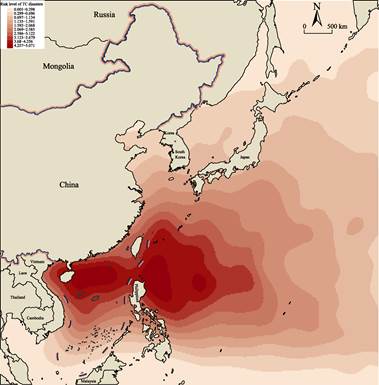
Figure
5 Risk level of
tropical cyclone disasters in the Western North Pacific basin
From
the perspective of number of disasters, the number of tropical cyclone
disasters in the area around China shows a hierarchical structure that
gradually decreases from southeast coastal areas to inland areas. First, the
Hainan province and the Leizhou Peninsula area in Guangdong province were
affected by more than 150 tropical cyclones between 1980 and 2022,
significantly impacting production and life, particularly offshore aquaculture
operations. Second, the Taiwan province and western Guangdong province were
affected by more than 125 tropical cyclones, while the central and southern
coastal areas of Guangdong province and southern Guangxi were affected by more
than 100 tropical cyclones. Additionally, the coastal areas of Fujian province
and southern Zhejiang region are also key areas affected by disasters, with
tropical cyclones causing serious ecological damage and economic losses to
fishery breeding and marine development.

Figure
6 Cumulative number
of tropical cyclone disturbance in China land area
4.3 Data Validation
The
China Meteorological Administration is an authoritative weather forecasting
agency. Each data source was carefully screened and compared to ensure
accuracy. Simultaneously, the IBTrACS dataset provided by the National Oceanic
and Atmospheric Administration (NOAA)
was integrated the TC best-track datasets, which were published by several tropical
cyclone monitoring agencies worldwide to help meteorologists understand the
distribution, frequency, and intensity of tropical cyclones around the world.
Therefore, by using the same nuclear density spatial analysis to deal with the
tropical cyclone data of the two authoritative sources, we can measure the
spatial distribution of the risk levels in the two analysis results, compare
the differences between the two results from the data correlation and relative
change trend, and evaluate the accuracy of the dataset in this study.
First, through
data preprocessing, nuclear density analysis, and statistical analysis of the
IBTrACS dataset, the spatial distribution of tropical cyclone disaster levels
can be established. Second, by combining the above results with the risk level
of spatial assessment results in the CMA dataset, the analysis results of the
two were analyzed by grid values. By calculating the Pearson correlation coefficient,
a high positive correlation of 0.995 was found between the two datasets. The
positive correlation coefficient also indicated that the spatial change trend
of the disaster level analyzed by the two data sources was consistent.
Table
4 Correlation
analysis of tropical cyclone disaster levels based on China Meteorological Administration
and NOAA
|
|
China
Meteorological Administration
|
The
National Oceanic and Atmospheric Administration
|
|
China
Meteorological Administration
|
1
|
0.995
|
|
The
National Oceanic and Atmospheric Administration
|
0.995
|
1
|
5 Discussion and Conclusion
Based
on the TC best-track datasets for the Western North Pacific basin set of the
CMA and combined with the life cycle and movement trajectory, this dataset was
analyzed using GIS, Python, and other big data methods to determine the impact
of tropical cyclone disasters in the Western North Pacific basin and Chinese
lands from 1980 to 2022. The results show that: (1) the Philippine Sea and
South China Sea were most severely affected by tropical cyclone disasters and
have the highest risk level; (2) the cumulative disturbance of tropical cyclone
disasters in China showed a decreasing spatial distribution from the southeast
coast to the Western North inland, and Hainan province, Leizhou Peninsula of
Guangdong province, and Taiwan were most affected by tropical cyclone disasters
from 1980 to 2022. In addition, this dataset used the IBTrACS dataset recorded
by the National Oceanic and Atmospheric Administration as control data in
conducting the spatial analysis of tropical cyclone disasters occurring in the
same region during the same period. The Pearson correlation coefficient of the
two results was 0.995, indicating the robustness of the results for this
dataset.
Compared with
the previous datasets for the analysis of tropical cyclone disasters, this
dataset accounted for tropical cyclone samples on a longer time scale. It
evaluated the spatial risk distribution of tropical cyclone disasters based on
the intensity level and used an average of seven wind circle radii as the
influence range. This approach can more accurately identify disaster risks in
various regions, thereby helping to formulate relevant disaster prevention and
mitigation measures. The application scenarios of this dataset mainly include:
(1) It can assess the
disaster risk of far-reaching marine aquaculture and fishing: if applied to
far-reaching marine aquaculture. By analyzing the historical disaster situation
of the spatial unit to judge its potential disaster risk, delimiting the scope
of breeding becomes relatively easy. Moreover, planning the breeding category
and the production efficiency of far-reaching marine aquaculture will also be
effectively improved by avoiding aquaculture activities in high-risk areas. If
applied to the construction of modern marine pasture, by providing knowledge of
historical disasters of the sea area and quantitative evaluation of the
regional disaster level, it can provide a scientific reference basis for site
selection of modern marine pasture, to achieve sustainable development. (2) The
dataset can serve the route layout of offshore shipping, offshore wind power
and offshore oil and gas site planning. For example, in the waterway route of
ships, it can consider the disaster risk level of the sea area to reasonably
avoid the high level areas with the impact of cyclone disaster. When selecting
the site of the operation scope of offshore oil fields, the corresponding
production mode should be formulated according to the disaster risk level and
the possible disaster damage. This approach can reduce the losses to the
production of oil and gas fields. (3) The dataset can be used to develop early
warning of disaster risks and marine environment monitoring of marine emergency
activities. It can also be used to provide scientific data support for the establishment
of marine environment monitoring systems or early warning information
platforms. It could help promote the protection of marine ecological
environments and motivate the high-quality development of marine economies. (4)
The dataset can serve in the development planning of coastal cities. Coastal
cities can reasonably delimit spatial functional zoning and plan industrial
layouts based on the number of tropical cyclone intrusions in regions within
the cities.
Author Contributions
Tong,
J. Y. collected and processed the data and wrote the paper. Wu, Q. T. designed
the algorithms for the dataset and guided the writing of this paper. Qian, Q.
L. provided ideas for the data verification.
Conflicts of Interest
The authors declare
no conflicts of interest.
References
[1]
The State Council of the PRC.
Notice of the State Council on issuing the 14th Five-Year Plan for the national
emergency response system [J]. Gazette of
the State Council of the People??s
Republic of China, 2022(6): 30?C48.
[2]
Zhu, H. M., Lin, G. F., Zhang,
M. F., et al. Construction of
typhoon disaster chain knowledge graph based on disaster risk survey knowledge
base [J/OL]. Journal of Catastrophology, 2023. http://kns.cnki.net/kcms/
detail/61.1097.p.20230802.1805.008.html.
[3]
Wang, L., Lu, Y., Zhao, H. K.
Analysis of temporal and spatial characteristics of typhoon disasters and construction
of evaluation model [J]. Journal of Catastrophology, 2023, 38(4):
187?C194.
[4]
Sun, X. X. Risk assessment and
analysis of the gravity net cage based on machine learning [D]. Dalian: Dalian
university of technology, 2020.
[5]
Zhu, J., Lu, Y., Li, G. P., et
al??Risk
assessment of typhoon disasters in fujian province of each county [J]. Journal
of Catastrophology, 2017, 32(3): 204?C209.
[6]
Wei, Z. J., Ma, H. L., Tang, D.
L. Trend assessment of typhoon disasters based on the improved entropy method
[J]. Journal of Catastrophology, 2017, 32(3): 7?C11.
[7]
Lin,
P. Y., Lin, P. H., Wang, J., et al. Typhoon disaster risk assessment and
dynamic risk forecasts in Zhejiang province based on machine learning methods
[J]. Journal of Natural Disasters, 2023, 32(4): 13?C24.
[8]
Bao, W. X., Gong, A. D., Xu,
C., et al. Typhoon disaster risk assessment in Guangdong province by
regional disaster system theory: case of ??Mangkhut?? [J]. Journal of Beijing
Normal University (Natural Science),
2023, 59(1): 94?C103.
[9] Tong, J. Y., Wu, Q. T., Qian, Q. L. Dataset of risk assessment of
tropical cyclone on the Northwest Pacific (1980?C2022) [J/DB/OL]. Digital
Journal of Global Change Data Repository, 2024. https://doi.org/10.3974/
geodb.2024.01.04.V1. https://cstr.escience.org.cn/CSTR:20146.11.2024.01.04.V1.
[10]
Ming, Y., Wei, Z., Hui, Y., et
al. An overview of the China Meteorological Administration tropical cyclone
database [J]. Journal of Atmospheric and Oceanic Technology, 2014,
31(2): 287?C301.
[11]
Lu, X. Q., Yu, H., Ying, M., et
al. Western North Pacific basin tropical cyclone database created by the
China Meteorological Administration [J]. Advances in Atmospheric Sciences,
2021, 38(4): 690?C699.
[12]
Yang, M. Q., Chen, G. M.,
Zhang, X. P., et al. Verification on typhoons forecasts over the Western
North Pacific and the South China Sea in 2021 [J]. Meteorological Monthly,
2023, 49(8): 1005?C1019.
[13]
Wang, X. X. Comparative
analysis on typhoon center location methods based on multi-source satellite
data [D]. Beijing: National Marine Environmental Forecasting Center, 2020.
[14]
GCdataPR Editorial Office.
GCdataPR data sharing policy [OL]. https://doi.org/10.3974/dp.policy.2014.05
(Updated 2017).
[15]
China Meteorological
Administration. Grade of tropical cyclones (GB/T 19201?C2006) [S]. Beijing:
National public service platform for standards information, 2006.