Statistics and Analysis of the Global Change
Research Data Publishing & Sharing (2018)
Shi, R. X. Ma, J. H. Liu, C.* Zhang, Y. H. Wang, Z. X. Shen, Y.
Institute of Geographic Sciences and Natural Resources Research, Chinese Academy of Sciences, Beijing 100101, China
Abstract: The Global Change Research Data Publishing & Repository (GCdataPR) has been established for five years (2014–2018). The achievements of the GCdataPR are summarized in this paper with respect to each of the datasets, data authors, data-related discovery papers, data sharing and data impact score (DIS). The communication and progress of the capacity building program on global change research data publishing & sharing in 100 universities is also summarized. Based on the above, this paper analyzed the data development trend and discussed the problems and challenges in data publishing. Results showed that 168 datasets covering 8 issues were published in GCdataPR in 2018, including 3,916 data files (277 compressed files). The online data size is 42.49 GB (13.31 GB compressed). Regarding the areas covered by the dataset, 4 datasets are on a global scale, 3 are trans-continental and 125 (74.40% of the total) are Asian. A total of 278 dataset authors are newly included in GCdataPR in 2018, mainly from China. Among the published datasets, 43 are directly related to data papers, and 94 research or discovery papers are directly related to datasets. There are a total of 4,750 new computer IP users, 17,147 times of downloads with data size of 836.87 GB in 2018. The total number of dataset citations is 167 in 2014–2018, with a mean annual citation of 33. The DIS is 344.43, with a mean impact factor of 2.06 for journals citing the datasets. The datasets are cited 43 times in 2018 by authors of academic journals, higher than the mean value in the past five years. The DIS of the datasets in 2018 is 138.73, and the mean annual impact factors of journals citing the datasets is 3.27, higher than the mean impact factor of 1.17 during the past five years. In 2018, GCdataPR was awarded the WSIS Prize 2018 (e-Science Champion), the honor of Leading Scientific and Technological Achievement—Nominated Outstanding Project at China International Big Data Expo, and the Innovation Project in the 8th China Digital Publishing Expo.
Keywords: global change; data publishing; annual summary; achievement analysis; 2018
1 Introduction
The year 2018 is the fifth year since Global Change Research Data Publishing & Repository (GCdataPR) was established and the year when the General Office of the State Council of P. R. China issued the Regulation of Scientific Data Management (Guo Ban Fa [2018] No. 17). In this regulation, the article No. 22 stipulates that competent departments and legal entities should actively promote the publication and dissemination of scientific data and support scientific researchers in collating and publishing scientific data with clear property rights that are accurate and complete, and that possess a high sharing value[1]. The GCdataPR was a pioneer in China in research data publishing and sharing, which was awarded the 2018 World Summit on the Information Society (WSIS) Prize (e-Science Champion) in March 2018[2], the Leading Scientific and Technological Achievement: Nominated Outstanding Project at China International Big Data Expo. in May 2018, and the Innovation Project Award at the 8th China Digital Publishing Expo. in July 2018[3].
As an Regular Member of the World Data System (WDS) of International Science Council (ISC) and National Earth Observation Data Publishing Center of China[4], GCdataPR has published 511 datasets on 25 issues developed by 845 authors from 12 countries (international organizations), with a data size of 1.05 TB (223 GB after compression), up to 31 December 2018. To generate publicity, ensure transparency, and make the academic community clearly understand the progress of data publishing and sharing, according to items 68 and 69 of “Guidelines of Global Change Research Data Publishing & Repository”[5], in August 2018, the Geographical Society of China released the “Global Change Research Data Publishing & Sharing Rankings”[6] as part of the 2018 China Conference on Geography. The conference included institution ranking, foundation ranking, research paper publishing journals ranking, browsed dataset ranking, downloaded dataset ranking, data product scientific impact ranking, and author scientific impact ranking. This paper summarizes the data publishing work in 2018 from the perspective of datasets, dataset authors, dataset foundations, dataset related papers, data sharing, data impact scores, and the Capacity Building in 100 Universities Program on Global Change Research Data Publishing & Sharing.
2 Statistics and Analysis of Published Datasets
2.1 Published Datasets
A total of 168 datasets were published in 8 issues in 2018 (Table 1), 85 datasets (4 issues) more than those published in 2017[7]. In 2018, there were 3,916 data files published in total, compressed into 277 data file packages. The compressed data file packaging rate was 14.14, and the total data size was 42.49 GB (13.31 GB after compression), with a data compressing rate of 3.19.
2.2 Geographical Regions Covered by the Datasets
Four datasets are on a global scale, accounting for 2.38% of the total (168 datasets), and 3 datasets are trans-continental, accounting for 1.79% of the total (Table 2). Datasets covering Asia constituted the greatest proportion (125 datasets), accounting for 74.40% of the total. Among them, 96 datasets covered China, accounting for 76.8% of the Asian datasets and 57.14% of the total published in 2018. Twenty-two datasets covered North America, accounting for 13.10% of the total. The number of datasets covering Africa, Europe, Latin America, Oceania, and Polar Regions were 3, 2, 2, 1, and 2, respectively. In addition, there were 4 datasets involving data technologies and methods.
Table 1 Statistics of datasets published and archived in GCdataPR in 2018
|
Year/Month
|
Number of issues
|
Number of datasets
|
Number of data files
|
Number of
compressed data
packages
|
Data size
(GB)
|
Compressed
data size (GB)
|
|
2018.01–02
|
1
|
28
|
644
|
69
|
28.39
|
11.84
|
|
2018.02–03
|
1
|
20
|
300
|
40
|
0.12
|
0.04
|
|
2018.04–05
|
1
|
20
|
1,076
|
32
|
0.34
|
0.06
|
|
2018.06–07
|
1
|
20
|
322
|
28
|
0.04
|
0.01
|
|
2018.08–09
|
1
|
20
|
807
|
30
|
0.55
|
0.38
|
|
2018.10–11
|
1
|
20
|
228
|
21
|
4.51
|
0.16
|
|
2018.11
|
1
|
20
|
149
|
25
|
7.56
|
0.69
|
|
2018.12
|
1
|
20
|
390
|
32
|
0.98
|
0.13
|
|
Total in 2018
|
8
|
168
|
3,916
|
277
|
42.49
|
13.31
|
|
Total during 2014–2018
|
25
|
511
|
397,942
|
1,503
|
1,070.62
|
222.41
|
|
Table 2 Statistics of geographical regions covered by
published datasets.
|
Covering region
|
Number
of datasets
|
Percentage (%)
|
|
Global
|
4
|
2.38
|
|
Trans-continental
|
3
|
1.79
|
|
Asia
|
125
|
74.40
|
|
Europe
|
2
|
1.19
|
|
North America
|
22
|
13.10
|
|
Latin America
|
2
|
1.19
|
|
Oceania
|
1
|
0.60
|
|
Africa
|
3
|
1.79
|
|
Polar regions
|
2
|
1.19
|
|
Methods
|
4
|
2.38
|
|
Total
|
168
|
100
|
Table 3 Statistics of domain of published dataset.
|
|
Discipline
|
Number of datasets
|
Percentage (%)
|
|
Terrestrial
|
Water
|
33
|
19.64
|
|
Land
|
15
|
8.93
|
|
Ecology/Biology
|
34
|
20.24
|
|
Atmosphere
|
16
|
9.52
|
|
Geology and Geophysics
|
11
|
6.55
|
|
Disaster
|
7
|
4.17
|
|
Humanity/Economics
|
14
|
8.33
|
|
Oceanic
|
Ocean (including Ocean/
Coastal zone/Islands
|
36
|
21.43
|
|
Others
|
Culture/Art
|
2
|
1.19
|
|
Total
|
|
168
|
100
|
|
2.3 Published Datasets by Discipline
The datasets published in GCdataPR covered a wide range of disciplines, including geography, resources, ecology, environment, atmosphere, ocean, land, plants, water, social economy, culture, art, and history (Table 3). As shown in Table 3, there were 130 datasets about terrestrial regions (77.38%); 36 datasets about oceans, including deep sea areas, shallow sea areas, polar regions, coastal areas, and islands (21.43%); and 2 datasets about culture and art (1.19 %).
Among the terrestrial datasets (130), there were 33 datasets about water (rivers, lakes, and wetlands), accoun-
ting for 19.64% of the total, and 15 datasets about land (including land cover and land use), accounting for 8.93% of the total. The datasets in ecology and biology constituted the highest proportion (34 datasets, 20.24%). There were 16 datasets in atmosphere (including weather and climate), accounting for 9.52%, 11 in geology and geophysics (6.55%), 7 in disaster (4.17%), and 14 datasets in humanity and economics (8.33%).
2.4 Data Levels
All datasets were archived into levels 0-5, each according to its stage in the developmental procedures[7]. Specifically:
Level 0 (L0): Raw data or signals from sensor or observer;
Level 1 (L1): Output of L0 after geometric and radiometric correction;
Level 2 (L2): Output of L1 integrated with new intelligence input;
Level 3 (L3): Output of L1/L2 integrated with new intelligence input;
Level 4 (L4): Output of L1/L2/L3 integrated with new intelligence input;
|
Table 4 Summary of dataset in production level
|
Data pro-
duct level
|
Datasets
|
Percentage (%)
|
|
2
|
144
|
85.71
|
|
3
|
21
|
12.50
|
|
4
|
3
|
1.79
|
|
Level 5 (L5): Output of L1/L2/L3/L4 data integrated with new intelligence, usually a time-series, or global scale.
Based on the above criteria, 168 datasets published in 2018 were categorized into three production levels (Table 4): 85.71% of the datasets were in level 2, 12.50% of them were in level 3, and only 1.79% of the datasets were in level 4.
3 Dataset Author(s)
3.1 Dataset Author(s)
Up to December 31 2018, there were 845 dataset authors, 278 authors more compared to that at the end of 2017[7].
|
Table 5 Statistics of author teams and their dataset
|
Number of authors in one dataset
|
Number of Datasets
|
Percentage (%)
|
|
1
|
18
|
10.71
|
|
2–5
|
130
|
77.38
|
|
≥6
|
20
|
11.90
|
|
3.2 Dataset Author Groups
Among the 168 datasets, only 18 datasets (10.71%) were developed by a single author, 130 datasets (77.38%) by a team of 2–5 persons, and 20 datasets (11.90%) by a team of more than 6 persons (Table 5).
3.3 Statistics of Chinese Authors by Affiliation and Region
3.3.1 Datasets Authors by Affiliation (Institutes or Universities)
Table 6 presents the affiliations of dataset authors. Most of author affiliations are from the Chinese Academy of Sciences and universities belonging to the Ministry of Education of P. R. China. Although most datasets were developed by a single department, 47 datasets (27.98%) were done by cross-departmental cooperation, 4.95% higher than in 2014–2017.
3.3.2 Chinese Authors by Region (Province, Municipality, Autonomous Region)
The distribution of dataset authors from China is shown in Table 7. Authors from Beijing constituted the highest proportion, publishing 116 datasets, accounting for 69.05% of the total datasets. Authors from Shandong, Jiangsu, and Qinghai all contributed 10–20 datasets; most provinces published less than 10 datasets. A total of 41 datasets were developed by trans-province authors, accounting for 24.40% of the total, 7.2% higher than in 2014–2017.
Table 6 Statistics of dataset author affiliations
|
Organization
|
Number of Datasets
|
Organization
|
Number of Datasets
|
|
Chinese Academy of Sciences
|
114
|
General Administration of Customs, P. R. China
|
1
|
|
Ministry of Education of P. R. China
|
78
|
China Earthquake Administration
|
1
|
|
China Meteorological Administration
|
7
|
Ministry of Ecology and Environment of P. R. China
|
2
|
|
Province
|
4
|
Chinese Academy of Social Sciences
|
1
|
|
National Geomatics Center of China
|
3
|
Total
|
215
|
|
Ministry of Natural Resources of P. R. China
|
2
|
Data published
|
168
|
|
Ministry of Ecology and Environment of P. R. China
|
2
|
Dataset developed by cross-department
|
47
|
|
Ministry of Science and Technology of P. R. China
|
1
|
Percentage
|
27.98%
|
Table 7 Statistics of Chinese authors by region
|
Region
|
Number of Datasets
|
Region
|
Number of Datasets
|
Region
|
Number of Datasets
|
Region
|
Number of Datasets
|
|
Beijing
|
116
|
Anhui
|
4
|
Gansu
|
2
|
Inner Mongolia
|
1
|
|
Shandong
|
13
|
Guizhou
|
4
|
Xinjiang
|
1
|
Hainan
|
1
|
|
Jiangsu
|
12
|
Sichuan
|
3
|
Ningxia
|
1
|
Chongqing
|
1
|
|
Qinghai
|
10
|
Shanghai
|
4
|
Shanxi
|
1
|
|
|
|
Guangdong
|
9
|
Jilin
|
2
|
Hebei
|
1
|
|
|
|
Hubei
|
7
|
Zhejiang
|
2
|
Total
|
216
|
|
Henan
|
6
|
Guangxi
|
2
|
Dataset published
|
168
|
|
Shaanxi
|
5
|
Jiangxi
|
2
|
Dataset developed by trans-provinces
|
41
|
|
Liaoning
|
4
|
Hunan
|
2
|
Percentage
|
24.40%
|
3.4 Statistics of Datasets by Founding Agencies
|
Table 8 Statistics of foundation supporting the dataset
|
Foundation
|
Number of Datasets
|
Percentage (%)
|
|
No fund
|
14
|
8.33
|
|
One fund
|
58
|
34.52
|
|
More than one fund
|
96
|
57.14
|
|
Total
|
168
|
100
|
|
Most datasets were developed with foundations (Table 8), accounting for 91.67% of the total. Notably, 8.33% of the datasets were developed by self-support, 34.52% of the datasets were funded by one funding project, and 57.14% of the datasets were funded by two or more funding projects, which usually had a large amount of data, broad coverage, and long time-series.
There were 344 funding projects (sub-projects) in the 168 published datasets. Among them, 116 projects (33.72%) were from the Natural Science Foundation of China, 78 (22.68%) from the Ministry of Science and Technology of P. R. China, 35 (10.17%) from the Chinese Academy of Sciences, and 104 projects (30.23%) from provincial or company support (Table 9).
4 Association of Datasets, Research or Discovery Papers, and Data Papers
There are two kinds of papers associated with a dataset: a data paper and a research or discovery paper. In 2018, there were 94 research papers associated with the published datasets (Table 10). In the Journal of Global Change Data & Discovery, there were several columns, such as data policy and strategy, data technology, data computing environment, data paper, data encyclopedia, and reports on outreach and capacity building. In 2018, 84 papers were published in total, including 43 data papers, 2 papers on data technology, 2 on data impact scores, 2 on publishing standards, 3 on data calculation environments, 21 on global change data encyclopedia, 10 on academic activities, and 1 paper on data tool updates.
Table 9 Statistics of funding projects supporting datasets development and publishing
|
Foundations
|
Number of funding projects
|
Percentage (%)
|
Foundations
|
Number of fund-
ing projects
|
Percentage (%)
|
|
National Natural Science Foundation of China
|
116
|
33.72
|
National Social Science Fund of China
|
3
|
0.87
|
|
Province/Company
|
104
|
30.23
|
Ministry of Natural Resources of P. R. China
|
1
|
0.29
|
|
Ministry of Science and Technology of P. R. China
|
78
|
22.68
|
National Development and Reform Commission
|
1
|
0.29
|
|
Chinese Academy of Sciences
|
35
|
10.17
|
Ministry of Transport of P. R. China
|
1
|
0.29
|
|
Ministry of Education of P. R. China
|
5
|
1.45
|
Total
|
344
|
100.00
|
5 Statistics of Data Sharing
|
Table 10 Statistics of datasets with its information
|
Year
|
Dataset
|
Data paper
|
Original research paper
|
Total
|
|
2014–2017
|
343
|
77
|
119
|
196
|
|
2018
|
168
|
43
|
94
|
137
|
|
Total
|
511
|
120
|
213
|
333
|
|
Table 11 shows the statistic of data sharing from the perspective of an annual and accumulated basis. More than 1,330,000 users visited the GCdataPR website. Through over 40,000 IPs, data were downloaded more than 140,000 times (using 0:00 Beijing Time as a baseline, multiple downloads of the same data file within 24 hours by the same IP address were recorded as one download). The download data size (after compression) was more than 3.5 TB, and as shown in Table 11. The number of data users (IP) and the downloaded data file size from the GCdataPR increased year-on-year.
Table 11 Statistics of data sharing through the GCdataPR*
|
Year
|
Visitors
|
Accum.
visitors
|
New data
users (IP)
|
Accum. data users (IP)
|
Data files
downloaded
|
Accum. data
file downloaded
|
Data size downloaded (GB)
|
Accum. data size downloaded??GB??
|
|
2014
|
332,846
|
332,846
|
174
|
174
|
822
|
822
|
25.79
|
25.79
|
|
2015
|
124,668
|
457,514
|
9,764
|
9,938
|
23,726
|
24,548
|
976.11
|
1,001.90
|
|
2016
|
339,870
|
797,384
|
10,701
|
20,639
|
47,867
|
72,415
|
703.31
|
1,705.21
|
|
2017
|
83,434
|
880,818
|
16,158
|
36,797
|
53,493
|
125,908
|
970.49
|
2,675.70
|
|
2018
|
454,976
|
1,335,794
|
4,750
|
41,547
|
17,147
|
143,055
|
836.87
|
3,512.57
|
*Data during the 2014–2017 is from reference [4].
6 Data Citation and Data Impact Score (DIS)
In 2018, evaluations of dataset citation and DIS were included in GCdataPR. Detailed information on evaluation methods and instructions can be found in references [8–9]. The datasets published in 2014–2018 were cited 167 times in total: 13, 8, 14, 89, and 43 times in 2014, 2015, 2016, 2017, and 2018, respectively. The DIS was 344.43 in 2014–2018, with 29.90 in 2014, 19.97 in 2015, 73.42 in 2016, 82.41 in 2017, and 138.73 in 2018 (Figure 1). Although there were no special situations such as citations by Nature in 2018 (the impact factor of Nature was 40 in 2016), the average impact factor of the journals citing the datasets was 1.17 higher than the mean of the past five years, showing an increasing trend year-on-year and reaching the highest number of citations and DIS, except in 2016 (Table 12). This indicates that data publishing, sharing, and citation played an increasingly important role in research, and that new methods of scientific research driven by data were already becoming established.
|
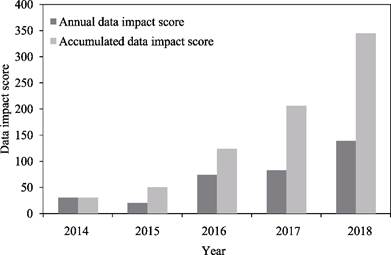
Figure 1 Annual and accumulated data impact score
|
7 Capacity Building in the 100 Universities Program on Global Change Research Data Publishing & Sharing
Data publishing is a relatively new method of making research widely available and many researchers are not familiar with how it operates. There are many issues relating to this venture, such as how to publish and how to share data. In order to address these issues and to promote the publishing and sharing of global change data using the fund from the Bureau of Science Communication, the Institute of Geographic Sciences and Natural Resources Research, Chinese Academy of Sciences (IGSNRR/CAS), and the Geographical Society of China organized the Capacity Building in 100 Universities Program on Global Change
Research Data Publishing & Sharing in 2017. On the basis of 9 meetings held in 2017, another 10 meetings were held in 2018 (Table 13). More than 1,300 researchers and students took part in the joint higher education program. Promoting global change research data
publishing and sharing in universities was one of several important actions in implementing the national big data strategy.
Table 12 Statistics of data citation and data impact score
|
Year
|
Number of citations
|
Data impact score (DIS)
|
Mean impact factor of journals citing the dataset
|
|
| |
|
2014
|
13
|
29.90
|
2.3
|
|
|
2015
|
8
|
19.97
|
2.50
|
|
|
2016
|
14
|
73.42
|
5.25
|
|
|
2017
|
89
|
82.41
|
0.93
|
|
|
2018
|
43
|
138.73
|
3.23
|
|
|
Total of 2014–2018
|
167
|
344.43
|
2.06
|
|
|
Mean of 2014–2018
|
33.4
|
68.89
|
2.06
|
|
|
Comparison between 2018 and the mean of 2014–2018
|
+9.6
|
+69.84
|
+1.17
|
|
8 Conclusion and Recommendations
In summary, the GCdataPR had a series of outstanding achievements in 2018. It initiated the new mechanism of digital integrated publishing of scientific data in both publishing and sharing in the global change field, a new type of academic journal in both Chinese and English for publishing and disseminating metadata, datasets, data papers, quantitative evaluation system of scientific data impact scores, combination modes of online dissemination and offline communication, and simultaneous dissemination in universities and in the United Nations. All these actions provide a reliable guarantee for the important progress of data publishing and sharing in 2018. The practice of the GCdataPR in 2018 showed that a coherent data innovation idea, rigorous data management rules, and strict data artisan spirit are three indispensable factors in data publishing and sharing activities oriented by scientific exploration and social needs.
Table 13 Statistics of the Capacity Building in 100 Universities Program on Global Change Research Data Publishing & Sharing in 2018 (Following the sessions in 2017)
|
Session
|
Date
|
Location
|
Institute
|
Theme
|
|
10
|
21 Apr.
|
Beijing
|
Beihang University
|
Spatial technology and global health
|
|
11
|
19 May
|
Wuhu
|
Anhui Normal University
|
Geography in the era of big data
|
|
12
|
20 May
|
Nanjing
|
Nanjing University
|
Big data geography
|
|
13
|
21 Jun.
|
Beijing
|
Chinese Center for Disease Control and Prevention
|
Scientific data publishing and sharing—understanding and implementation of national big data strategy
|
|
14
|
15 Sep.
|
Guangzhou
|
South China Normal University
|
Information technology promoting the evolution and innovation of geoscience
|
|
15
|
16 Sep.
|
Hangzhou
|
Zhejiang University
|
Artificial intelligence · Big data · Cloud computing promoting the innovational development of geography
|
|
16
|
19 Sep.
|
Shanghai
|
Tongji University
|
Quality and verification of geospatial data
|
|
17
|
19 Sep.
|
Katmandu
|
International Centre for Integrated Mountain Development, ICIMOD
|
Capacity building of data sharing in developing countries
|
|
18
|
20 Sep.
|
Guiyang
|
Guizhou Normal University
|
Geographic big data promoting the building of disciplines and beautiful homes
|
|
19
|
10 Oct.
|
Tianjin
|
National Marine Information Center of P. R. China
|
Exploration and case analysis of scientific publishing and sharing mechanism
|
There are still new challenges in the way forward in the practice of data publishing, including:
(1) Most researchers had an insufficient understanding on data publishing, so they were more inclined to publish a research paper rather than a dataset.
(2) Most researchers did not have a clear understanding of intellectual property rights, such as what kind of data could be cited, or what data belonged to others, or how to cite the data.
(3) Some of the datasets were not good in some cases, requiring, therefore, multiple rounds of peer review and revisions by authors.
(4) The coverage area of the published datasets is mostly originated in Asia; the global scale datasets were few.
(5) The data computing environment is a weak point in the big data uses.
The following recommendations are given:
(1) Expanding dissemination is needed by the editorial office and editorial board of the GCdataPR to further deepen the understanding by researchers of scientific data publishing and sharing, to deal effectively with the relationship between intellectual property rights protection and sharing, and to recognize the dual identity of dataset author and dataset user.
(2) Scientists need to take each data record seriously and strictly follow the related regulations, academic norms, and standards to develop the data.
(3) The data governance should be paid more attention by all of stakeholders, such as the data decision makers, data managers, founding agencies, research institutes, universities, data publishers and services, as well as data users, both end users and the value added provider services.
(4) The data author’s contribution to science in data publishing and sharing should be credited, when evaluating a researcher’s scientific achievements.
(5) Increasing dissemination and clarifying policy orientation, incentivizing authors from worldwide to take part in data publishing, and encouraging international cooperation on data publishing should be primary goals in future work.
(6) The research data computing environment should be emphasized. Although the Geographical Society of China has initiated the Excellent Cases on Data Analysis Environment[10–12] in 2018, more cases should be recognized in practical principles. Based on the possibilities inherent to technological culture and infrastructure, the development strategy of simultaneously adopting small-server computing environment and national or international big data cloud computing platform will works in both ways in most recently. Therefore, institutes or research teams are encouraged to adopt practice-oriented data computing environments, which are effective in avoiding investment waste on data computing platforms.
References
[1] Ministry of Science and Technology of P. R. China. The notice on printing and distributing ‘Regulation of Scientific Data’ [OL]. http://www.most.gov.cn/mostinfo/xinxifenlei/fgzc/gfxwj/gfxwj2018/201804/t2018 0404_139023.htm.
[2] Editorial Office of Journal of Global Change Data & Discovery. WSIS prize 2018 (e-Science champion) to the GCdataPR project [R]. Journal of Global Change Data & Discovery, 2018, 2(1): 1–6. DOI: 10.3974/ geodp.2018.01.01.
[3] Department of S&T Information Infrastructure, IGSNRR/CAS. Innovative project of digital publishing honors to the GCdataPR [R]. Journal of Global Change Data & Discovery, 2018, 2(3): 352–353. DOI: 10.3974/ geodp.2018.03.17.
[4] Liu, C., Guo, H. D., Uhlir, P. F., et al. GCdataPR: infrastructure for data publishing repository & sharing in/for/with developing countries [J]. Journal of Global Change Data & Discovery, 2017, 1(1): 3–11. DOI: 10.3974/geodp.2017.01.02.
[5] Editorial Office of Journal of Global Change Data & Discovery. Guidelines of global change research data publishing & repository [J]. Journal of Global Change Data & Discovery, 2017, 1(3): 253–261. DOI: 10.3974/geodp.2017.03.01.
[6] Geographical Society of China. Global change research data publishing & sharing rankings [R]. Journal of Global Change Data & Discovery, 2018, 2(3): 243–247. DOI: 10.3974/geodp.2018.03.01.
[7] Shi, R. X., Liu, C., Ma, J. H., et al. Statistics and analysis of global change research data publishing & sharing (2014–2017) [J]. Journal of Global Change Data & Discovery, 2017, 1(4): 383–390. DOI: 10.3974/geodp.2017.04.01.
[8] Liu, C. Data impact score (DIS)—a quantitative method of data performance to the data-driven sciences [J]. Journal of Global Change Data & Discovery, 2018, 2(2): 135–143. DOI: 10.3974/geodp.2018.02.02.
[9] Liu, C., Liao, X. H., Zhang, G. Y., et al. Analysis to the highest impact dataset 2018 from the Geographical Society of China [J]. Journal of Global Change Data & Discovery, 2018, 2(3): 249–255. DOI: 10.3974/geodp.2018.03.02.
[10] Liu, Q. H., Zhong, B., Tang, P., et al. Remote sensing data products oriented quantitative computing system—The GSC best practice data computing environment 2018 [J]. Journal of Global Change Data & Discovery, 2018, 2(3): 271–278. DOI: 10.3974/geodp.2018.03.03.
[11] Zhang, F., Bai, Y. A distributed spatial-temporal data model and online analyst system for marine environmental research—the GSC best practice data computing environment 2018 [J]. Journal of Global Change Data & Discovery, 2018, 2(3): 279–289. DOI: 10.3974/geodp.2018.03.05.
[12] Xue, B., Li, J. Z., Xiao, X., et al. A big-data-based platform for human-land relations analysis and application in urban areas—the GSC best practice data computing environment 2018 [J]. Journal of Global Change Data & Discovery, 2018, 2(3): 290–294. DOI: 10.3974/geodp.2018.03.06.