Dataset of
Cultivated Land in Vietnam Reconstructed from Historical Documents for the
Period 1500–2000 A.D.
Liu, H. L.1,2* Liu, X.1,2 He, F. N.1,2
1. Key Laboratory of
Land Surface Pattern and Simulation, Institute of Geographic Sciences and
Natural Resources Research, Chinese Academy of Sciences, Beijing 100101, China;
2. University of Chinese
Academy of Sciences, Beijing 100049, China
Abstract: The effective reconstruction of historical land use datasets is
of great importance for analyzing the process of long-term land cover changes,
diagnosing the mechanism of climate change, and evaluating the impact of human
activities. Aimed at Vietnam, which has lacked reconstructed results for
historical cultivated land area in the past, this paper takes The Atlas of World Population History, The World Economy: Volume 1: A
Millennial Perspective and Volume 2: Historical Statistics and International Historical Statistics: Africa, Asia & Oceania,
1750–1988 as the basic
population information, and obtains the total population at 16 key time points
between 1500 and 2000 A.D. by interpolation and fusion of historical documents.
Further, combined with data for paddy field area, the ratio of paddy
field area to cultivated land area, the grain ration standard, land tax systems, paddy field yields,
and ripening system, the process of change in cultivated land area was deduced
using two indicators of cultivated land area per capita and grain possession
per capita. The results showed that the cultivated land area of Vietnam has
shown an almost exponential upward trend over the past 500 years, with a slow
increase before 1850 A.D. and a rapid increase after 1850 A.D. Compared with
global datasets such as the History Database of the Global Environment
(HYDE) 3.2 and SAGE, the results of this paper not only have a certain
consistency but they also have greater temporal resolution (50 years), and are
more in line with the fluctuations in the natural environment and of the social
economy over historical periods.
Keywords: land use/cover change;
reconstruction of cultivated land area; historical documents; Vietnam
DOI: https://doi.org/10.3974/geodp.2022.03.04
CSTR:
https://cstr.escience.org.cn/CSTR:20146.14.2022.03.04
Dataset Availability Statement:
The dataset
supporting this paper was published and is accessible through the Digital Journal of
Global Change Data Repository at: https://doi.org/10.3974/geodb.2022.03.07.V1 or
https://cstr.escience.org.cn/CSTR:20146.11.2022.03.07.V1.
1
Introduction
Land use and cover change (LUCC) is considered to be one of
the significant drivers of global environmental change[1–3], among
which changes in cropland area is an important part of the study of past global
changes. Such changes profoundly affect the global and regional environment
through changes in the physical conditions of the land surface (i.e., surface
albedo, radiative forcing, evapotranspiration, and soil erosion) and the
biogeochemical cycle[4,5]. At present, LUCC research, using
reconstructed cultivated land data as its basis, has made remarkable progress,
forming the various global land use datasets represented by HYDE, KK10, SAGE,
etc.[6–10]. However, as the SAGE publisher has stated, the global
dataset is only applicable to global-scale studies, while its application to
the regional scale is subject to large uncertainties[9]. Further
assessment of the reliability of global historical LUCC datasets demonstrates
that the historical cropland data for Germany and China in the SAGE and HYDE
datasets cannot objectively reflect the total amount of land reclamation and
the spatial distribution characteristics of the two countries during specific
time periods[11–13], which greatly deviate from their ??true values??
in the historical past. Therefore, fully excavating regional historical
documents and natural records in order to reconstruct the LUCC process on a
regional scale is not only vital for the study of regional historical geography
but also an urgent need to improve global LUCC datasets.
At present, due to the long history of agricultural and
pastoral civilization and the relatively detailed and continuous historical
records, the eastern and southern regions of Asia, the Americas, and parts of
Africa have good conditions for regional land cover reconstruction research[14],
thus producing a large number of regional reconstruction results over a long
timescale[15–16]. However, the Indochina Peninsula, which also has a
long agricultural history, lacks accurate statistics for historical population
and cultivated land area due to its complicated political evolution, frequent
internal wars, and poor preservation of historical archives
in the region[17]. Therefore, the reconstruction of cultivated
land area in the Indochina Peninsula has not been carried out systematically
and thoroughly. This paper collects information on population, land use,
agriculture, and taxes from Vietnamese historical records, and constructs a
quantitative relationship between cultivated land area and population in
different historical periods, so as to reconstruct the changes of cultivated
land area during the past 500 years.
2 Metadata
of the Dataset
Table 1 lists the metadata information relating to the cultivated land area dataset in Vietnam based
on historical documentation (1500-2000) [18].
3 Methods
3.1 Data Sources
The source data used in the construction of this dataset included basic
information on four aspects, namely, population; paddy field (cultivated land)
area and ratio of paddy field area to cultivated land area; expenditure on
grain, including grain ration, public grain, and surplus grain; paddy yield and
farming system. Of these data sources, population data used The Atlas of World
Population History[20], The World Economy: Volume 1: A Millennial
Perspective and Volume 2: Historical Statistics[21] (hereafter referred
to as The World Economy), and International Historical Statistics: Africa, Asia
& Oceania, 1750–1988[22] (hereafter referred to as International
Historical Statistics) as the main data sources for different historical
periods.
Table1 Metadata summary of the Cultivated land
dataset in Vietnam based on historical documentation (1500-2000)
|
Items
|
Description
|
|
Dataset full name
|
Cultivated land dataset in
Vietnam based on historical documentation (1500-2000)
|
|
Dataset short name
|
CultivatedLandVietnam_1500-2000
|
|
Authors
|
Liu, H. L. HHM-8300-2022, Institute
of Geographic Sciences and Natural Resources Research, Chinese Academy of
Sciences, liuhl@igsnrr.ac.cn
Liu, X. GMW-7633-2022, Institute
of Geographic Sciences and Natural Resources Research, Chinese Academy of
Sciences, liuxian211@mails.ucas.ac.cn
He, F. N.
https://orcid.org/0000-0001-7743-6484, Institute of Geographic Sciences and
Natural Resources Research, Chinese Academy of Sciences, hefn@igsnrr.ac.cn
|
|
Geographical region
|
Vietnam
|
|
Data time period
|
1500–2000 A.D.
|
|
Temporal resolution
|
50 years for 1500–1800 A.D., 20–30 years for 1800–1900 A.D., 10 years for 1900–2000 A.D.
|
|
Data Formats
|
.xlsx
|
|
Data size
|
12.5 KB
|
|
Dataset components
|
Year, population, and national
cultivated land valuation
|
|
Foundation
|
Ministry of Science and
Technology of P. R. Chin (2017YFA0603304)
|
|
Data publisher
|
Global
Change Research Data Publishing & Repository, http://www.geodoi.ac.cn
|
|
Address
|
No. 11A, Datun Road, Chaoyang
District, Beijing 100101, China
|
|
Data sharing policy
|
Data from
the Global Change Research Data Publishing & Repository includes metadata, datasets
(in the Digital Journal of Global Change Data Repository), and
publications (in the Journal of Global Change Data & Discovery). Data sharing policy
includes: (1) Data are openly available and can be free downloaded via the
Internet; (2) End users are encouraged to use Data subject to
citation; (3) Users, who are by definition also value-added service
providers, are welcome to redistribute Data subject to written permission
from the GCdataPR Editorial Office and the issuance of a Data redistribution
license; and (4) If Data are used to compile new
datasets, the ??ten per cent principal?? should be followed such that Data
records utilized should not surpass 10% of the new dataset contents, while
sources should be clearly noted in suitable places in the new dataset[19]
|
|
Communication
and searchable system
|
DOI, CSTR, Crossref, DCI,
CSCD, CNKI, SciEngine, WDS/ISC, GEOSS
|
The paddy field (cultivated land) area and ratio of paddy field area to
cultivated land area in Vietnam in different time periods took the official
land census data for the feudal dynasty period (1500–1885 A.D.), the French
colonial period (1885–1954 A.D.), and the independence period (since 1954 A.D.)
directly recorded or reproduced from Da
Nan Unified History[23], International Historical Statistics, The World Bank: World Development Indicators[24]
(hereafter referred to as The World
Bank), Current Situation of
Vietnam under French Rule[25], Vietnamese Village Community
[26], and other documents as the main data sources.
In order to determine the data needed for the calculation of grain possession per capita in the feudal period of Vietnam, this paper used the amount of
grain payment and the corresponding populations of twelve provinces in Vietnam
during the Jialong period (1802–1819 A.D.) recorded in Da Nan Unified History to obtain the amount of public grain
payment per capita. However, the expenditure standard of grain rations and
surplus grain in the same period could not be obtained directly because of the
current condition of Vietnamese historical records. It was therefore determined
by referring to the relevant data for Chinese society[27], in view
of the fact that the Vietnamese ethnic group is relatively similar to that in
the area south of the Yangtze River in China, with similar physiques, food
preferences, and modes of agriculture.
As for the paddy yield in different historical periods, the yield of paddy
fields in 1930 A.D. during the French colonial period[25] was taken
to be the same as that in the feudal dynasty period, given that the traditional
small-scale farming mode continued to be used during the colonial period in
Cochin-China[28], and agricultural technology did not greatly
improve during the latter period. In addition, the crop cultivation system used
in Vietnam during the feudal dynasty period can be classified as biannual,
based on the common situation in densely populated areas of Southeast Asia in
the 16th century, as recorded in relevant research monographs[29].
Of the abovementioned basic data sources, The Atlas
of World Population History records the population growth, deaths, and
migrations in each country in each historical period, as well as an estimated
result for total population, which has been applied to the transformation of
the agricultural population growth pattern in early modern Britain[30].
The International Historical Statistics has collected and summarized the
statistical data for population, land, economy, trade, and other aspects of
most regions of the world since the latter half of the 19th century, which is
one of the few modern socioeconomic datasets in the world with a complete time
series by country. Prof. Angus Maddison, the author of The World Economy, is
recognized as the most authoritative expert on economic history data analysis
in the world. In his book, the results for economic analysis of historical data
and materials unearthed by scholars from various countries have been applied to
a historical comparison of the economic gap between China and the West[31]
and the history of low-carbon transition in Germany[32]. In
addition, the local gazetteer of Vietnam-Da Nan Unified History-is a precious
ancient source for the study of Vietnamese history and geography. This gazetteer
is well structured, top-to-bottom, and contains detailed information on
boundaries, divisions, establishment and evolution, division of jurisdiction,
climate, cities, household registration, land tax, and other information, and
is known as ??the most important historical material in the general gazetteers
of the Nguyen dynasty of Vietnam.??[33].
3.2 Technical Route
The construction of our dataset involved a two-part process: the data for
cultivated land area after 1950 A.D. were adopted directly from The World Bank,
while the data from 1500–1950 A.D. were reconstructed using the technical route
shown below in Figure 1, which is divided into four key technical links,
including the construction of population sequence, the calculation of paddy
field area or grain possession per capita, the accounting of the total area of
cultivated land, and the comparison and verification of the results.
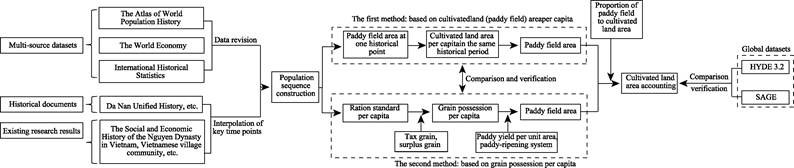
Figure 1 Technical
route for reconstructing cultivated land area in Vietnam between 1500 and 1950
A.D.
When constructing the population sequence for Vietnam, the population data
since 1500 A.D. in the three population datasets mentioned above were first
drawn as a graph (Figure 2). Through comparative analysis, it was found that
the degree of convergence and superposition for each set of data in different
periods was good, and was also in line with the population wave dynamics under
the influence of natural and socioeconomic factors in specific time periods,
which are described in The Social and Economic History of the Nguyen Dynasty in
Vietnam[17] (hereafter referred to as The Social and Economic
History of the Nguyen Dynasty). Therefore, the time-segment selection and
interpolated results for each population dataset are shown as follows: (1) the
population from 1500 to 1800 A.D. adopts the data with centennial resolution in
the same period The Atlas of
World Population History. However, as the temporal resolution of this
population data is low, this paper also interpolates the population values at
two key time points, 1550 and 1750 A.D., with the help of the population
declines caused by natural disasters and wars during the Nguyen Dynasty
described in The Social and Economic History of the Nguyen Dynasty. Based on
the average annual growth rate, the population in 1650 A.D. was estimated from those in 1600 and 1700 A.D.; (2) the
population from 1800 to 1921 A.D.
is based on the data for different time points in The Atlas of World Population
History and The World Economy; (3) the population from 1921 to 1950 A.D. is
based on the data for each time point in the same period contained in
International Historical Statistics and The World Economy.

Figure 2 Comparison of historical population
datasets from three sources in Vietnam for the period 1500 to 1950 A.D.
After constructing the historical population sequence, the two
reconstruction algorithms for cultivated land area used in different periods
were defined as follows:
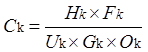
(1) The first algorithm is based on the cultivated land (paddy field) area
per capita, aimed at the reconstructed time points from 1500 A.D. to 1950 A.D.
The algorithm is given by Equation (1):
 (1)
(1)
where Ck is the total area of cultivated land in the
region, Hk is the population of the region, Pk
is the paddy field area per capita in the region, and Gk is
the ratio of paddy field area to cultivated land area in the region.
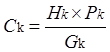
(2) The second algorithm is based on the method of grain possession per
capita, aimed at the reconstructed time points from 1500 A.D. to 1885 A.D. The
algorithm is given by Equation (2).
 (2)
(2)
where Ck, Hk, and Gk
are the same variables as defined in Equation (1), Fk is the
level of grain possession per capita in the region, Uk is the
paddy yield per unit area in the region, and Ok is
paddy-ripening system in the region.
4 Data Results and Validation
4.1 Data Composition
Dataset of cultivated land in
Vietnam reconstructed from historical documents (1500–2000
A.D.) is composed of a table, and the result is shown in Table 2.
4.2 Reconstructed
Results and Validation of Population Data
As can be seen from the reconstructed results (Figure 3), the population of
Vietnam has shown a fluctuating upward trend over the past 500 years: (1)
during the century from 1500 to 1600 A.D.,
the population first increased and then decreased, with an average annual
growth rate of 2.14??; (2) during the century from 1600 to 1700 A.D., the population showed a slow
growth trend, with an average annual growth rate of 1.92??; (3) during the
century from 1700 to 1800 A.D.,
the population first decreased and then increased, with an average annual
growth rate of 2.88??; (4) during the 50 years from 1800 to 1850 A.D., the population again showed a
trend of first increasing and then decreasing, with an average annual growth
rate of 8.14??; (5) during the century from 1850 to 1950 A.D., the population showed an exponential growth trend, with
an average annual growth rate of 14.51??.

Figure
3 Comparison of
reconstructed population results between those for the whole of Vietnam and the
north of the country from 1500 to 1950 A.D.
Table 2 Reconstructed dataset of cultivated land area in Vietnam
(1500–2000 A.D.)
|
Historical period
|
Year
|
Population
(??103)
|
Cultivated land area (103 hm2)
|
|
Reconstructed results based on cultivated land (paddy
field) area per capita
|
Reconstructed results based on grain possession per
capita
|
Statistical data[24]
|
|
Feudal
dynasty
|
1500
|
2,000[20]
|
350.69
|
365.27
|
-
|
|
1550
|
2,724
|
477.64
|
497.50
|
-
|
|
1600
|
2,476[20]
|
434.16
|
452.21
|
-
|
|
1650
|
2,725
|
477.89
|
497.76
|
-
|
|
1700
|
3,000[20]
|
526.04
|
547.91
|
-
|
|
1750
|
2,550
|
447.13
|
465.72
|
-
|
|
1800
|
4,000[20]
|
701.38
|
730.54
|
-
|
|
1820
|
6,313[21]
|
1,106.95
|
1,152.98
|
-
|
|
1850
|
6,000[20]
|
1,052.07
|
1,095.81
|
-
|
|
1870
|
10,146[21]
|
1,779.05
|
1,853.01
|
-
|
|
Colonial
period
|
1900
|
11,500[20]
|
2,827.87
|
-
|
-
|
|
1910
|
13,780[20]
|
3,388.52
|
-
|
-
|
|
1920
|
15,615[20]
|
3,839.75
|
-
|
-
|
|
1930
|
17,477[22]
|
4,297.62
|
-
|
-
|
|
1940
|
21,270[22]
|
4,576.54
|
-
|
-
|
|
1950
|
25,348[21]
|
5,453.98
|
-
|
-
|
|
Independent
period
|
1960
|
-
|
-
|
-
|
5,550.00
|
|
1970
|
-
|
-
|
-
|
5,630.00
|
|
1980
|
-
|
-
|
-
|
5,940.00
|
|
1990
|
-
|
-
|
-
|
5,339.00
|
|
2000
|
-
|
-
|
-
|
6,200.00
|
In order to verify the rationality of the
reconstructed results obtained in this paper, we also compared them with the
population change trend in northern Vietnam from 1500 to 1800 A.D., estimated from The Social and
Economic History of the Nguyen Dynasty, which is based on the number of
historical villages and communities (Figure 3). The result of the comparison
shows that the fluctuations in the two curves are consistent, and both show the
??two ups and two downs?? in the population development during the past 300
years. It should be pointed out that the population of northern Vietnam at each
time point estimated in The Social and Economic History of the Nguyen Dynasty
is much higher than the population of the whole country calculated in this
paper. In this regard, we believe that the estimated results contained in this
book remain to be discussed. This book also notes that the population of northern
Vietnam accounted for 55% of the total population of the country[17],
so it can then be calculated that the total population of Vietnam in 1730 A.D. was 11,766,000, which exceeded
that of 1900 A.D., which was
11,500,000. A lack of knowledge of the differences in the sizes of villages and
communities may be the reason for the incorrect estimated results obtained in The Social and Economic History of the
Nguyen Dynasty.
4.3 Reconstructed Results and
Comparison of Cultivated Land
4.3.1 Reconstructed Results
The reconstructed results for cultivated
land in Vietnam during the past 500 years based on cultivated land area per
capita are shown in Figure 4, from which we can discern three characteristics:
(1) the cultivated land area of the country shows a generally fluctuating
upward trend, with three ??bottoms,?? in 1600, 1750, and 1850 A.D.; (2) before
1850 A.D., the growth rate of cultivated land was relatively slow, with an
average annual growth rate of 3.14??; (3) after 1850 A.D.,
the cultivated land increased at a high rate in an approximate straight line,
with an average annual growth rate of 11.90??. It should also be noted that
there is not much difference between the value of cultivated land based on
grain possession per capita and the value based on cultivated land area per
capita, with a relative deviation of only 4.07%, in general, which shows that
the two estimated results are relatively consistent.
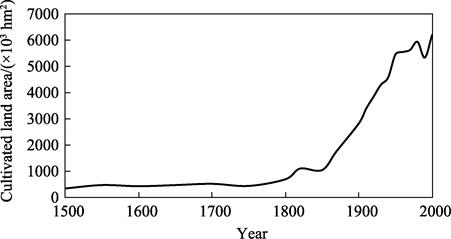
Figure 4 Reconstructed results for cultivated land
in Vietnam from 1500 to 2000 A.D.
4.3.2 Comparison with Results
for Vietnam in Other Global Datasets
The reconstructed results for cultivated land in Vietnam in this paper were
compared with those in the HYDE 3.2, SAGE, and other global datasets
(Figure 5), which showed that: (1) the trends of the latter two datasets before
1800 A.D. were close to the results
obtained in this paper, with a minimum relative deviation of 3.20% in value,
and that the consistency among the three datasets was good; (2) although the
temporal resolution of the latter two datasets since 1800 A.D. has been improved to 10 years and 1
year, respectively, the details of the change process are quite different from
the results in this paper, and the deviations at most time points are higher
than those before 1800 A.D.
Because the temporal resolution of the HYDE 3.2
dataset before 1700 A.D. is only 100 years and the SAGE dataset lacks data
before 1700 A.D., it is difficult to reflect the fluctuations in land
reclamation rates caused by natural or social events lasting only a few years or
decades in Vietnam before 1700 A.D. Moreover, the idea for reconstruction of
the global datasets is based on backward extrapolation of modern cropland area,
and lacks the support of population and land statistics for the historical
period, which leads to an overly smooth curve for the reconstructed results.
Based on the above analysis, we believe that the results in this paper better
depict the changes in cultivated land area in Vietnam during the past 500
years.
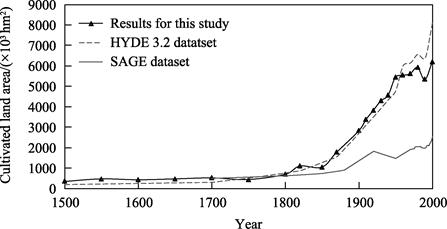
Figure 5 Comparison of different reconstructed
results for cultivated land in Vietnam for the period 1500–2000 A.D.
5 Discussion and
Conclusion
The method behind the idea for reconstructing population and land data
developed in this paper was to first revise and interpolate the population sequence
of Vietnam over the past 500 years, and then to reconstruct the national
cultivated land at multiple time points based on cultivated land per capita and
grain possession per capita. The reconstructed results include a data file
stored in Microsoft Excel format, consisting of reconstruction years,
population, cultivated land calculated based on cultivated land area per capita
and grain possession per capita. The size of this data file is 12.5 KB, and
the time resolution of this dataset is 50 years for 1500–1800 A.D., 20–30 years for 1800–1900 A.D., and 10 years for 1900–2000 A.D.
The cultivated land reconstructed for Vietnam over
the past 500 years shows an almost exponentially increasing trend, with a slow
increase before 1850 A.D. and then a rapid increase after 1850 A.D. This result
lays a data foundation for determining the spatial distribution of cultivated
land in Vietnam in different historical time periods. Due to the long history
of mutual aggression between the countries of the Indochina Peninsula, the territories of these countries
have changed greatly over time. Therefore, the next step in this study is to
select appropriate spatial distribution factors for grid distribution of
cultivated land in Vietnam based on the definitions of national territorial
boundaries in different historical time periods.
Author Contributions
Liu, H. L. designed the overall plan of dataset; Liu X. collected and
processed population and other data; Liu, H. L. and He, F. N. designed the
model and algorithms; Liu, X. verified the data results; Liu, H. L. and Liu, X.
wrote the data paper.
Conflicts of Interest
The authors declare no conflicts of
interest.
References
[1]
Skole, D. L., Meyer, W. B., Turner, II., et al. Global
land-use/land-cover change: towards an integrated study [J]. AMBIO—A Journal
of the Human Environment, 1994, 23(1): 91.
[2]
Ramankutty, N., Delire, C., Snyder, P. Feedbacks between
agriculture and climate: an illustration of the potential unintended
consequences of human land use activities [J]. Global & Planetary Change, 2006,
54(1/2): 79–93.
[3]
Mahmood, R., Pielke, R. A., Hubbard, K. G., et al. Land cover changes and their
biogeophysical effects on climate [J]. International Journal of Climatology,
2014, 34(4): 929–953.
[4]
Ruddiman, W. F. The anthropogenic greenhouse era began thousands
of years ago [J]. Climatic Change, 2003, 61(3): 261–293.
[5]
Goldewijk, K. K., Drecht, G. V., Bouwman, A. F. Mapping
contemporary global cropland and grassland distributions on a 5??5 minute
resolution [J]. Journal of Land Use Science, 2007, 2(3): 167–190.
[6]
Goldewijk, K. K. Estimating global land use change over the past
300 years: the HYDE database [J]. Global Biogeochemical Cycles, 2001,
15(2): 417–433.
[7]
Goldewijk, K. K., Beusen, A., Doelman, J., et al. Anthropogenic land use estimates for
the Holocene- HYDE 3.2 [J]. Earth System Science Data, 2017, 9(2): 927–953.
[8]
Kaplan, J. O., Krumhardt, K. M., Ellis, E. C., et al. Holocene carbon emissions as a
result of anthropogenic land cover change [J]. Holocene, 2011, 21(5):
775–791.
[9]
Ramankutty, N., Foley, J. A. Estimating historical changes in
global land cover: croplands from 1700 to 1992 [J]. Global Biogeochemical
Cycles, 1999, 13(4): 997–1027.
[10] Ramankutty,
N. Global cropland and pasture data from 1700–2007. Available online at [http://www.geog.mcgill.ca/nramankutty/Data-sets/Datasets.html]
from the LUGE (Land Use and the Global Environment) Laboratory, Department of
Geography, McGill University, Montreal, Quebec, Canada. 2012.
[11]
Li, B. B., Fang, X. Q., Ye, Y.,
et al. Regional assessment of the accuracy
of global land use datasets: the case of Northeast China [J]. Science of
China: Earth Sciences,
2010, 40(8): 1048–1059.
[12] He,
F. N., Li, S. C., Zhang, X. Z., et al. A comparative analysis of the results of arable land
reconstruction in traditional farming areas in China over the past 300 years [J].
Acta Geographica Sinica, 2012, 67(9): 1190–1200.
[13]
Fang, X. Q., Zhao, W. Y., Zhang, C. P., et al. Assessment methods and evaluation
cases of data reliability of global historical LUCC datasets [J]. China
Science: Earth Science,
2020, 50(7): 1009–1020.
[14]
Thompson, R. S. BIOME 300: understanding the impacts of human
activities on land cover over the past 300 years [J]. IGBP Newsletter,
2000, 43: 2–3.
[15]
Li, M. J., He, F. N., Xiao, R. A comparative study of spatial and
temporal changes in arable land in China, the United States, Pakistan and India
over the past 300 years [J]. Advances in Geographical Sciences, 2015,
34(1): 64–72.
[16]
Etter, A., McAlpine, C., Possingham, H. Historical patterns and
drivers of landscape change in Colombia since 1500: a regionalized spatial
approach [J]. Annals of the Association of American Geographers, 2008,
98(1): 2–23.
[17] Li, T. N. The Social and Economic History of the Nguyen
Dynasty in Vietnam [M]. Beijing: Wenjin Press, 2000.
[18]
Liu, H. L., Liu, X., He, F. N. Cultivated land dataset in Vietnam
based on historical documentation (1500-2000) [J/DB/OL]. Digital Journal of Global Change Data
Repository, 2022. https://doi.org/10.3974/ geodb.2022.03.07.V1. https://cstr.escience.org.cn/CSTR:20146.11.2022.03.07.V1.
[19]
GCdataPR Editorial Office. GCdataPR data sharing policy [OL]. https://doi.org/10.3974/dp.policy.2014.05 (Updated 2017).
[20]
McEvedy, C., Jones, R. Atlas of World Population History [M].
Puffin Books, 1978.
[21]
Maddison, A. The World Economy: Volume 1: A Millennial Perspective
and Volume 2: Historical Statistics [M]. OECD Publishing, 2006.
[22]
Mitchell, B. R. International Historical
Statistics: Africa, Asia & Oceania, 1750-1988 [M]. Stockton Press, 1995.
[23]
The Nguyen Dynasty Museum of Vietnam. Da Nan Unified History [M]. Chongqing:
Southwest Normal University Press, 2015.
[24]
The World Bank. World Development Indicators [Z]. http://datacatalog.worldbank.org.
[25]
Ma, Z. H. The current situation of Vietnam under French rule [J]. New
China Magazine, 1933, 1(16).
[26]
Ruan, H. F. Vietnamese Village Community [M]. Southeast Asia
Research Institute in Yunnan province of P. R. China, 1983.
[27]
Wu, H. Grain yield, grain possession per capita and labor
productivity in the early Qing dynasty [J]. Studies in Chinese Economic
History, 1993(1): 43–48.
[28]
Qu, W. A study of Vietnamese economy during
the French colonial rule [D]. Guiyang: Guizhou Normal University, 2015.
[29]
Reid, A. Southeast Asia in the Age of Commerce, 1450-1680 (Volume 1: The Lands below the Winds) [M]. New Haven, CT:
Yale University Press, 1988.
[30]
Lu, Y. M. A study of the changing pattern of agricultural
population growth in early modern Britain [J]. Theorists, 2008(8): 110–112.
[31]
Xie, F. Z. When did the economic gap between China and the West
open up? —Angus Maddison??s ??Millennium Statistics?? [J]. Journal of
Historical Theory, 2012(4): 40–48, 158–159.
[32]
Gao, X.
Progress and experience of low-carbon transition in Germany [J]. German
Studies, 2014, 29(2): 32–44, 125.
[33]
Han, Z. J.
A study of issues related to the compilation of the Da Nan Unified History [J].
Chinese Historical Geography Series, 2018, 33(3): 105–114.