China Intertidal Zone Dataset Based on Tidal
Correction
Han, Q. Q. Niu, Z. G.*
State key Laboratory of Remote Sensing Science, Aerospace Information Research Institute, Chinese Academy of Sciences, Beijing 100101, China
Abstract: Intertidal zones, which are located in the transitional area of sea and land, are important to biodiversity protection, social and economic development, and global environmental changes. In this study, the dataset that was generated using the integrated remote sensing and GIS method based on 156 Landsat Thematic Mapper/Operational Land Imager images covering the entire coastal area of China in 1995 and 2015 allowed us to segment the China coast according to tidal station, extract each image’s shoreline during the two adjacent periods, then calculate the slope of each shore segment. Finally, we simulated the average high and low tide correction distances and determined the spatial and temporal distribution of intertidal zones combining the tidal level information at the transit of the satellite and the average high and low tide level data. The results are as follows. (1) In 2015, the total area of the intertidal zone in China was approximately 14,193 km2, of which Fujian province (19%) had the greatest portion of its area in intertidal zones, followed by Liaoning province (15%), Shandong province (14%), Jiangsu province (12%), and Guangdong province (11%); the Taiwan province had the least intertidal area (2%). (2) From 1995 to 2015, China’s overall intertidal zone area decreased by 1,332 km2, approximately 8.6%. The intertidal zone area of different provinces and cities showed different increasing and decreasing trends. The largest absolute reduction of intertidal zones was in Zhejiang province, with an area decrease of 1,189 km2. The intertidal zone area of Jiangsu province also decreased greatly, causing Jiangsu’s status as the province with the most intertidal zone area in China in 1995 to fall to the fourth position in 2015. The intertidal zones in Fujian province exhibited the greatest increase, reaching 597 km2. The dataset is vector data, stored in .shp format, consisting of two folders, the intertidal zone of the year of 1995 and the intertidal zone of the year of 2015. Each file is named according to the path and row number, and the data volume is 34.1 MB (compressed as a file of 13.3 MB).
Keywords: intertidal zones; wetland remote sensing; tidal correction; China coastal wetland
1 Introduction
The intertidal zone is the area between the high-tide lines and the low-tide lines. It is submerged by seawater at high tide and exposed at low tide. As a vanguard zone of land-sea interaction, it is an important reference for studying modern coastal dynamics and environmental changes[1]. The intertidal zone has high productivity and plays an irreplaceable role in providing a habitat that facilitates biodiversity, migration of waterfowl, coastal ecosystem services, and resisting storm surges and the hazards caused by sea level rise[2–3]. Based on Landssat TM/OLI satellite images and tidal data of tidal stations, the distribution and changes of China’s intertidal zone in 1995 and 2015 were studied, and the dataset of China’s intertidal zone distribution in 1995 and 2015 were obtained.
China’s coastline stretches from the Yalu Estuary to the Beilun Estuary. It is a southeast-protruding arc covering mainland China, Hong Kong, Macao, and Taiwan. From the north to south, it covers Liaoning, Hebei, Tianjin, Shandong, Jiangsu, Shanghai city, Zhejiang, Fujiane, Guangdong (including Hong Kong and Macao), Guangxi, Hainan, and Taiwan. With the increase in population and the demand for economic development, the reduction of the intertidal zone has been widespread throughout the world due to the utilization of beach resources, the rise in sea level caused by global climate change, the intensification of storm surges, and coastal erosion. For example, from the 1980s to the present, the intertidal zone in the Yellow Sea decreased by 28%[4].
2 Metadata of Dataset
The names, authors, geographical regions, year of dataset, temporal resolution, spatial resolution, content of dataset, data publishing and sharing service platform, and data sharing policy of the “Tidal correction based intertidal zone changes dataset of China (1995–2015)”[5] are shown in Table 1.
3 Data Development Method
Ma et al.[8] used the method of calculating slope by tide level height and satellite image to determine the correct position of the coastline. Zhang et al.[9] used tidal data to calculate tidal slope, and then extracted coastline. Wang et al.[6] put forward a new tidal correction method on the basis of the above and validated it for the coast of Yancheng, Jiangsu. A variation coefficient was used to express the difference between the high and low tide lines and the area of the intertidal zone based on the combination of remote sensing images of different time phases. The selection of the temporal phase of remote sensing images was verified. It has good stability for the inverted intertidal zone area and can be extended to area estimation of other coastal intertidal zones. On this basis, we inverted the national intertidal zone.
According to the distribution of national tide stations and the fluctuation of tidal level, the tidal level fluctuation between the selected tide stations should be minimized to the greatest extent possible. We divided the coastline of China into 53 sections (Table 2) as the calculation unit of intertidal inversion. There is one tide station in each coastal segment, and the tide level data of the corresponding coastal segments is here represented by the observation data of the tide station. For each coastal unit, two images of different periods, one in 1995 and one in 2015, were downloaded to extract the waterline and calculate the high and low tide line. On the basis of this classification, the extraction and validation of the waterfront were carried out separately. On this basis, the average slope of each coastal segment was calculated, and the correction distance of the average high tide and low tide was calculated
Table 1 Metadata summary of “Tidal correction based intertidal zone changes dataset of China (1995–2015)”
|
Item
|
Description
|
|
Dataset full name
|
Tidal correction based intertidal zone changes dataset of China (1995–2015)
|
|
Dataset short name
|
TidalChina_1995-2015
|
|
Author
|
Han, Q. Q. G-2185-2019, State key Laboratory of Remote Sensing Science, Aerospace Information Research Institute, Chinese Academy of Sciences, hanqq@radi.ac.cn
Niu, Z. G. L-4829-2016, State key Laboratory of Remote Sensing Science, Aerospace Information Research Institute, Chinese Academy of Sciences, niuzg@radi.ac.cn
|
|
Geographical region
|
Coast of China
|
|
Year
|
1995, 2015 Temporal resolution 1 year
|
|
Spatial resolution
|
30 m Data format .shp Data size 34.1 MB
|
|
Data files
|
The dataset consists of two folders, the intertidal zone of 1995 and the intertidal zone of 2015, as explained below:
(1) Each file is named according to the path and row number, and the coastal segments, if a Landsat TM/OLI covers two coastal segments, the underline and the number are appended to the path and row number, such as 118038_1area, 118038_2area
(2) Jiangsu1995 and jiangsu2015 in the two folders are from Wang et al.[6]
|
|
Foundations
|
Chinese Academy of Sciences (XDA19030203); National Natural Science Foundation of China (41271423)
|
|
Data Publisher
|
Global Change Research Data Publishing & Repository, http://www.geodoi.ac.cn
|
|
Address
|
No. 11A, Datun Road, Chaoyang District, Beijing 100101, China
|
|
Data sharing policy
|
Data from the Global Change Research Data Publishing & Repository includes metadata, datasets (data products), and publications (in this case, in the Journal of Global Change Data & Discovery). Data sharing policy includes: (1) Data are openly available and can be free downloaded via the Internet; (2) End users are encouraged to use Data subject to citation; (3) Users, who are by definition also value-added service providers, are welcome to redistribute Data subject to written permission from the GCdataPR Editorial Office and the issuance of a Data redistribution license; and (4) If Data are used to compile new datasets, the ‘ten percent principal’ should be followed such that Data records utilized should not surpass 10% of the new dataset contents, while sources should be clearly noted in suitable places in the new dataset[7]
|
(Figure 1). Specific steps are as follows: calculating the distance between the tidal level difference and the instantaneous waterline at the adjacent time of two images in the same area, calculating the slope of the intertidal zone; then calculating the correction distance of the high tide and the low tide combined with the average high tide and the low tide data and the tidal level h at the transit time. The formulas for calculating the parameters are as follows:
 (1)
(1)

 (2)
(2)
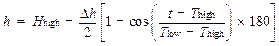 (3)
(3)
where θ is the slope of intertidal zone, ΔH is the tidal level difference between two images at the adjacent time of the same region, ΔL is the instantaneous waterline distance between two images at the adjacent time of the same region, ??high is the multi-year average high tide data, ??low is the multi-year average low tide data, h is the tidal level at any time, t is the time, and Tlow is the time of low tide that day when Thigh is the time of high tide.
Table 2 Coastal segments in the coastal zone of China
|
Code
|
Coastal segment/Tidal station
|
Code
|
Coastal segment/Tidal station
|
Code
|
Coastal segment/Tidal station
|
|
1
|
Liaoning Yalu River Estuary–
Liaoning Zhuanghe Port/Dandong New Port
|
19
|
Jiangsu New Huaihe Estuary–
Jiangsu Biandang Port/ Binhai Port
|
37
|
Fujian Shuiao–Fujian Anhai Bay Pass/Shenzhen-Shanghai Port
|
|
2
|
Liaoning Zhuanghe Port–Liaoning Lvshun Port/Dalian
|
20
|
Jiangsu Biandang Port–Jiangsu Sheyang Estuary/She yang Estuary
|
38
|
Fujian Anhai Bay Pass–Fujian Xixi Estuary/Shijing
|
|
3
|
Liaoning Lvshun Port–Hulushan Bay Estuary/Jinxian
|
21
|
Jiangsu Sheyang Estuary-Jiangsu Xinyang Port/Xinyang Port
|
39
|
Fujian Xixi Estuary–Fujian Chilanxi Estuary/Xiamen
|
|
4
|
Liaoning Hulushan Bay Estuary– Liaohe Estuary/Bayuquan
|
22
|
Jiangsu Xinyang Port–Jiangsu Wanzhuang Port/Xinyang Port
|
40
|
Fujian Chilanxi Estuary–Guangdong Wukan Port/Shantou
|
|
5
|
Liaoning Liaohe Estuary–Daling Estuary/Laobei Estuary
|
23
|
Jiangsu Wanzhuang Port– Jiangsu Dining Port/Chen Jiawu
|
41
|
Guangdong Wukan Port–Dutou Estuary/Shanwei
|
|
6
|
Liaoning Daling Estuary–Liaoning Yantai Estuary/Jinzhou Port
|
24
|
Jiangsu Dining Port–Jiangsu Xinkai Port/Yu Port
|
42
|
Guangdong Dutou Estuary– Guangdong Pearl River Estuary/Hong Kong
|
|
7
|
Liaoning Yantai Estuary–Liaoning Dog Estuary/Tuanshan Cape
|
25
|
Jiangsu Xinkai Port–Shanghai Yangtze River Estuary/Lv Si
|
43
|
Guangdong Pearl River Estuary- Guangdong Nalong River Estuary/Macao
|
|
8
|
Liaoning Gou Estuary–Hebei
Yinma Estuary/Zhimao Bay
|
26
|
Shanghai Yangtze River
Estuary–Shanghai Luchao Port/ Zhongdian
|
44
|
Guangdong Nalong Estuary– Guangdong Bomao Port/Xige
|
|
9
|
Hebei Yinma Estuary–Hebei Dou Estuary /Jingtang Port
|
27
|
Shanghai Luchao Port–Zhejiang Haiyantang Estuary/Jinshanzui
|
45
|
Guangdong Bomao Port–Guangdong Lao Port/Zhanjiang
|
|
10
|
Tianjin Dou Estuary–Hebei Beipai Estuary/Tanggu
|
28
|
Zhejiang Haiyantang Estuary– Zhejiang Beipai River Estuary/ Shupu
|
46
|
Guangdong Laogang–Guang-
dong Egg Farm Port/Quick Sand
|
|
11
|
Hebei Beipai Estuary–Shandong Yellow River Estuary/Dongfeng Port
|
29
|
Zhejiang Beipai River Estuary– Zhejiang Jintang Port/Zhenhai
|
47
|
Guangdong Eggyard Port–Guangdong Anpu Port/Lower berth
|
|
12
|
Shandong Yellow River Estuary–
Shandong Huangshui Estuary/
Longkou
|
30
|
Zhejiang Jintang Port–Zhejiang Dasong River Estuary/
Qitoujiao
|
48
|
Guangdong Anpu Port–
Guangxi Beihai Port/Tieshan Port
|
|
13
|
Shandong Huangshui Estuary– Shandong Weihai Port/Yantai
|
31
|
Zhejiang Dasong River Estuary– Zhejiang Central Port/Xize
|
49
|
Guangxi Beihai Port–Guangxi Beilun Estuary/Pengsha
|
|
14
|
Shandong Weihai Port–Shandong Lane Estuary/Chengshan Cape
|
32
|
Zhejiang Central Port–Zhejiang Dong Port/Qimen Port
|
50
|
Hainan Bay Estuary–Hainan Dongfang Port/Sanya
|
|
15
|
Shandong Lane Estuary–Shandong Xinjia Port/Shidao
|
33
|
Zhejiang Dong Port–Tongli Estuary/Haimen
|
51
|
Hainan Dongfang Port–Hainan Bay Estuary/Xinying
|
|
16
|
Shandong Xinjia Port–Shandong Chao Estuary /Qingdao
|
34
|
Zhejiang Tongli River Estuary– Zhejiang Wenzhou Bay
Estuary/Dongmen Village
|
52
|
Taiwan Yongan Port–Taiwan Hongmao Port/Keelung
|
|
17
|
Shandong Chaohe Estuary–Jiangsu Guanhe Estuary/Lanshan Port
|
35
|
Zhejiang Wenzhou Bay Pass– Zhejiang Gateway Port/Ruian
|
53
|
Taiwan Hongmao Port–Taiwan Yongan Port/Kaohsiung
|
|
18
|
Jiangsu Guanhe Estuary–Jiangsu Xinhuai Estuary/Yanwei
|
36
|
Zhejiang Damen Port–
Fujian Shui’ao/Sansha
|
|
|
4 Data Results
The China intertidal dataset consists of two subfolders. The files in each folder are named according to the row and column numbers. The data format is .shp, and the data can be displayed spatially using ArcMap (Figure 2).
5 Conclusion
Due to the transient characteristics of satellite remote sensing observations and the dynamics of tidal changes, remote sensing data cannot be directly used to monitor the intertidal zones. This dataset, which comprises the simulated distribution of the coastal intertidal zone of China in 1995 and 2015, respectively, was developed with the GIS simulation method using a combination of remote sensing data and field observation data. Its spatial resolution is 30 m and temporal resolution is one year. The Landsat TM/OLI satellite imagery covering the national coastal regions has been employed.
|

Figure 1 Flowchart of the dataset development
|
China’s coastal intertidal zone area was 14,070 km2 in 2015. From 1995 to 2015, the national intertidal zone area decreased by 1,375 km2, approximately 8.9%. Among the coastal provinces, the largest reduction
of intertidal zone area was Zhejiang pro-
vince, with an area decrease of 1,189 km2,
approximately 43.7%. The intertidal zone
area of Jiangsu province was greatly
reduced, by which its first position of having the most intertidal zone area of China in 1995 decreased to the fourth in 2015. Among the coastal sections of China, the intertidal zone between Shanghai Luchao Port–Zhejiang Jintang Port decreased the most, reaching 56.5%; while the intertidal zone between Fujian Shuiao–Anhai Bay Pass increased the most, reaching 445.59 km2 and 37.28%.
In general, the “squeezing effect” caused by human development and utilization of the coastal intertidal zone and sea level rise is the main reason for the decrease of the coastal intertidal zone in China; while other natural factors such as sediment content of rivers entering the sea
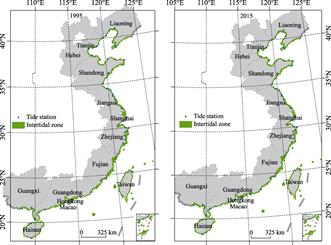
Figure 2 The intertidal distribution of China[10]
and the coast Hydrodynamic changes is also important factors affecting the change of coastal intertidal zone. These factors have caused the expansion of some intertidal zones to the sea and the area. This dataset can provide a meaningful reference for understanding (1) the distribution and changes of the intertidal zone in China, (2) the impact of socio-economic development on the exploitation of coastal intertidal zones, and (3) the impact of rising sea level on the intertidal zonesand the protection and restoration of coastal wetlands.
For the intertidal zone developed and utilized, we correct the position of the simulated high tide line to eliminate the error by visual interpretation and obtain the distribution of the real intertidal zone. For the hard boundary between land and water such as seaside dams, roads and ports, we also use visual interpretation to correct the position of the simulated high tide line. Figure 3 shows the partial section of the Daling estuary-Yantai estuary, the intertidal zone of Figure 3(a) is mainly occupied by the reclamation, town construction, port construction. The intertidal zone of Figure 3(b) is mainly utilized by the reclamation and marine aquaculture. For these cases, we use visual interpretation to correct the position of the simulated high tide line.
Local experiments have proved that the development method of this dataset is robust and operational, with a resulting margin of error between 3% and10%[6]. However, because of the limitation of the poor spatial resolution of Landsat TM/OLI imagery and the inaccessible topographic data with high precisions across coastal regions, this dataset could have more errors when applied to or validated in those coastal areas with steep terrain, or regions where higher precision tidal map (with a scale of 1:50,000 or less) is needed. To improve the precision of tidal maps, we propose using our proposed method and replacing Landsat TM/OLI imagery employed in this dataset with satellite data or drone data with higher spatial and temporal resolution in the future.
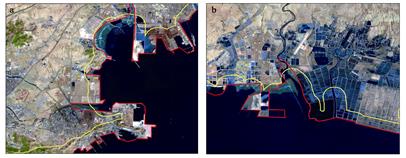
Figure 3 Differences between simulated high-tide line (yellow) and actual high-tide line (red)
References
[1] Gu, Y. Study on dynamic monitoring of intertidal terrain by remote sensing [D]. Nanjing: Nanjing Normal University, 2013: 1–101.
[2] Murray, N. J., Stuart, R. P., Robert, S. C., et al. Continental scale mapping of tidal flats across East Asia using the Landsat archive [J]. Remote Sensing, 2012, 4: 3417–3426.
[3] Sagar, S., Roberts, D., Bala, B., et al. Extracting the intertidal extent and topography of the Australian coastline from a 28 year time series of Landsat observations [J]. Remote Sensing of Environment, 2017, 195: 153–169.
[4] Cai, F., Su, X. Z., Liu, J. H., et al.Coastal erosion problem and countermeasures in China under the background of global climate change [J]. Progress in Natural Science, 2008, 18(10): 1093–1103.
[5] Han, Q. Q., Niu, Z. G. China intertidal zone simulation dataset based on tidal correction [DB/OL]. Global Change Research Data Publishing & Repository, 2019. DOI: 10.3974/geodb.2019.01.20.V1.
[6] Wang, J. W., Niu, Z. G. Remote-sensing analysis of Yancheng intertidal zones based on tidal correction [J]. Acta Oceanol Sinica, 2017, 39(5): 149–160.
[7] Editorial office of GCdataPR. GCdataPR data sharing policy [OL]. DOI: 10.3974/dp.policy.2014.05 (Updated 2017).
[8] Ma, X. F., Zhao, D. Z., Xing, X. G., et al. Means of withdrawing coastline by remote sensing [J]. Mar Environ Science, 2007, 26(2): 185–189.
[9] Zhang, X. K., Zhang, X, Yang, B. H., et al. Coastline extraction using remote sensing based on coastal type and tidal correction [J]. Remote Sense Land Resource, 2013, 25(4): 91–97.
[10] Han, Q. Q., Niu, Z. G., Wu, M. Q., et al. Remote-sensing monitoring and analysis of China intertidal zone changes based on tidal correction [J]. Chinese Science Bulletin, 2019, 64(4): 456–473.