Carbon Emission Reduction Potential
Dataset Balancing per Capita and Benefit in Each of Provinces of China
Zhou, D.1 Hua, S. R.2*
1. Institute of Studies for the Great Bay Area, Guangdong
University of Foreign Studies, Guangzhou 510006, China;
2. School of Economics and Trade, Guangdong University of
Foreign Studies, Guangzhou 510006, China
Abstract: We developed a dataset on the potentialities of carbon emission
reduction based on per capita carbon emissions and carbon emissions efficiency
metadata extracted for 29 provinces in China. The data were obtained from the China Statistical Yearbook, the China Energy Statistical Yearbook, and
China Stock Market & Accounting Research Databases for the period
1997?C2015. Hainan, Tibet, Hong Kong, Macao, and Taiwan were not included in the
database because of incomplete data. We converted the fixed capital generated
over the study period into uniform values with reference to the constant price
in 1952 using an implicit investment deflator in each province. Next, referring
to the set depreciation rate and the base period capital stock, we applied the
perpetual inventory method to estimate annual capital stocks. Actual GDPs, with
reference to the 1952 baseline value, were calculated by dividing the nominal
GDP values of the provinces for the period 1997?C2015 by the 1952-based GDP
deflator. Total carbon emissions for each province were calculated from fossil
fuel combustion and cement consumption values along with associated carbon
emission coefficients. These values were then divided by the value for the
total provincial population recorded at the end of the year to calculate per
capita carbon emission values. In our study, carbon dioxide emissions from the
growth of each unit of GDP were considered to reflect the carbon emission
intensity. Accordingly, we applied the Super SBM model to measure carbon
emissions efficiency levels. We measured the equity of regional carbon
emissions based on per capita carbon emissions. Finally, we used the Markov
model to calculate the club convergence index of carbon emissions efficiency
and fairness to assess their importance in relation to China??s carbon reduction
potential, with an emphasis on carbon emissions. The dataset contains 10 tables
depicting the following categories of annual provincial-level data for the
period 1997?C2015: (1) annual capital stocks, (2) annual GDP values with reference to baseline statistics for 1952, (3) annual
per capita carbon emissions, (4) annual carbon emission intensity, (5) carbon emission
efficiency calculated using the Super SBM model, 6) energy consumption, (7)
Markov transfer probability results for per capita carbon emissions and carbon
emissions efficiency in China, (8) a club convergence index model of per capita
emissions and the efficiency of regional carbon emission reduction for
different temporal durations, (9) degrees of curing based on the results of differential
testing of regional per capita carbon emissions and carbon emissions efficiency
at a regional scale, and (10) estimation results for the carbon emission
reduction potentials of provinces in China based on levels of coordination of
per capita and efficiency. The datasets were archived within one data file
(with a .xlsx extension) that was 134 KB in size. An analysis of the overall dataset
has been published in the Journal of
Natural Resources (Vol. 34, No.1, 2019).
Keywords: carbon reduction
potential; per capita carbon emissions; carbon emissions efficiency; China
1 Introduction
China??s
GDP has increased by about 50% since the implementation of the 12th Five-Year
Plan. Excessive CO2 emissions that have accompanied this rapid
economic growth have emerged as an increasingly urgent issue. To achieve the UN
Sustainable Development Goals and to safeguard the welfare of the population,
the Chinese government has announced a carbon emission intensity reduction
target of 60%?C65% of CO2 emissions per unit of GDP compared with
2005 levels. The development of a more accurate method of measuring the carbon
emission reduction potential compared under existing constraints, would
facilitate the planning of a more harmonious carbon emission path and the
formulation of a rational and scientifically based regional emission reduction
policy. This study is aimed at contributing theoretical inputs for ??establishing
and improving the economic system of a green and low-carbon development cycle,?? thereby enabling the compelling
vision of ??clear waters and lush mountains,?? considered as invaluable assets,
to be achieved. Current research on the reduction of carbon emissions has
mainly focused on three core principles: the fairness of carbon emissions,[1?C3]
the efficiency of carbon emissions,[4?C8] and a combination of both
principles.[9?C11] Studies conducted from a singular perspective[1?C8]
do not allow for a comprehensive consideration. While some studies have adopted
the principles of fairness and efficiency of carbon emissions,[9?C11]
they have ignored significant variations relating to carbon reduction
potential. Consequently, the measurements applied have not been sufficiently
scientific and rigorous, thereby reducing the value and effectiveness of policy
inputs. To address this gap, we used provincial-level data to calculate
the club convergence index of carbon emissions fairness and efficiency in 29
provinces in China for the period 1997?C2015. We subsequently compared the
importance of applying these two principles in relation to carbon emissions and
assessed the extent of their coordination. Subsequently, we constructed a
dataset on the potentialities of carbon emission reduction.
2 Metadata of
Dataset
Table
1 presents a summary framework of the Dataset
on the Potentialities of Carbon Emission Reduction in China based on Provincial Metadata on per Capita Carbon Emissions
and Carbon Emissions Efficiency[12]. This content includes the full as well as abbreviated
names of the dataset, the names of the authors, the geographical region and
years of coverage included in the dataset, the data composition, data
publisher, and data-sharing policy.
3 Methods
Based
on the data for 29 provinces from 1997 to 2015, we measured the efficiency of
carbon emissions using the Super SBM model, and the equity of regional carbon
emissions on the basis of per capita carbon emissions. Finally, we applied the
Markov model to calculate the club convergence index of carbon emissions
efficiency and fairness and subsequently assessed their importance with regard
to China??s carbon reduction potential, with an emphasis on carbon emissions.
Table 1 Metadata summary of the Dataset on the Potentialities of Carbon Emission Reduction in China
based on Provincial Metadata on per Capita Carbon Emissions and Carbon
Emissions Efficiency
|
Items
|
Description
|
|
Dataset full name
|
Dataset on the Potentialities of Carbon Emission Reduction in China
based on Provincial Metadata on per Capita Carbon Emissions and Carbon
Emissions Efficiency
|
|
Dataset short name
|
C_EmissionReduction_ProvChina
|
|
Authors
|
Zhou, D. AAG-1775-2019, Institute of Studies for the Great Bay Area, Guangdong
University of Foreign Studies, Guangzhou, Guangdong, China,
zhoudi19880101@163.com
Hua, S. R. AFF-8627-2019, School of Economics and Trade, Guangdong
University of Foreign Studies, Guangzhou, Guangdong, China, hsharon09@163.com
|
|
Geographical regions
|
29 provinces in China (excluding Hainan, Tibet, Hong Kong, Macau, and
Taiwan)
|
|
Years
|
1997?C2015
|
|
Data format
|
.xlsx Data
size 134KB
|
|
|
|
Data composition
|
The following categories of annual data from 29 provinces in China are
included in the dataset for the period 1997?C2015: (1) annual capital stocks,
(2) annual GDP data with reference to baseline statistics for 1952, (3) annual
per capita carbon emissions, (4) annual carbon emissions intensity, (5)
carbon emissions efficiency calculated using the Super SBM model, (6) energy
consumption, (7) per capita carbon emissions and carbon emissions efficiency in China
calculated using the Markov transition probability matrix, (8) a club
convergence index model of per capita carbon emissions and the efficiency of
regional carbon emission reduction under periods of varying duration, (9) degrees
of curing based on the results of differential testing of per capita carbon
emissions and the efficiency of regional carbon emissions, and (10) estimation
results for the carbon emission reduction potentials of provinces in China
according to levels of coordination between per capita carbon emissions and
carbon emissions efficiency
|
|
Foundation
|
Natural Science Foundation of Guangdong Province (2018A030310044)
|
|
Data publisher
|
Global Change Research Data Publishing & Repository;
http://www.geodoi.ac.cn
|
|
Address
|
No. 11A, Datun Road, Chaoyang District, Beijing 100101, China
|
|
Data sharing policy
|
Data from the Global
Change Research Data Publishing & Repository includes metadata, datasets
(data products), and publications (in this case, in the Journal of Global Change
Data & Discovery). Data sharing policy includes: (1) Data are openly
available and can be free downloaded via the Internet; (2) End users are
encouraged to use Data subject to citation; (3) Users, who are by definition
also value-added service providers, are welcome to redistribute Data
subject to written permission from the GCdataPR Editorial Office and the
issuance of a Data redistribution license; and (4) If Data are used to
compile new datasets, the ??ten per cent principal?? should be followed such
that Data records utilized should not surpass 10% of the new
dataset contents, while sources should be clearly noted in suitable places in
the new dataset[13]
|
|
Communication and searchable system
|
DO I, DCI, CSCD, WDS/ISC, GEOSS,
China GEOSS
|
3.1 Data Collection
We
developed a dataset on the potentialities of carbon emission reduction in
China. The data for 29 provinces were sourced from the China Statistical Yearbook, the China
Energy Statistical Yearbook, and China Stock Market & Accounting
Research Databases for the period 1997?C2015. Hainan, Tibet, Hong Kong, Macao,
and Taiwan were not included in the database because of incomplete data.
Drawing on Shan??s[14] methodology, we converted the fixed capital
generated over the study period into uniform values with reference to the constant
price in 1952 using an implicit investment deflator in each province. Then we
applied the perpetual inventory method to estimate annual capital stocks based
on the set depreciation rate and the base period capital stock. Actual GDPs in
relation to the base year (1952) were obtained by dividing the nominal
provincial GDPs for the period 1997?C2015
by the 1952-based GDP deflator. Total carbon emissions in
each province were calculated from fossil fuel combustion and cement
consumption values along with the associated carbon emission coefficient,
which were then divided by the value for the total population recorded at the
end of the year to calculate per capita carbon emissions. In our study, carbon
dioxide emissions from the growth of each unit of GDP reflected the intensity
of carbon emissions.
3.2 Algorithm
We
expanded the emission reduction potential index developed by Wei et al. [13]
and calculated carbon emission reduction potential based on balancing per
capita carbon emissions and carbon emissions efficiency. Calculation was performed
using the following equation:
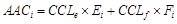 (1)
(1)
where
AACi is the index for the
carbon emission reduction potential of province i; CCLe and CCLf respectively denote the
weight of carbon emission efficiency and fairness, measured on the basis of
solidification??s degree, as specified in club convergence index; Ei and Fi respectively denote standardized carbon emission
efficiency and fairness values for province i.
3.3 Research Steps
3.3.1 Application
of the Super SBM Model, Incorporating Undesirable Outputs to Measure Carbon
Emission Efficiency
Referring
to the research of Tone[15], we applied the Super SBM model to
measure the efficiency of carbon reduction. Using data compiled for the 29
provinces for the period 1997?C2015, we included the following indicators of
inputs with reference to 1952 (the base year): capital investments measured by
capital stocks, labor inputs measured by the total number of employees at the
end of year, and energy inputs measured by the total energy consumption. We
included GDP data as an indicator of desirable outputs with reference to
statistics for 1952. Finally, we considered total carbon emissions as the undesirable
output.
3.3.2 Measuring
Coordination Levels between Fairness and Efficiency of Carbon Emissions and the
Degree of Solidification through the Construction of a Markov Chain Model and a
Club Convergence Index
(1)
The Markov Model. We applied the concepts and methods proposed by Zhou et al.
[16] to discretize fairness (efficiency) of carbon emissions within four
categories: low, low-medium, high-medium, and high. Next, we calculated the
transition probability of fairness (efficiency) between categories. In
traditional distributed dynamic models, Markov Chain model usually only entails
a consideration of cases in which the duration of a step is 1 a.[17]
We constructed a transition probability matrix covering a period of several
years to examine the process of transition of regional carbon emissions
fairness (efficiency) over time and to develop a comprehensive knowledge base.
The following method was applied to construct the matrix.
The probability
value of Markov's transition probability matrix for d years was expressed as Pt,t+d
ij = {Xt+d = j??Xt = i}. Pt,t+d ij = {Xt+d = j??Xt = i}
indicates that after d years,
provinces categorized as type i will
transition to type j in the t-th year. The following equation was
used to estimate the transition probability:
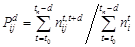 (2)
(2)
where
tn denotes the last period
of the investigation, nt,t+d ij denotes the sum of the number of regions that
belonged to type i in year t and subsequently transitioned to type j in year t+d over the period of the investigation, and nt i denotes the total number of regions where carbon emission fairness
(efficiency) is categorized as type i
in the t-th year. We constructed the
Markov transition probability matrix of d-year
duration based on an estimation of different types of transition probabilities
as expressed in equation (3) below:
where
the scale of the horizontal area of type i
is nd i, which is ??tn?Cd t=t0nt i in formula (2). In this equation, pd ii denotes the transition probability
of i-type regions remaining as i-types after d
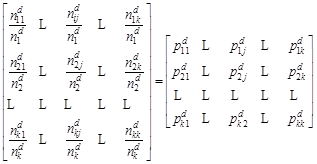 (3)
(3)
years.
A larger pd ii value indicates a
higher degree of solidification of regional discrepancies in carbon fairness
(efficiency) while also indicating the existence of club convergence. To
compare the degree of solidification of different indexes, we performed a chi-square
test.[18]
(2) A club
convergence index considering scale effect. To measure the solidification degree
of carbon emissions fairness and efficiency accurately, we constructed a club
convergence index on the basis of equation (3). This index
accounted for both the sizes of different types of regions (clubs) and the
degree of convergence within each club, thereby obtaining the overall degree of
club convergence. The following equation was used for the calculation:
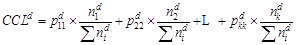 (4)
(4)
where
pd kk denotes the diagonal element in
equation (3), which indicates the degree of convergence of k-type clubs for a duration of d
years while nd
k/??nd i denotes the
proportion of the size of the k-type
club.
4 Results and
Validation
4.1 Data Composition
The
dataset comprised 10 tables that covered the following categories of data
compiled for 29 provinces in China for the period 1997?C2015. The details are
shown in table 1.
4.2 Data Products
4.2.1 Analysis of the Coordination of
Carbon Emissions Fairness and Efficiency: A Dynamic Perspective
We
used a Markov Chain model with variable durations to examine the transfer of regional
carbon emissions fairness and efficiency between different types. Table 2 shows
the transition probabilities for durations of one, three, and five years.
In general, the positions of various types of regions were relatively
fixed within the overall distribution. The phenomenon was especially apparent
in high-level and low-level regions. Horizontal comparison showed that low and
high levels of carbon emission efficiency were associated with higher degrees
of solidification. To better compare degrees of solidification of carbon fairness
and efficiency, it was necessary to calculate the overall solidification
degrees. We integrated solidification data for different level types of regions
at a regional scale and calculated club convergence index for durations of one
to five years using formula (4). Table 3 shows that club convergence index of
carbon emissions efficiency at any time exceeded the solidification degree of
carbon emissions fairness. We tested the significance of differences in
transfer probabilities to ensure the robustness of the results and calculated
the results in each case. Table 4 shows the transfer probability results for
durations of one, three, and five years.
Table 2 The Markov transfer probability result of carbon
emissions fairness and efficiency in China
|
Duration (a)
|
Type
|
Carbon emission fairness
|
Carbon emission efficiency
|
|
n
|
L
|
ML
|
MH
|
H
|
n
|
L
|
ML
|
MH
|
H
|
|
1
|
L
|
117
|
0.880,3
|
0.119,7
|
0.000,0
|
0.000,0
|
144
|
0.951,4
|
0.048,6
|
0.000,0
|
0.000,0
|
|
ML
|
135
|
0.088,9
|
0.844,4
|
0.066,7
|
0.000,0
|
108
|
0.111,1
|
0.777,8
|
0.111,1
|
0.000,0
|
|
MH
|
101
|
0.000,0
|
0.089,1
|
0.811,9
|
0.099,0
|
125
|
0.000,0
|
0.096,0
|
0.872,0
|
0.032,0
|
|
H
|
169
|
0.000,0
|
0.000,0
|
0.071,0
|
0.929,0
|
145
|
0.000,0
|
0.000,0
|
0.020,7
|
0.979,3
|
|
3
|
L
|
104
|
0.778,8
|
0.201,9
|
0.019,2
|
0.000,0
|
126
|
0.928,6
|
0.071,4
|
0.000,0
|
0.000,0
|
|
ML
|
120
|
0.150,0
|
0.716,7
|
0.116,7
|
0.016,7
|
98
|
0.234,7
|
0.571,4
|
0.193,9
|
0.000,0
|
|
MH
|
92
|
0.010,9
|
0.173,9
|
0.641,3
|
0.173,9
|
113
|
0.000,0
|
0.168,1
|
0.734,5
|
0.097,3
|
|
H
|
148
|
0.000,0
|
0.006,8
|
0.135,1
|
0.858,1
|
127
|
0.000,0
|
0.000,0
|
0.063,0
|
0.937,0
|
|
5
|
L
|
92
|
0.695,7
|
0.282,6
|
0.021,7
|
0.000,0
|
108
|
0.907,4
|
0.092,6
|
0.000,0
|
0.000,0
|
|
ML
|
104
|
0.182,7
|
0.653,8
|
0.144,2
|
0.019,2
|
88
|
0.284,1
|
0.443,2
|
0.261,4
|
0.011,4
|
|
MH
|
79
|
0.025,3
|
0.177,2
|
0.531,6
|
0.265,8
|
101
|
0.019,8
|
0.217,8
|
0.613,9
|
0.148,5
|
|
H
|
131
|
0.007,6
|
0.015,3
|
0.190,8
|
0.786,3
|
109
|
0.000,0
|
0.000,0
|
0.082,6
|
0.917,4
|
Note: L, ML, MH, and H are the
four levels of low, medium low, medium high, and high; n is number of samples.
Table 3 Club convergence index model of fairness
and efficiency of regional carbon emission reduction under different durations
|
Time
|
Duration (a)
|
Fairness of carbon
emission reduction
|
Efficiency of carbon
emission reduction
|
|
1997?C2015
|
K=1
|
0.873,6
|
0.904,2
|
|
K=3
|
0.760,8
|
0.808,2
|
|
K=5
|
0.682,3
|
0.736,5
|
Table 4 Solidification degree difference test of
fairness and efficiency of regional carbon emission
|
Duration (a)
|
Type
|
Q
|
df
|
c2
|
P
|
|
1
|
F-E
|
39.566,7
|
12
|
21.026,1
|
8.50E-05
|
|
E-F
|
37.631,8
|
11
|
19.675,1
|
9.00E-05
|
|
3
|
F-E
|
81.231
|
12
|
21.026,1
|
2.40E-12
|
|
E-F
|
74.203,6
|
12
|
21.026,1
|
5.20E-11
|
|
5
|
F-E
|
108.449,1
|
12
|
21.026,1
|
0.00E+00
|
|
E-F
|
96.747,6
|
12
|
21.026,1
|
2.40E-15
|
As shown in Table 4, there were significant
differences because the test results under different durations all invalidated
the null hypothesis and these differences continued to increase over time; this
finding was consistent with the results shown in Table 2.
4.2.2 Evaluation of the Carbon Emission Reduction
Potentials of Provinces in China According to Levels of Coordination of
Fairness and Efficiency
We constructed a club convergence index to evaluate the importance of
fairness and efficiency principles in investigation of regional carbon emission
reduction potential in China. The average values of club convergence index for
carbon emission fairness and efficiency over durations of one to five years
were 0.7687 and 0.81672 (in proportions of 0.4849 and 0.5151), respectively. Substituting
proportions as weights into formula (1), the results are shown in Table 5.
The results presented in Table 5 indicate that the carbon emission
reduction potential of most provinces has improved, as indicated by the level
of coordination of carbon emissions fairness and efficiency. These results
reveal that, in previous studies, the use of equal weights led to
underestimation of the carbon emission reduction potentials of most provinces.
Jiangxi, Sichuan, and Guizhou Provinces evidenced relatively large differences
in 1997, as did Jiangxi, Henan, Guangdong, Guangxi, Sichuan, and Gansu
Provinces in 2015. It reveals that weight adjustment for levels of coordination
of fairness and efficiency had a greater impact in these provinces. The carbon
emission reduction potential of provinces evidencing increased potential
(positive differences) was mainly driven by carbon emissions efficiency. Most
of the differences shown in Table 5 are positive, confirming that the solidification
problem relating to the efficiency of carbon emissions in China is of more
concern.
Table 5 Estimation of carbon emission reduction
potential in provinces of China based on the perspective of fairness and
efficiency coordination
|
|
1997
|
2015
|
|
Province
|
Coordination
|
Equality
|
Differience
|
Coordination
|
Equality
|
Differience
|
|
Beijing
|
0.651,9
|
0.649,7
|
+0.002,2
|
0.127,8
|
0.124,1
|
+0.003,7
|
|
Tianjin
|
0.479,3
|
0.481,1
|
?C0.001,8
|
0.432,3
|
0.426,1
|
+0.006,2
|
|
Heibe
|
0.532,5
|
0.526,5
|
+0.006,0
|
0.605,3
|
0.596,7
|
+0.008,6
|
|
Shanxi
|
0.955,2
|
0.956,5
|
?C0.001,3
|
0.814,9
|
0.810,5
|
+0.004,4
|
|
Nei Monggol
|
0.646,3
|
0.640,4
|
+0.005,9
|
0.980,5
|
0.981,1
|
?C0.000,6
|
|
Liaoning
|
0.224,2
|
0.231,2
|
?C0.007,0
|
0.153,1
|
0.157,9
|
?C0.004,8
|
|
Jilin
|
0.559,1
|
0.551,9
|
+0.007,2
|
0.547,9
|
0.537,6
|
+0.010,3
|
|
Heilongjiang
|
0.579,4
|
0.571,0
|
+0.008,4
|
0.534,2
|
0.523,7
|
+0.010,5
|
|
Shanghai
|
0.399,9
|
0.411,7
|
?C0.011,8
|
0.133,9
|
0.134,9
|
?C0.001,0
|
|
Jiangsu
|
0.411,9
|
0.405,2
|
+0.006,7
|
0.529,9
|
0.521,5
|
+0.008,4
|
|
Zhejiang
|
0.362,7
|
0.357,4
|
+0.005,3
|
0.483,3
|
0.473,6
|
+0.009,7
|
|
Anhui
|
0.486,5
|
0.474,9
|
+0.011,6
|
0.524,7
|
0.513,6
|
+0.011,1
|
|
Fujian
|
0.071,7
|
0.070,6
|
+0.001,1
|
0.388,2
|
0.380,4
|
+0.007,8
|
|
Jiangxi
|
0.449,6
|
0.437,1
|
+0.012,5
|
0.540,4
|
0.527,1
|
+0.013,3
|
|
Shandong
|
0.448,8
|
0.440,9
|
+0.007,9
|
0.596,2
|
0.587,6
|
+0.008,6
|
|
Henan
|
0.478,6
|
0.466,9
|
+0.011,7
|
0.572,2
|
0.559,7
|
+0.012,5
|
|
Hubei
|
0.487,3
|
0.477,5
|
+0.009,8
|
0.490,2
|
0.479,4
|
+0.010,8
|
|
Hunan
|
0.455,4
|
0.443,8
|
+0.011,6
|
0.483,6
|
0.471,7
|
+0.011,9
|
|
Guangdong
|
0.441,6
|
0.432,8
|
+0.008,8
|
0.489,4
|
0.476,9
|
+0.012,5
|
|
Guangxi
|
0.391,5
|
0.380,0
|
+0.011,5
|
0.503,5
|
0.490,8
|
+0.012,7
|
|
Chongqing
|
0.427,7
|
0.417,5
|
+0.010,2
|
0.423,2
|
0.414,0
|
+0.009,2
|
|
Sichuan
|
0.508,2
|
0.494,8
|
+0.013,4
|
0.509,3
|
0.496,1
|
+0.013,2
|
|
Guizhou
|
0.608,0
|
0.595,7
|
+0.012,3
|
0.624,4
|
0.612,7
|
+0.011,7
|
|
Yunnan
|
0.122,6
|
0.121,5
|
+0.001,1
|
0.193,9
|
0.190,7
|
+0.003,2
|
|
Shanxi
|
0.495,5
|
0.484,9
|
+0.010,6
|
0.636,7
|
0.627,1
|
+0.009,6
|
|
Gansu
|
0.494,7
|
0.483,6
|
+0.011,1
|
0.553,4
|
0.541,4
|
+0.012,0
|
|
Qinghai
|
0.529,6
|
0.517,9
|
+0.011,7
|
0.601,6
|
0.589,9
|
+0.011,7
|
|
Ningxia
|
0.562,2
|
0.556,1
|
+0.006,1
|
0.943,5
|
0.943,4
|
+0.000,1
|
|
Xingjiang
|
0.575,3
|
0.566,5
|
+0.008,8
|
0.747,4
|
0.740,0
|
+0.007,4
|
5 Discussion
and Conclusion
We
measured the efficiency of carbon reduction in 29 Chinese provinces for the
period 1997?C2015. To achieve this, we applied the Super SBM model,
incorporating undesirable outputs, and measured the fairness of regional per
capita carbon emissions. We subsequently applied the Markov Chain model to
calculate the carbon club convergence index values of efficiency and fairness,
with the aim of assessing their importance for China??s carbon reduction
potential, with an emphasis on carbon emissions. We recalculated the carbon
emission potential of each province based on levels of coordination of the
principles of fairness and efficiency, thereby providing scientifically based
inputs for the government??s formulation of measures to reduce carbon emissions.
The results indicated that the degree of carbon club convergence relating to
the efficiency of China??s regional carbon emissions was higher and that the
curing problem of long-term low efficiency of carbon emissions is of more
concern than the ??long-term problem of inequity. A second important finding
relates to the underestimation of China??s potential carbon emissions, which
will impact the allocation of carbon rights and the sharing of responsibility
for reducing emissions within the country.
Author Contributions
Zhou, D. designed the algorithm and is responsible
for the overall design of the dataset. Hua, S. R. collected data and wrote the
paper.
References
[1]
Janssen, M., Rotmans, J.
Allocation of fossil CO2, emission rights quantifying cultural perspectives
[J]. Ecological Economics, 1995,
13(1): 65-79.
[2]
Deng, J. X., Liu, X., Wang, Z.
Characteristics Analysis and Factor Decomposition Based on the Regional
Difference Changes in China's CO 2 Emission [J]. Journal of Natural Resources, 2014, 29(2): 189-200.
[3]
Munksgaard, J., Pedersen, K. A.
CO2, accounts for open economies: producer or consumer responsibility? [J]. Energy Policy, 2007, 29(4): 327-334.
[4]
Zhou, P., Ang, B. W. Linear
programming models for measuring economy?Cwide energy efficiency performance
[J]. Energy Policy, 2008, 36(8): 2911-2916.
[5]
Cao, K., Qu, X. E. Research on
regional carbon emissions performance evaluation and carbon reduction potential
in China [J]. China Population, Resources
and Environment, 2014, 24(8): 24-32.
[6]
Liu, Y. W., Hu, Z. Y. Research
on regional difference about carbon emission efficiency in China ?? Based on
three stage DEA [J]. Journal of Shanxi
University of Finance and Economics, 2015, 37(2): 23-34.
[7]
Yan,
D., Lei, Y. L., Li, L., et al. Carbon
emission efficiency and spatial clustering analyses in China??s thermal power
industry: Evidence from the provincial level [J]. Journal of Cleaner Production, 2017, 156: 518-527.
[8]
Fu, J. Y., Yuan, Z. L., Zeng,
P. Research on regional ecological efficiency in China: Measurement and determinants
[J]. Industrial Economic Review,
2016, 7(6): 85-97.
[9]
Song, J. K., Zhang, K. X., Cao,
Z. J. Provincial allocation of carbon emission quotas-under the fusion of
fairness and efficiency [J]. Journal of
Arid Land Resources and Environment, 2017, 31(5): 7-13.
[10]
Wu, X. R., Zhang, J. B., Tian,
Y., et al. Analysis on China's
Agricultural Carbon Abatement Capacity from the Perspective of Both Equity and
Efficiency [J]. Journal of Natural
Resources, 2015, 30(7): 1172-1182.
[11]
Wei, C., Ni, J. L., Du, L. M.
Regional allocation of carbon dioxide abatement in China [J]. China Economic Review, 2012, 23(3): 552-565.
[12]
Zhou, D.,
Hua, S. R. Potentialities dataset of carbon emission reduction based on per
capita and efficiency in provincial level of China [DB/OL]. Global Change
Research Data Publishing & Repository, 2019. DOI: 10.3974/
geodb.2019.05.15.V1.
[13] GCdataPR Editorial Office.
GCdataPR data sharing policy [OL]. DOI: 10.3974/dp.policy.2014.05 (Updated
2017).
[14]
Shan, H. J.
Reestimating the capital stock of China: 1952~2006 [J]. The Journal of Quantitative & Technical Economics, 2008,
25(10): 17-31.
[15]
Tone, K. Dealing with
undesirable outputs in DEA: a slacks based measure (SBM) approach [J]. GRIPS Research Report Seires, I?C2003-0005.
[16]
Zhou, D., Cheng, H. P.
Evolvement of Convergence and Spatial Patterns of Agricultural Modernization in
China [J]. Journal of South China
Agricultural University (Social Science Edition), 2015, 14(1): 25-35.
[17]
Pan, X. F., Liu, Q., Peng, X.
X. Spatial club convergence of regional energy efficiency in China [J]. Ecological Indicators, 2015, 51(4): 25-30.
[18]
Gallo, J. L. Space?Ctime
analysis of GDP disparities among European regions: A Markov chain approach
[J]. International Regional Science
Review, 2001, 27(2): 138-163.