Simulation Dataset on Daily Mean Temperature and Precipitation in East Asian Monsoon Area of China
Yang, C.
College of Global Change and Earth System Science, Beijing Normal University, Beijing 100875, China
Abstract: Based on daily observations and monthly outputs from 15 global climate models (GCMs) participating the Coupled Model Inter-comparison Project Phase 5 (CMIP5) for the historical and three Representative Concentration Pathways (RCP2.6, RCP4.5 and RCP8.5) scenarios, daily mean temperature and daily precipitation over six basins (Haihe River, Huaihe River, Liaohe River, Weihe River, Taihu Lake and Zhujiang River) in the East Asian monsoon area of China for the climate change scenarios were simulated, yielding the published dataset. Statistical downscaling models for each individual GCM were built by using generalized additive models (GAMs) or generalized linear models (GLMs) first, and then Bayesian model averaging (BMA) was applied to integrate the 15 fitted downscaling models. Finally, ensembles of daily mean temperature and daily precipitation on the 0.5°×0.5° grid over each basin under the historical (1970‒2000) and future (2020‒2050) emission scenarios were generated by stochastic simulations based on the BMA results. The dataset is able to reproduce extreme temperature and precipitation, which are rare events locating in tail ends of climatological distributions, therefore is useful for engineering design and hazard risk assessment in hydrology, ecology and environmental science.
Keywords: East Asian monsoon area; CMIP5; generalized additive models; Bayesian model averaging
1 Introduction
High-resolution climate data are necessary driving conditions for numerical models applied in hydrological, ecological and environmental fields. When used particularly for hydrological design or hazard risk assessment, climate data should be able to represent local extreme weather and climate conditions, e.g., extreme precipitation and temperature. From the probability distribution point of view, extreme weather and climate events are rare events locating in the tail parts of climatological distributions, and cannot be described by climatological averages in a deterministic way. Nevertheless, the pattern and uncertainty of the climatological distribution could be revealed by its ensemble of realizations via the stochastic simulation method. Under the background of climate change, regional climatological distribution is not only inhomogeneous in space, but also nonstationary in time. Therefore, statistical models describing the spatial-temporal variations of climate variables should be constructed first, and then realizations of climate variables could be simulated based on the fitted models.
In order to investigate the anthropogenic climate change, the Coupled Model Intercomparison Project Phase 5 (CMIP5) designed a series of experiments concerning historical and future greenhouse gas emission scenarios, indicated by Representative Concentration Pathways (RCPs)[1]. A multiple of global climate models (GCMs) participating the CMIP5
carried out the experiments, whose outputs had been the scientific basis for assessing the impacts of future climate change. GCMs are capable of simulating the large-scale patterns of atmospheric general circulation. If relevant output variables are associated with local climate variables through statistical models, then responses of local climate to the global climate change could be estimated. This is the so-called downscaling procedure[2]. With the downscaling models, realizations of climate variables changing with space and time can further be obtained by stochastic simulations.
Based on historical data of daily mean temperature and daily precipitation from stations in the six basins (Haihe River, Huaihe River, Liaohe River, Weihe River, Taihu Lake and Zhujiang River), and monthly outputs from 15 CMIP5 GCMs for the historical and three RCP scenarios (RCP2.6, RCP4.5 and RCP8.5), this work built downscaling models for each individual GCM first, and then integrate 15 of them by using the Bayesian model averaging (BMA)[3]. Ensembles of realizations of climate variables for the historical and the three
future emission scenarios were finally obtained by stochastic simulations. The downscaling models take full account of the spatial correlation structure of climate variables. The final distribution of a climate variable represented by its ensemble of realizations is resulted from not only the 15 distributions from individual downscaling models, but also the uncertainty arising from the inter-model differences as well.
2 Metadata of Dataset
The metadata of the simulation dataset on daily mean temperature and precipitation in East Asian monsoon area of China (EAMA-CMIP5-Tas&Pr)[4] is summarized in Table 1. It includes the dataset full name, short name, authors, year of the dataset, temporal resolution, spatial resolution, data format, data size, data files, data publisher, and data sharing policy, etc.
3 Methods
3.1 Data Collection or Processing
Training data for the downscaling model fitting consist of covariates and responses. Covariates data are monthly outputs from CMIP5 simulations for the historical emission scenario, downloaded from the distributed network of CMIP5 data nodes (https://esgf-node. llnl.gov/search/cmip5/)[5]. Responses data are daily mean temperature and daily precipitation data from observational stations, provided by China Meteorological Data Service Center (http://data.cma.cn/).
3.2 Algorithms
As stochastic variables, daily mean temperature and daily precipitation have quite different distributional properties. Daily mean temperature is approximately normally distributed, while daily precipitation is nonnegative but with a very large point mass of probability at zero, which can be described by the Tweedie distribution[7]. By trial and error, downscaling models for the two variables were built via different approaches: a single normally distributed generalized additive model (GAM)[8] was fitted to the multi-site daily mean temperature series from the whole basin, whereas a Tweedie-distributed generalized linear model (GLM)[9] was fitted to each single-site daily precipitation series from the basin. The randomized quantile residuals (RQR)[10] of the fitted downscaling models were used subsequently to build the spatial correlation models for daily mean temperature and daily precipitation, respectively, for the multivariate stochastic simulations at grid points over the basin. BMA was finally used to integrate downscaling models for GCMs by determining weights for individual models as probabilities for sampling a simulation result from candidate
models of the day. Refer to reference [11] for a detailed description of the methods.
3.3 Technology Roadmap
|
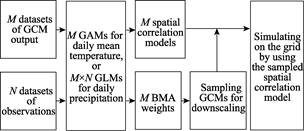
Figure 1 Technology roadmap of stochastic simulations of daily mean temperature and daily precipitation
|
The roadmap for generating the downscaled data by stochastic simulations is shown in Figure 1. By using monthly outputs from M GCMs and observational data from N stations with the basin, M GAMs for downscaling daily mean temperature, or M×N GLMs (i.e., one for each station) for downscaling daily precipitation are fitted first, and then M spatial correlation models are constructed by using RQRs from fitted models. Meanwhile, M weights are estimated by using BMA as probabilities for sampling the downscaling GCM of the day. Corresponding spatial correlation model to the sampled GCM is finally used for simulating daily mean temperature or daily precipitation on the grid over the basin of the day.
4 Results and Validation
4.1 Data Products
The products of stochastic simulations are 50-member ensembles of daily mean temperature and daily precipitation on the 0.5°×0.5° grid over each basin for the historical and RCP2.6, RCP4.5 and RCP8.5 emission scenarios, which are supposed to be able to reflect changes in distributions of climate variables and to capture the signals of changes in climate extremes. In addition, the 5th, 10th, 50th, 90th and 95th percentiles of ensembles (daily precipitation uses the last three only) are also provided. Data files of the dataset are listed in Table 2.
Figure 2 shows the long-term averages of daily mean temperature and annual precipitation over the historical period as their climatological normals for each basin.
Table 1 Metadata Summary of stochastic simulations of daily mean temperature and precipitation over basins in the East Asian monsoon area of China under the climate change scenarios
|
Items
|
Description
|
|
Dataset full name
|
Stochastic simulations daily mean temperature and precipitation dataset over basins in the East
Asian monsoon area of China under the climate change scenarios
|
|
Dataset short name
|
EAMA-CMIP5-Tas&Pr
|
|
Authors
|
Yang, C. E-4997-2017, College of Global Change and Earth System Science, Beijing Normal University, chi@bnu.edu.cn
|
|
Geographical region
|
Haihe River basin: 34.5°N‒42.5°N, 112.5°E‒119.5°E; Huaihe River basin: 30.5°N‒36.5°N, 111.5°E‒121.5°E; Liaohe River basin: 38.5°N‒45°N, 116.5°E‒125.5°E; Taihu Lake basin: 29.5°N‒32.5°N, 118.5°E‒121.5°E; Weihe River basin: 33.5°N‒37.5°N, 104°E‒110°E; East Zhujiang River basin: 20.5°N‒27.5°N, 109.5°E‒116.5°E; West Zhujiang River basin: 20.5°N‒27.5°N, 102.5°E‒109°E,
|
|
Year
|
Historical emission scenario: 1970‒2000; RCPx.x emission scenarios: 2020‒2050
|
|
Temporal resolution
|
1 day
|
|
Spatial resolution
|
0.5°×0.5°
|
|
Data format
|
.nc (NetCDF)
|
|
|
|
Data size
|
11.3 GB (after compression)
|
|
|
|
Data files
|
Data files are named in the format of [variable]_[basin]_[scenario]_[start year]-[end year].nc, in which [variable] is daily mean temperature (tas) or daily precipitation (pr), stored as a 4-dimensional array. The four dimensions are ensemble member (ens), time (time), latitude (lat) and longitude (lon). Each ensemble comprises 50 members. The ensemble uncertainty is characterized by the 5th, 10th, 50th, 90th and 95th percentiles of the ensemble (pr uses the last three only), whose variable names are q5, q10, q50, q90 and q95, all of which are 3-dimensional (time, lat and lon) arrays. Data files can be read directly by the GrADS software (http://cola.gmu.edu/grads/)
|
|
Foundation(s)
|
Ministry of Science and Technology of P. R. China (2010CB428400)
|
|
Data publisher
|
Global Change Research Data Publishing & Repository, http://www.geodoi.ac.cn
|
|
Address
|
No. 11A, Datun Road, Chaoyang District, Beijing 100101, China
|
|
Data sharing policy
|
Data from the Global Change Research Data Publishing & Repository includes metadata, datasets (data products), and publications (in this case, in the Journal of Global Change Data & Discovery). Data sharing policy includes: (1) Data are openly available and can be free downloaded via the Internet; (2) End users are encouraged to use Data subject to citation; (3) Users, who are by definition also value-added service providers, are welcome to redistribute Data subject to written permission from the GCdataPR Editorial Office and the issuance of a Data redistribution license, and; (4) If Data are used to compile new datasets, the ‘ten percent principal’ should be followed such that Data records utilized should not surpass 10% of the new dataset contents, while sources should be clearly noted in suitable places in the new dataset[6]
|
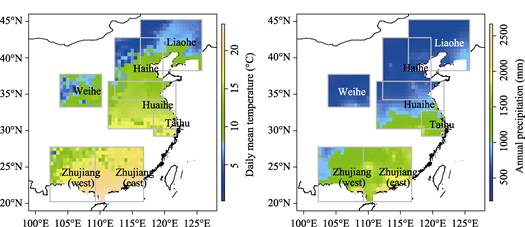
Figure 2Long-term averages of daily mean temperature and annual precipitation over the historical period 1970-2000
Table 2 Data files of the dataset
|
Basin
|
Daily mean temperature
|
Daily precipitation
|
|
Haihe River
|
tas_haihe_historical_1970-2000.nc
tas_haihe_rcp26_2020-2050.nc
tas_haihe_rcp45_2020-2050.nc
tas_haihe_rcp85_2020-2050.nc
|
pr_haihe_historical_1970-2000.nc
pr_haihe_rcp26_2020-2050.nc
pr_haihe_rcp45_2020-2050.nc
pr_haihe_rcp85_2020-2050.nc
|
|
Huaihe River
|
tas_huaihe_historical_1970-2000.nc
tas_huaihe_rcp26_2020-2050.nc
tas_huaihe_rcp45_2020-2050.nc
tas_huaihe_rcp85_2020-2050.nc
|
pr_huaihe_historical_1970-2000.nc
pr_huaihe_rcp26_2020-2050.nc
pr_huaihe_rcp45_2020-2050.nc
pr_huaihe_rcp85_2020-2050.nc
|
|
Liaohe River
|
tas_liaohe_historical_1970-2000.nc
tas_liaohe_rcp26_2020-2050.nc
tas_liaohe_rcp45_2020-2050.nc
tas_liaohe_rcp85_2020-2050.nc
|
pr_liaohe_historical_1970-2000.nc
pr_liaohe_rcp26_2020-2050.nc
pr_liaohe_rcp45_2020-2050.nc
pr_liaohe_rcp85_2020-2050.nc
|
|
Taihu Lake
|
tas_taihu_historical_1970-2000.nc
tas_taihu_rcp26_2020-2050.nc
tas_taihu_rcp45_2020-2050.nc
tas_taihu_rcp85_2020-2050.nc
|
pr_taihu_historical_1970-2000.nc
pr_taihu_rcp26_2020-2050.nc
pr_taihu_rcp45_2020-2050.nc
pr_taihu_rcp85_2020-2050.nc
|
|
Weihe River
|
tas_weihe_historical_1970-2000.nc
tas_weihe_rcp26_2020-2050.nc
tas_weihe_rcp45_2020-2050.nc
tas_weihe_rcp85_2020-2050.nc
|
pr_weihe_historical_1970-2000.nc
pr_weihe_rcp26_2020-2050.nc
pr_weihe_rcp45_2020-2050.nc
pr_weihe_rcp85_2020-2050.nc
|
|
Zhujiang River (east)
|
tas_zhujiang-east_historical_1970-2000.nc
tas_zhujiang-east_rcp26_2020-2050.nc
tas_zhujiang-east_rcp45_2020-2050.nc
tas_zhujiang-east_rcp85_2020-2050.nc
|
pr_zhujiang-east_historical_1970-2000.nc
pr_zhujiang-east_rcp26_2020-2050.nc
pr_zhujiang-east_rcp45_2020-2050.nc
pr_zhujiang-east_rcp85_2020-2050.nc
|
|
Zhujiang River (west)
|
tas_zhujiang-west_historical_1970-2000.nc
tas_zhujiang-west_rcp26_2020-2050.nc
tas_zhujiang-west_rcp45_2020-2050.nc
tas_zhujiang-west_rcp85_2020-2050.nc
|
pr_zhujiang-west_historical_1970-2000.nc
pr_zhujiang-west_rcp26_2020-2050.nc
pr_zhujiang-west_rcp45_2020-2050.nc
pr_zhujiang-west_rcp85_2020-2050.nc
|
4.2 Validation
The stochastic simulation results were validated by using ensemble mean, standard deviation, extremes, etc. in terms of spatial pattern, seasonal variation and inter-annual variation (refer to [11] for details). Figure 3 shows changes in daily mean temperature and annual precipitation spatially averaged over individual basins and temporally averaged over the period 2031-2050, relative to the base period 1981-2000. It can be seen that the daily mean temperature increases in all basins, most pronounced under the RCP8.5 scenario, with the greatest increase as 0.94 °C in the east Zhujiang River basin. The least increase occurs in the Taihu Lake basin as 0.20 °C under the RCP2.6 scenario. Except for the east Zhujiang River basin, annual precipitation also increases, most pronounced under the RCP8.5 scenario, with the greatest increase as 291.3 mm in the west Zhujiang River basin. Annual precipitation in the east Zhujiang River basin decreases under all the future scenarios, as the most pronounced as 28.3 mm under the RCP2.6 scenario.
5 Discussion and Conclusion
This dataset was generated by using several complicated statistical models, such as Tweedie distribution, GAM, GLM, BMA and Kriging, with intensive computation. It is supposed to be able to reflect changes in distributions of climate variables at daily scale and their uncertainties resulted from multi-model predictions, particularly signals of changes in climate extremes. The dataset can be used in the fields of hydrology, ecology and environmental
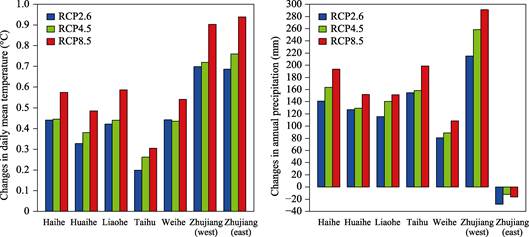
Figure 3 Changes in daily mean temperature and annual precipitation spatially averaged over individual basins and temporally averaged over the period 2031-2050, relative to the base period 1981-2000
science, serving hydrological design, hazard risk assessment, etc. A drawback of the dataset is that there might be inconsistence in data in the overlapped part or at the border of two basins. There are still potentials for improving the models and algorithms, subject to available computing ability. Analysis of the dataset shows that, under the three RCP scenarios, daily mean temperature averaged over 2031-2050 increases in all basins relative to the base period 1981-2000, most pronounced under RCP8.5, and so does the annual precipitation in basins except for the east Zhujiang River Basin. Annual precipitation in the east Zhujiang River Basin decreases in the future, most pronounced under RCP2.6.
References
[1] Taylor, K. E., Stouffer, R. J., Meehl, G. A. An overview of CMIP5 and the experiment design [J]. Bulletin of the American Meteorological Society, 2012, 93: 485-498.
[2] Schoof, J. T. Statistical downscaling in climatology [J]. Geography Compass, 2013, 7(4): 249-265.
[3] Raftery, A. E., Gneiting, T., Balabdaoui, F., et al. Using Bayesian model averaging to calibrate forecast ensembles [J]. Monthly Weather Review, 2005, 133: 1155-1174.
[4] Yang, C. Stochastic simulations daily mean temperature and precipitation dataset over basins in the East Asian Monsoon Area of China under the climate change scenarios [DB/OL]. Global Change Research Data Publishing & Repository, 2018. DOI: 10.3974/geodb.2018.01.02.V1.
[5] https://esgf-node.llnl.gov/search/cmip5/.
[6] GCdataPR Editorial Office. GCdataPR Data Sharing Policy [OL]. DOI: 10.3974/dp.policy.2014.05 (Updated 2017).
[7] Dunn, P. K. Occurrence and quantity of precipitation can be modelled simultaneously [J]. International Journal of Climatology, 2004, 24: 1231-1239.
[8] Hastie, T. J., Tibshirani, R. J. Generalized Additive Models [M]. London: Chapman and Hall, 1990.
[9] McCullagh, P., Nelder, J. A. Generalized Linear Models (2nd Edition) [M]. London: Chapman and Hall, 1989.
[10] Dunn, P. K., Smyth, G. K. Randomized quantile residuals [J]. Journal of Computational and Graphical Statistics, 1996, 5(3): 236-244.
[11] Yang, C. Stochastic Simulation of Climate Variables under the Climate Change Scenarios [M]. Duan, Q. Y., Xu, Z. X., et al. (eds). Predictions of Future Hydroclimate Scenarios and Uncertainty Analysis and Quantification. Beijing: Science Press, 2017: 73-95.