Spatio-temporal Precipitation Dataset in Hengduan Mountains (1998–2012)
Zhang, T.1,2 Li, B. L.1,2* Yuan, Y. C.1 Gao, X. Z.1 Jiang, Y. H.1,2 Liu, Y.1,2
1. State Key Laboratory of Resources and Environmental Information Systems, Institute of Geographic Sciences and Natural Resources Research, Chinese Academy of Sciences, Beijing 100101, China;
2. University of Chinese Academy of Sciences, Beijing 100049, China
Abstract: The “Spatial-temporal precipitation dataset inHengduan Mountains (1998–2012) includes the corrected Tropical Rainfall Measuring Mission (TRMM) 3B43 precipitation estimates (1998–2012) based on rainfall observations from rain gauges and related contrasting or auxiliary data. The corrected TRMM data are produced based on a linear regression calibration method for each sub-region, which was published in the Journal of Natural Resources. This calibration technique includes three steps. (1) Zoning the study area into multiple sub-regions using ISODATA clustering and the maximum likelihood method and to ensure that there is at least one rain gauge in each sub-region. (2) A linear regression equation is established using months as the time analysis unit for each sub-region, where the rain gauge precipitation is the dependent variable and the TRMM precipitation estimation is the independent variable. (3) For each grid point, the TRMM precipitation estimation is modified using the regression equation for its sub-region. The results show that the accuracy of the revised TRMM 3B43 data is significantly improved. Among the 38 meteorological stations, the number of stations with relative deviations greater than 10% is reduced from 16 to 8, corresponding to a decrease from 42.1% to 21.1% of the total number of stations. In addition, the number of stations with relative deviations greater than 20% is reduced from 12 to 3, corresponding to a decrease from 31.6% to 7.9% of the total number of stations. The dataset is stored in the WGS84 coordinate system as vector data in a .shp format and raster data in a grid format.
Keywords:precipitation; TRMM satellite; data correction; Hengduan Mountains
1 Introduction
Acquisition of accurate spatially- and temporally-distributed precipitation information is of great importance in hydrology, meteorology, and climatology. In addition to factors such as the atmospheric circulation and land-sea location, precipitation in mountain areas is primarily affected by the underlying topography, which has very strong spatial and temporal heterogeneities. Precipitation based on satellite remote sensing inversion has the advantage of continuous observations over large-scale regions. These data can overcome the spatial distribution and extent limitations from ground-based rain gauges and rainfall radars and better reflect the spatial and temporal distribution characteristics of precipitation in mountainous areas. However, the accuracy of satellite precipitation data includes spatial heterogeneity. Specifically, in mountainous areas with a complex terrain, the spatial and temporal distribution characteristics of precipitation are also complex. Therefore, there is uncertainty when directly using satellite precipitation inversion data for relative application analyses[1‒2]. Therefore, it is necessary to revise the satellite precipitation inversion products to reflect more accurately the spatial and temporal distribution characteristics of regional precipitation [3‒4].
The “Spatial-temporal precipitation dataset inHengduan Mountains (1998–2012)”[5]was produced using the widely available TRMM 3B43 V7 data product (0.25°×0.25°)[6–7]. As this data product has a poor accuracy, it is assumed that the distribution information of the precipitation reflected in this data product has systematic deviations from the real surface precipitation for different spatial sub-regions. The zonal monthly regression method is therefore used to revise the TRMM data, i.e., the unsupervised classification of TRMM data based on the ISODATA dynamic clustering method and maximum likelihood method[8]. The study area is divided into different sub-regions based on these clusters. In each sub-region, a linear regression equation between the real precipitation and the TRMM precipitation estimation is established using ground-based station data, and the TRMM data are subsequently revised using this equation. The revised product is compared with the results generated from the ground site interpolation method for validation.
2 Metadata of Dataset
The metadata for the “Spatial-temporal precipitation dataset inHengduan Mountains (1998–2012)”[5] is summarized in Table 1. It includes the full name, short name, authors, year, temporal resolution, spatial resolution, data format, data size, data files, data publisher, data sharing policy, etc.
3 Methods
3.1 Algorithm Principle
The Hengduan Mountains are controlled by variable atmospheric circulations, so the spatial and temporal distribution of precipitation varies greatly with the different months and seasons[10–11]. The accuracy of the TRMM precipitation estimation in the Hengduan Mountains is also affected by the spatial and temporal precipitation distribution. The algorithm assumes that the same precipitation formation mechanism exists in the spatial units with more consistent spatial and temporal variations in the precipitation. Therefore, corrective models are established in the spatial units to reduce the impact of spatial and temporal variability in the precipitation for the correction model, thereby improving the accuracy of the estimation. The Hengduan Mountains are initially divided into several sub-regions with similar spatial distribution patterns for precipitation. The regression equation between the TRMM precipitation and ground measured precipitation is then established for each sub-region. Finally, the TRMM precipitation lattice values are revised based on the regression equation for each sub-region.
Table 1 Metadatasummary for the “Spatial-temporal precipitation dataset inHengduan Mountains(1998–2012)
|
Items
|
Description
|
|
Dataset full name
|
Spatial-temporal precipitation dataset in Hengduan Mountains (1998–2012)
|
|
Dataset short name
|
SpaTempPrecipHengduanMt1998_2012
|
|
Authors
|
Zhang, T. N-8690-2019, State Key Laboratory of Resources and Environmental Information Systems, Institute of Geographic Sciences and Natural Resources Research, Chinese Academy of Sciences, zhangtao@lreis.ac.cn
Li, B. L. N-8884-2019, State Key Laboratory of Resources and Environmental Information Systems, Institute of Geographic Sciences and Natural Resources Research, Chinese Academy of Sciences, libl@lreis.ac.cn
He, Y. Q., Cold and Arid Regions Environmental and Engineering Research Institute,Chinese Academy of Sciences, yqhe@lzb.ac.cn
Du, J. K., Cold and Arid Regions Environmental and Engineering Research Institute,Chinese Academy of Sciences, djklzu2008@163.com
Niu, H. W., Cold and Arid Regions Environmental and Engineering Research Institute,Chinese Academy of Sciences, niuhw11@lzu.edu.cn
Xin, H. J., Cold and Arid Regions Environmental and Engineering Research Institute,Chinese Academy of Sciences, xinhj642@163.com
|
|
Geographical region
|
24.5°N–34.5°N, 93.5°E–104.5°E. There are 38 counties or cities located in western Sichuan Province, northwestern Yunnan Province, and southeastern Tibet
|
|
Year
|
1998–2012
|
|
Temporal resolution
|
3 months
|
Spatial resolution
|
0.25°×0.25°
|
Data format
|
.shp, Grid
|
|
Data size
|
773 KB (after compression)
|
|
Data files
|
The dataset includes six folders and one Excel file:
(1) 1_StudyArea_Stations; (2) Folder ‘2_1_CorrectedTRMMdata_1998–2012’; (3) Folder ‘2_2_CorrectedAverageTRMMdata’; (4) Folder ‘2_3_Kriging_StationData’; (5) Folder ‘2_4_RainfallTendencyRate’ includes seven grid files. These are Ann_RTR, Spr_RTR, Sum_RTR, Aut_RTR, Win_RTR, Mon_RTR, and Umon_RTR; (6) Folder ‘2_4_SignificantLevel’; (7) file ‘Attachment.xlsx’
|
|
Foundations
|
Ministry of Science and Technology of P. R. China (2016YFC0500205, 2015CB954103)
|
|
Data publisher
|
Global Change Research Data Publishing & Repository, http://www.geodoi.ac.cn
|
|
Address
|
No. 11A, Datun Road, Chaoyang District, Beijing 100101, China
|
|
Data sharing policy
|
Data from the Global Change Research Data Publishing & Repository includes metadata, datasets (data products), and publications (in this case, in the Journal ofGlobal Change Data & Discovery). Datasharing policy includes: (1) Data are openly available and can be free downloaded via the Internet; (2) End users are encouraged to use Data subject to citation; (3) Users, who are by definition also value-added service providers, are welcome to redistribute Data subject to written permission from the GCdataPR Editorial Office and the issuance of a Data redistribution license; and (4) If Data are used to compile new datasets, the ‘ten percent principal’ should be followed such that Data records utilized should not surpass 10% of the new dataset contents, while sources should be clearly noted in suitable places in the new dataset[9]
|
3.2 Technical Route
The TRMM precipitation correction products from 1998 to 2012 are produced using the zonal monthly regression method (Figure 1). This method includes three primary steps. (1) Determination of the spatial and temporal analysis units. Unsupervised classification is used to divide the study area into different sub-regions as the spatial analysis unit of the TRMM data revision, and to ensure that each spatial unit contains at least one meteorological station. The units of “month” are used for the time analysis to ensure that the precipitation in the analysis period has similar spatially distributed patterns. (2) Establishment of a statistical regression model. A regression equation is established for each month in every sub-region with the observed station precipitation as the dependent variable and the TRMM precipitation estimation as the independent variable. (3) Use of the regression model to revise the precipitation. For any grid point, the TRMM precipitation estimation is modified using the regression equation for a given sub-region.
The ISODATA dynamic clustering method and maximum likelihood method are used to divide the spatial analysis units, where the specific steps are as follows. (1) Unsupervised classification of grid points. The ISODATA clustering method is used to classify the TRMM data. (2) Determine the classification of unclassified grid points. The maximum likelihood method is used to assign grid points, which are still undetermined after iterating the ISODATA algorithm to the categories that are most similar to the precipitation variation characteristics. (3) Post classification. In the same cluster, the sub-regions are divided, according to the meteorological stations, into different blocks, and the rest are marked as sub-regions nearest the meteorological stations.
The precipitation tendency rate and its significance level data from 1998 to 2012 are generated using linear regression between the revised TRMM data and the time at each grid point. The interpolated precipitation product for 1998–2012 is generated based on the cumulative precipitation of the meteorological stations in the study area of the corresponding period. The Kriging interpolation is applied for the spatial sub-divisions (Figure 1).
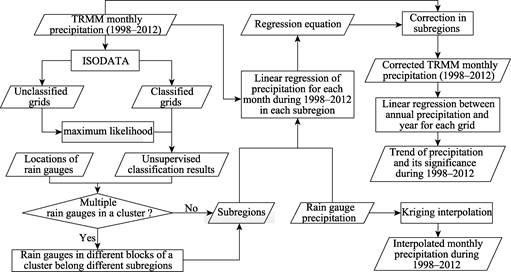
Figure 1 Workflow of the dataset development
4 Results and Validation
The dataset includes six folders and one Excel file:
(1) Folder ‘1_StudyArea_Stations’ includes two subfolders, i.e., ‘StudyArea’ and ‘Stations_HDMt’, which contains StudyArea.shp representing the extent of the study area, and Stations_HDMt.shp representing the locations of rain gauges.
(2) Folder ‘2_1_CorrectedTRMMdata_1998–2012’ includes grid files from 1998 to 2012. These are rhdm_1998, rhdm98_spr, rhdm98_sum, rhdm98_aut, rhdm98_win, rhdm98_mon, and rhdm98_umon represent the corrected TRMM 3B43 precipitation estimates for the annual, spring, summer, autumn, winter, growing season, and non-growing season in 1998, respectively. The units are in mm.
(3) Folder ‘2_2_CorrectedAverageTRMMdata’ includes seven grid files. These are Ann_ave, Spr_ave, Sum_ave, Aut_ave, Win_ave, Mon_ave, and Umon_ave, which represent the average precipitation for the annual, spring, summer, autumn, winter, growing season, and non-growing season, respectively, during 1998–2012 based on the corrected TRMM 3B43 accumulated precipitation estimates. The units are in mm.
(4) Folder ‘2_3_Kriging_StationData’ includes seven grid files. These are Ann_kriging, Spr_kriging, Sum_kriging, Aut_kriging, Win_kriging, Mon_kriging, and Umon_kriging, which represent the average precipitation of annual, spring, summer, autumn, winter, growing season, and non-growing season, respectively, during 1998–2012 based on Kriging interpolated accumulated precipitation estimates. The units are mm.
(5) Folder ‘2_4_RainfallTendencyRate’ includes seven grid files. These are Ann_RTR, Spr_RTR, Sum_RTR, Aut_RTR, Win_RTR, Mon_RTR, and Umon_RTR, which represent the precipitation trend rate of annual, spring, summer, autumn, winter, growing season, and non-growing season, respectively, during 1998–2012 based on corrected TRMM 3B43 accumulated precipitation estimates. The units are in mm/a.
(6) Folder ‘2_4_SignificantLevel’ includes seven grid files. These are Ann_sig, Spr_sig, Sum_sig, Aut_sig, Win_sig, Mon_sig, and Umon_sig, which represents the significance of precipitation trend rate of annual, spring, summer, autumn, winter, growing season, and non-growing season, respectively, during 1998–2012 based on the corrected TRMM 3B43 accumulated precipitation estimates.
(7) The Excel file ‘Attachment.xlsx’ includes two tables, i.e., Tab. 1 and Tab. 2. The Tab. 1 records the monthly precipitation for the 38 rain gauge observations in the Hengduan Mountains during 1998–2012. The Tab. 2 records the monthly precipitation estimates for the 38 rain gauge-related TRMM grids from 1998–2012.
4.1 Spatial Distributionof Data
Figure 2 shows the spatial distribution for the average annual precipitation in Hengduan Mountains from 1998 to 2012. It is indicated that the revised TRMM precipitation has similar spatial distribution characteristics with the precipitation generated using the interpolation based on the observed data. However, the revised TRMM precipitation contains additional spatial details. The dataset shows that the precipitation decreases gradually from the southeast to the northwest of the study area, and the locations of the high and low precipitation centers are similar. However, the revised TRMM precipitation more accurately reflects the distributions for areas that do not contain rain gauges, especially near the edges of the study area.
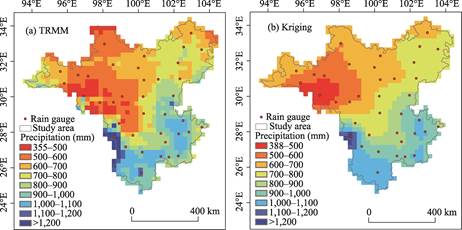
Figure 2 Spatial distribution for the average annual precipitation during 1998–2012 in the Hengduan Mountains using the (a) TRMM and (b) Kriging interpolation[4]
Figure 3 shows the spatial distributions for the annual precipitation tendency rate in the Hengduan Mountains from 1998 to 2012. The annual precipitation in this area has a decreasing trend. The area where precipitation decreases is located in the south, central, and western regions of the study area, and most of the areas where precipitation decreases can reach a significance level of 0.05. The area where precipitation shows an increasing trend is in the northeastern part of the study area, although the trend is not significant.
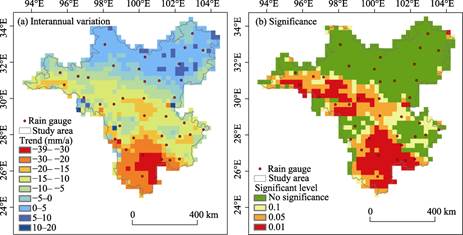
Figure 3 Spatial distribution of the (a) interannual variations and (b) the significance of the precipitation from 1998 to 2012 in the Hengduan Mountains[4]
 4.2 Data Validation
Figure 4 shows the spatial distribution for the relative errors of the TRMM 3B43 average annual precipitation estimation in the Hengduan Mountains from 1998 to 2012. For most of the stations, the revised TRMM mean annual precipitation shows smaller relative errors with significantly improved accuracy. The number of stations with relative errors greater than 10% decreases from 16 to 8, corresponding to a reduction from 21.1% to 42.1% of the total number of stations. The number of stations with relative deviations greater than 20% decreases from 12 to 3, corresponding to a reduction from 7.9% to 31.6% of the total number of stations. The relative errors of the severely overestimated stations of Baju, Luolong, and Zuogong decrease from 129.2%, 76.2%, and 65.9% to 37.7%, 21.1%, and 14.6%, respectively.
5 Discussion and Conclusion
The generation algorithm for this dataset mainly considers the spatio-temporal heterogeneity of the precipitation formation mechanism. Using unsupervised classification, a relatively consistent spatio-temporal unit (sub-region) for precipitation is obtained. In each sub-region, a regression model is established to correct the TRMM data based on the observed precipitation on the ground. This improves the accuracy of the correction results and provides better information to analyze the spatio-temporal distribution characteristics of the precipitation in the region.
The dataset generation algorithm does not consider the topographic or geomorphological factors of the region; the meteorological stations data are basically point-based. Possible, the data do not match in scale and have uncertainty obviously.
Author Contributions
Li, B. L. and Zhang, T. created the overall design for the data collection development; Jiang, Y. H. and Liu, Y. collected and processed the meteorological station and TRMM precipitation estimation data; Zhang, T. and Yuan, Y. C. designed the model and algorithm; Gao, X. Z. performed data verification; Zhang, T. and Li, B. L. wrote the data paper.
References
[1] Zeng, H. W., Li, L. J. Accuracy validation of TRMM 3B43 data in Lancang River Basin [J]. Acta Geographica Sinica, 2011, 66(7): 994–1004.
[2] Zhu, G. F., Pu, T., Zhang, T., et al. The accuracy of TRMM precipitation data in Hengduan Mountainous region, China [J]. ScientiaGeographica Sinica, 2013, 33(9): 1125–1131.
[3] Zhang, T., He, Y., Ma, J., et al. Spatial and temporal distribution of precipitation based on corrected TRMM data around the Hexi Corridor, China [J]. Sciences in Cold and Arid Regions, 2014, 6(2): 159–167.
[4] Zhang, T., Li, B. L., He, Y. Q., et al. Spatial and temporal distribution of precipitation based on corrected TRMM data in Hengduan Mountains [J]. Journal of Natural Resources, 2015, 30(2): 260–270.
[5] Zhang, T., Li, B. L., He, Y. Q., et al. Spatial-temporal precipitation dataset in Hengduan Mountains (1998–2012) [DB/OL]. Global Change Research Data Publishing & Repository, 2016. DOI: 10.3974/geodb.2016.06.06.V1.
[6] Kummerow, C., Barnes, W. The tropical rainfall measuring mission (TRMM) sensor package [J]. Journal of Atmospheric and Oceanic Technology, 1998, 15: 809–817.
[7] Huffman, G. J., Bolvin, D. T., Nelkin, E. J., et al. The TRMM multisatellite precipitation analysis (TMPA): Quasi-global, multiyear, combined-sensor precipitation estimates at fine scales [J]. Journal of Hydrometeorology, 2007, 8(1): 38–55.
[8] Hu, K. H., Cui, P., Han, Y. S., et al. Susceptibility mapping of landslides and debris flows in 2008 Wenchuan earthquake by using cluster analysis and maximum likelihood classification methods [J]. Science of Soil and Water Conservation, 2012, 10(1): 12–18.
[9] GCdataPR Editorial Office. GCdataPR data sharing policy [OL]. DOI: 10.3974/dp.policy.2014.05 (Updated 2017).
[10] Li, J. J., Su, Z. Glaciers in Hengduan Mountains [M]. Beijing: Science Press, 1996.
[11] Li, Z. X., He, Y. Q., Xin, H. J., et al. Spatio-temporal variations of temperature and precipitation in Mts. Hengduanregion during 1960–2008 [J]. Acta Geographica Sinica, 2010, 65(5): 563–579.