Dataset of Typical Drought Disaster and its Impacts on the Terrestrial Vegetation in the Southeast America, 2007
Yang, J. H. Wu, J. J.*
Faculty of Geographical Science, Beijing Normal University, Beijing 100875, China
Abstract: In order to study the impacts of typical drought disaster on terrestrial vegetation, we selected the drought event in the Southeast America that occurred from February 2007 to December 2007 based on the standard precipitation evapotranspiration index (SPEI). And then we got the datasets by analyzing the Global Land Surface Satellite (GLASS) leaf area index (LAI) and the Fraction of Absorbed Photosynthetically Active Radiation (FAPAR) data. The datasets includes: (1) the drought degree data, LAI anomalies, FAPAR anomalies from February to December in 2007 in the Southeast America and the drought severity index, the accumulation of LAI anomalies, the accumulation of the FAPAR anomalies during the drought periods. The data has a spatial resolution of 0.01° and a temporal resolution of 1 month; (2) the monthly LAI anomalies, FAPAR anomalies at different land covers and the 3-month scale SPEI from 2001 to 2014 in the area; (3) the multi-year (2001-2014) monthly average data of LAI anomalies, FAPAR anomalies of different vegetation and 3-month scale SPEI in the region; (4) the border file of this region. The dataset is stored in the .tif, .dbf, .prj, .sbn, .sbx, .shp, .shx and .txt formats. The results showed that: different vegetations all had affected when the drought is severe; but the response among different vegetations to the drought was different. The forest was less affected by drought; at the same time, the response of vegetation to the drought disaster existed a delay.
Keywords: drought; vegetation; LAI anomalies; FAPAR anomalies; SPEI; the Southeast America
1 Introduction
There are great impacts on terrestrial vegetation when drought disasters occur with different responses of the diverse vegetation[1–2]. The typical drought disaster on different vegetation occurred in the Southeast America in 2007 was analyzed based on the standardized precipitation evapotranspiration index (SPEI)[3], emergency events database (EM-DAT) and the LAI and FAPAR product of GLASS[4–5].
2 Metadata of Dataset
The metadata of the drought degree and its impacts on vegetation dataset in the Southeast America (2007)[6] are summarized in Table 1, including the dataset full name, short name, authors, geographical region, year, temporal resolution, spatial resolution, data format, data size, data files, data publisher, data sharing policy, etc.
Table 1 Metadata summary of the drought degree and its impacts on vegetation dataset in the Southeast America (2007)
|
Items
|
Description
|
|
Dataset full name
|
The drought degree and its impacts on vegetation dataset in Southeast America (2007)
|
|
Dataset short name
|
DroughtVegSEAmerica2007
|
|
Authors
|
Wu, J. J. Q-1391-2017, Faculty of Geographical Science, Beijing Normal University, jjwu@mail.bnu.edu.cn
Yang, J. H. N-3427-2018, Faculty of Geographical Science, Beijing Normal University, yangjh15@mail.bnu.edu.cn
|
|
Geographical region
|
the Southeast America
|
|
Year
|
2001-2014
|
|
Temporal resolution
|
0.01° Spatial resolution 1 month
|
|
Data format
|
.tif, .dbf, .prj, .sbn, .sbx, .shp, .shx, .txt Data size 69.7 MB (after compression)
|
|
Data files
|
The dataset includes:
(1) boundary shp folder: store the vector border file of the study area, the data format is .shp
(2) drought degree folder: store the drought degree data from February to December in 2007 of the study area, the data format is .tif, the time resolution is 1 month, the spatial resolution is 0.01°, the invalid value is -99, and the numbers 1-5 represent extreme drought, severe drought, mild drought, moderate drought and no drought
(3) LAI anomaly folder: store the monthly LAI anomaly data from February to December in 2007 of the study area, the data format is .tif, the time resolution is 1 month, the spatial resolution is 0.01°, the invalid value is 255, and the scale factor is 0.1
(4) LAI anomaly accumulated value folder: store the accumulation of the LAI anomalies at the drought period in this region, the data format is .tif, the spatial resolution is 0.01°, the invalid value is 255, and the scale factor is 0.1
(5) FAPAR anomaly folder: store the monthly FAPAR anomaly data from February to December in 2007 of the study area, the data format is .tif, the time resolution is 1 month, the spatial resolution is 0.01°, the invalid value is 255, and the scale factor is 0.1
(6) FAPAR anomaly accumulated value folder: store the accumulation of the FAPAR anomalies at the drought period in this region, the data format is .tif, the spatial resolution is 0.01°, the invalid value is 255, and the scale factor is 0.1
(7) .xlsx file: store the statistic information of different land cover’s response to the drought disaster, the data format is .xlsx
|
|
Foundation
|
Ministry of Science and Technology of P. R. China (2016ST0010)
|
|
Data publisher
|
Global Change Research Data Publishing & Repository, http://www.geodoi.ac.cn
|
|
Address
|
No. 11A, Datun Road, Chaoyang District, Beijing 100101, China
|
|
Data sharing policy
|
Data from the Global Change Research Data Publishing & Repository includes metadata, datasets (data products), and publications (in this case, in the Journal of Global Change Data & Discovery). Data sharing policy includes: (1) Data are openly available and can be free downloaded via the Internet; (2) End users are encouraged to use Data subject to citation; (3) Users, who are by definition also value-added service providers, are welcome to redistribute Data subject to written permission from the GCdataPR Editorial Office and the issuance of a Data redistribution license, and; (4) If Data are used to compile new datasets, the ‘ten percent principal’ should be followed such that Data records utilized should not surpass 10% of the new dataset contents, while sources should be clearly noted in suitable places in the new dataset[7]
|
3 Methods
3.1 Algorithm
We identified the drought events based on the SPEI, and then we calculated the LAI anomalies and FAPAR anomalies by the anomaly analysis to study the impacts of drought disasters on vegetation. The vegetation anomalies were calculated by the follow equtations:
 (1)
(1)
 (2)
(2)
Since drought is a continuous process, the drought severity index can reflect the overall severity of the drought. Drawing lessons from the calculation methods of the drought severity index[8–9] , the accumulation of LAI anomalies and the accumulation of FAPAR anomalies were defined and calculated as indicators of the cumulative effects of drought events on terrestrial vegetation. The cumulative value of vegetation index anomalies is calculated as follows:
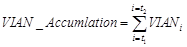 (3)
(3)
3.2 Technical Workflow
|
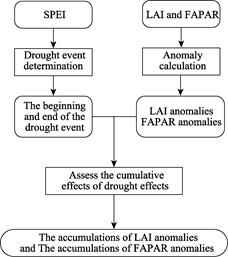
Figure 1 Workflow of the dataset development
|
First of all, we identified the drought event based on the SPEI, then the LAI anomalies and FAPAR anomalies were calculated, and lastly we calculated the accumulations of LAI and FAPAR anomalies during the drought periods (Figure 1).
4 Results and Validation
4.1 Data Products
The published dataset includes six folders and one Excel file. We can analyze the trend of vegetation remote sensing parameters (LAI and FAPAR) anomalies through the drought disaster statistic information datasets of this region (Figures 2-3). The sub-folders named with “the LAI anomalies” and “the FAPAR anomalies” are used to store the vegetation remote sensing anomalies files, the LAI anomalies and FAPAR anomalies can be displayed in space with the help of ArcMap (Figures 4-5). The other three sub-folders named “Drought Severity”, “the Accumulations of LAI anomalies” and “the Accumulations of FAPAR anomalies” are used to store the drought severity index file, the accumulations of LAI anomalies file and the accumulations of FAPAR anomalies file, the above three files can be showed in space by the ArcMap as well (Figure 6).
4.2 Validation
The GLASS LAI products and FAPAR products is spatially complete and temporally continuous[10]. Kim et al.[11] explored the impacts of severe drought on vegetation in Yunnan, and they considered the GLASS LAI could be used as an effective indicator for assessing the vegetation response to drought.
The literature studies suggest that our conclusions drawn from our dataset are consistent with the existing research results. Great drought events have occurred in the Southeast America[12]; Potter et al.[13] and Sharmistha et al.[14] evaluated the effects of drought on different vegetation, and they all consider that grasslands and no-irrigated croplands are easily influenced by drought compared with forests, this is consistent with the conclusion of this paper (Figures 2-3, Figure 6). Remote sensing anomalies files, the LAI anomalies and FAPAR anomalies can be displayed.
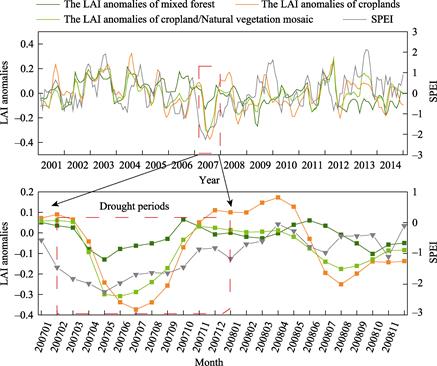
Figure 2 LAI anomalies of different vegetation in the Southeast America from 2001 to 2014
5 Discussion and Conclusion
The study region of the dataset is the Southeast America. It is produced based on the GLASS LAI and FAPAR by the anomaly analysis. The spatial resolution of the dataset is 0.01°, and the temporal resolution is 1 month. At the same time, combined with the MODIS land cover product, the influence of drought on different land covers are analyzed[15–16]. It can be found that different vegetation all was affected when the drought was severe. And the response among different vegetation to the drought was different, and the forest was less affected by drought compared with croplands.

Figure 3 FAPAR anomalies of different vegetation in the Southeast America from 2001 to 2014

Figure 4 Spatial characteristics of LAI anomalies at different months in the Southeast America
With the development of a drought event, the drought severity in one region will go from light to heavy and then go from heavy to light, thus it is important to quantify the overall effect of a drought event on the vegetation in the region. Based on the run theory, this paper proposed the accumulated anomalies of LAI and FAPAR to quantify the cumulative effects of major drought events on vegetation. And this method has been used to study the influences of drought on terrestrial vegetation in China[17], which provides a methodological reference for studying the comprehensive impacts of drought disasters on vegetation. The datasets can provide a reference for analyzing the effects of drought disasters on vegetation.
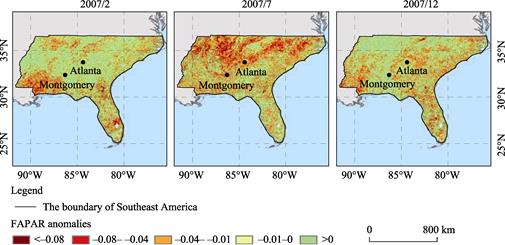
Figure 5 Spatial characteristics of FAPAR anomalies at different months in the Southeast America
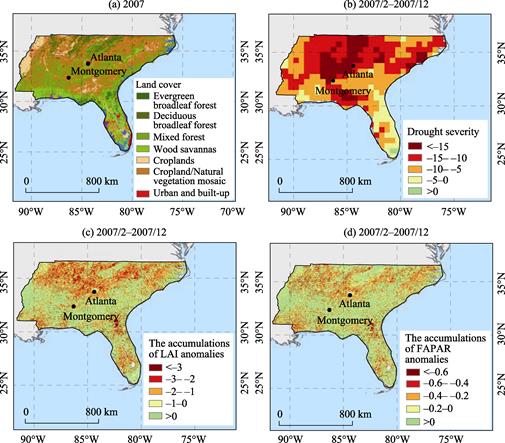
Figure 6 Spatial distribution of vegetation type, drought severity, and the accumulations of LAI and FAPAR anomalies in the Southeast America
References
[1] Kong, D. D., Zhang, Q., Gu, X. H., et al. Vegetation responses to drought at different time scales in China [J]. Acta Ecologia Sinica, 2016, 36(24): 7908-7918.
[2] Abbas, S., Nichol, J., Qamer, F., et al. Characterization of drought development through remote sensing: a case study in Central Yunnan, China [J]. Remote Sensing, 2014, 6(6): 4998-5018.
[3] Vicente-Serrano, S. M., Beguería, S., Lópezmoreno, J. I. A multiscalar drought index sensitive to global warming: the standardized precipitation evapotranspiration index [J]. Journal of Climate, 2010, 23(7): 1696-1718.
[4] Liang, S. L., Zhang, X. T., Xiao, Z. Q., et al. Global Land Surface Satellite (GLASS) Products Algorithms, Verification and Analysis [M]. Switzerland: Springer International Publishing, 2014.
[5] Maxwell, J. T., Soulé, P. T. United States drought of 2007: historical perspectives [J]. Climate Research, 2009, 38(2): 95-104.
[6] Wu, J. J., Yang, J. H. The drought degree and its impacts on vegetation dataset in southeast America (2007) [DB/OL]. Global Change Research Data Publishing & Repository, 2017. DOI: 10.3974/geodb.2017. 04.09.V1.
[7] GCdataPR Editorial Office. GCdataPR data sharing policy [OL]. DOI:10.3974/dp.policy.2014.05 (Updated 2017).
[8] Yang, H. Z., Liang, Z. M., Hu, Y. M., et al. Application of run-length theory to drought return period analysis of Yunnan province [J]. Water Resources and Power, 2013, 31(12): 8-12.
[9] Zuo, D. D., Hou, W., Yan, P. C., et al. Research of drought in southwest China based on the theory of run and two-dimensional joint distribution theory [J]. Acta Physica Sinica, 2014, 63(23): 45-56.
[10] Xiao, Z., Liang, S., Sun, R., et al. Estimating the fraction of absorbed photosynthetically active radiation from the MODIS data based GLASS leaf area index product [J]. Remote Sensing of Environment, 2015, 171: 105-117.
[11] Kim, K., Wang, M., Ranjitkar, S., et al. Using leaf area index (LAI) to assess vegetation response to drought in Yunnan province of China [J]. Journal of Mountain Science, 2017, 14(9): 1863-1872.
[12] Zhang, L., Xiao, J., Li, J., et al. The 2010 spring drought reduced primary productivity in southwestern China [J]. Environmental Research Letters, 2012, 7(4): 045706.
[13] Yan, J., Chen, B., Fang, S., et al. The response of vegetation index to drought: taking the extreme drought disaster between 2009 and 2010 in southwest China as an example [J]. Journal of Remote Sensing, 2012, 16(4): 720-37.
[14] Wang, W., Wang, W., Li, J., et al. The impact of sustained drought on vegetation ecosystem in southwest China based on remote sensing [J]. Procedia Environmental Sciences, 2010, 2: 1679-1691.
[15] Friedl, M. A., Mciver, D. K., Hodges, J. C. F., et al. Global land cover mapping from MODIS: algorithms and early results [J]. Remote Sensing of Environment, 2002, 83(1): 287-302.
[16] Friedl, M. A., Sulla-Menashe, D., Tan, B., et al. MODIS collection 5 global land cover: algorithm refinements and characterization of new datasets [J]. Remote Sensing of Environment, 2010, 114(1): 168-182.
[17] Yang, J., Wu, J., Zhou, H., et al. The impacts of typical drought events on terrestrial vegetation in China [J]. International Archives of the Photogrammetry, Remote Sensing and Spatial Information Sciences, 2018, 42: 3.