Carbon Dioxide Column Data in the Mid-troposphere (2003–2015)
Fu, C. B.1,2 Dan, L.1*
1. Key Laboratory of Regional Climate and Environment Research for Temperate East Asia, Institute of Atmospheric Physics, Chinese Academy of Sciences, Beijing 100029, China;
2. Hainan Institute of Meteorological Science, Haikou 570203, China
Abstract: The rise in the concentration of greenhouse gases induced by human activities is the major reason for global warming. Based on Atmospheric Infrared Sounder (ARIS)–retrieved CO2 column data in the mid-troposphere during 2003–2015, the spatiotemporal change in CO2 was analyzed using ground-based observations as the validation data. The results show a high-concentration belt distributed along 30°N–60°N in the Northern Hemisphere, while low values occur mainly in the lower latitudes of (15°S–15°N, 140°W–100°E). There is agreement between the ground-based observations and the AIRS satellite data, and the annual rate of increase is approximately 1.926 mL/(m3·a). The datasets include: (1) the global CO2 column in the mid-troposphere during 2003–2015; (2) the annual growth rate of CO2; and (3) a comparison between the ground-based observations and AIRS-retrieved data. The datasets are stored in. xlsx and .tif format, and the volume is 292 KB (246 KB for one compressed file). The results have been published in Vol. 61, No. 11 of the Chinese Journal of Geophysics.
Keywords: CO2; satellite remote sensing; globe; Chinese Journal of Geophysics
1 Introduction
The global economy and population has been increasing since the industrial revolution, and the overuse of fossil fuels has since caused a considerable increase in the CO2 concentration[1–2]. The global climate, ecosystem and economy have been affected by these enhanced greenhouse gases[3–4]. Consequently, it is of importance to detect the variation in the CO2 concentration—for the development of effective emissions reduction policies by governments; for an in-depth understanding of the global carbon cycle; and for the identification of carbon sinks and sources. Here, the average growth rate of global Atmospheric Infrared Sounder (AIRS)–retrieved CO2 data from NASA’s Aqua satellite, as well as an intercomparison with observed data from five atmospheric background stations, are presented from 2003 to 2015. The datasets provide a solid basis for analysis of the heterogeneity and growth rate of CO2 over different regions of the global troposphere.
2 Metadata of Dataset
The title, authors, geography, duration, temporal resolution, spatial resolution, data composition, publication and sharing service platform, and data sharing policy are given in Table 1 for the “Global mid-tropospheric carbon dioxide concentration dataset (2003–2015)”[5].
Table 1 Metadata summary of the “Global mid-tropospheric carbon dioxide concentration dataset (2003–2015)”
|
Item
|
Description
|
|
Dataset full name
|
Global mid-tropospheric carbon dioxide concentration dataset (2003–2015)
|
|
Dataset short name
|
GlobalTropoCO2_2003–2015
|
|
Authors
|
Fu, C. B. B-8133-2019, Hainan Institute of Meteorological Science, hnfuchuanbo@163.com
Dan, L. D-4834-2018, Key Laboratory of Regional Climate and Environment Research for Temperate East Asia, Institute of Atmospheric Physics, Chinese Academy of Sciences, danli@tea.ac.cn
|
|
Geographical region
|
Global
|
|
Year
|
1961–2015
|
|
Temporal resolution
|
Annual mean during 2003–2015; Monthly change during 2003–2015
|
|
Spatial resolution
|
2° (latitude) × 2.5° (longitude)
|
|
Data format
|
.xlsx, .tif
|
|
Data size
|
292 KB
|
|
Data files
|
The data consist of one Excel file in a directory. The Excel file has three sheets: (1) Global CO2 column concentration in the mid-troposphere during 2003–2015; (2) Annual mean growth rate of CO2 during 2003–2015; (3) Intercomparison between ground-based observations and AIRS-retrieved data. The Excel file volume is 204KB, and the two .tif files are 87.8 KB
|
|
Foundations
|
Ministry of Science and Technology of P. R. China (2016YFA0602501); National Natural Science Foundation of China (41630532, 41275082)
|
|
Data publisher
|
Global Change Research Data Publishing & Repository, http://www.geodoi.ac.cn
|
|
Address
|
No. 11A, Datun Road, Chaoyang District, Beijing 100101, China
|
|
Data sharing policy
|
Data from the Global Change Research Data Publishing & Repository includes metadata, datasets (data products), and publications (in this case, in the Journal of Global Change Data & Discovery). Data sharing policy includes: (1) Data are openly available and can be free downloaded via the Internet; (2) End users are encouraged to use Data subject to citation; (3) Users, who are by definition also value-added service providers, are welcome to redistribute Data subject to written permission from the GCdataPR Editorial Office and the issuance of a Data redistribution license, and; (4) If Data are used to compile new datasets, the ‘ten percent principal’ should be followed such that Data records utilized should not surpass 10% of the new dataset contents, while sources should be clearly noted in suitable places in the new dataset[6]
|
3 Data Production Method
3.1 Data Source
The CO2 concentration in the mid-troposphere was downloaded from NASA. The satellite Aqua was launched in May 2002 and operates in a near polar sun-synchronous orbit, and its mission is to observe the global water and energy cycle, climate change trend, and response of the climate system to the increase in greenhouse gases[7]. The infrared remote sensor AIRS is carried onboard Aqua, and has 2,378 channels to detect outgoing radiation at 8.8–15.5 μm, 6.2–8.2 μm, and 3.75–4.58 μm. It retrieves the global daily CO2 concentration, including the concentration over land, ocean and polar regions[8]. AIRS CO2 is retrieved using the Vanishing Partial Derivative method[9], and the spatial resolution at the sub-satellite point is 90 km × 90 km, covering 90°N–60°S. The third-level product is a grid average from the second standard data, with a spatial resolution of 2° (latitude) × 2.5° (longitude). Version 5 of the third-level monthly mean CO2 data was used, having been downloaded from the official website of NASA (https://airs.jpl.nasa.gov). The CO2 concentration data from five background stations were downloaded from WMO WDCGG (http://gaw.kishou.go.jp/wdcgg/wdcgg.html). The background stations are Mauna Loa, Waliguan, Niwot Ridge, Sonnblick and Summit, and the observation method and quality control procedures can be found in Zhao et al.[10].
3.2 Algorithm Principle
Based on relevant work[11–12], the dataset was achieved by the following calculation: the 13 years’ (n = 13) annual averages were calculated from the global monthly 2° (latitude) × 2.5° (longitude) CO2 concentration data. The annual mean was implemented at each grid cell across the globe (2003–2015), and the result can be found in Tab. 1 of the data directory in .xlsx format.
The 13 values of CO2 concentration of each grid cell are the sample series xj, and tj is the corresponding time. Thus, a one-dimensional linear regression equation was established:
 (1)
(1)
where a is the regression constant and b is the regression coefficient. The values of a and b can be solved by the least-squares method:
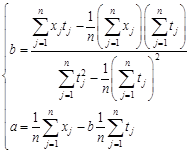 (2)
(2)
The sign of b shows the linear trend of the sample series. It means an upward trend when b>0 and downward trend when b<0. The magnitude of b reflects an enhanced or weakened rate. In this study, b is referred to as the annual mean growth rate of CO2, which can be calculated in Tab. 2 of the data directory file.
The latitudes and longitudes of five WMO WDCGG background stations were selected, and the monthly CO2 concentration of AIRS was extracted at the latitudes and longitudes. The results are saved in Tab. 3 of the data directory.
3 Results and Validation
3.1 Dataset Composition and Visualization
The resulting data include: (1) the global CO2 column concentration in the mid-troposphere during 2003–2015; (2) the annual mean growth rate of CO2; (3) an intercomparison between ground-based observations and AIRS-retrieved data from January 2003 to December 2015 (Figures 1–3).
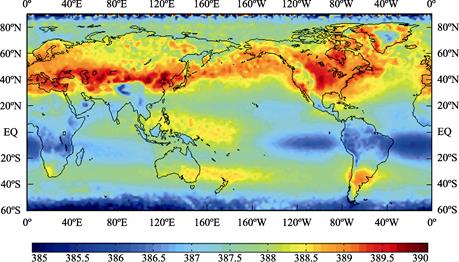
Figure 1 Global CO2 concentration in the mid-troposphere averaged during 2003–2015 (mL/m3)[13]
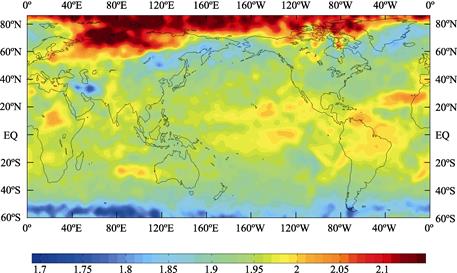
Figure 2 Growth rate of global CO2 in the mid-troposphere during 2003–2015 (mL/(m3·a))[13]
The CO2 concentration and its growth rate are obviously larger in the Northern Hemisphere in contrast with the Southern Hemisphere (Figures 1–2). The high values of CO2 concentration are distributed mainly over mid-to-high latitudes of around 30°N–60°N. The annual growth rate exceeding 2 mL/(m3·a) occurs in regions to the north of 60°N in the Arctic Ocean, Siberia, northeastern America and Greenland. This shows agreement with the faster warming trend in the high latitudes of the Northern Hemisphere under global warming.
|
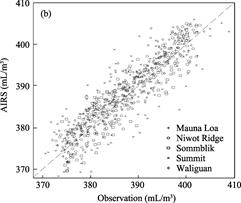
Figure 3 Intercomaprison between the monthly CO2 of background stations and AIRS-retrieved data[13]
|
It can be seen from Figure 3 and Table 2 that the ground-based CO2 concentration agrees well with the AIRS satellite–retrieved data. The AIRS data accurately reflect the CO2 concentration in the mid-troposphere. The annual growth rate of CO2 from the satellite is close to that of the ground-based stations. The maximum correlation coefficient (0.978) is at Mauna Loa, while the lowest (0.754) is at Sonnblick, and all the coefficients of the five stations pass the 99.9% confidence level.
Table 2 Intercomparison between the ground-based observations and AIRS-retrieved data from January 2003 to December 2015[12]
|
Background station
|
Location
|
|
Annual growth rate (mL/(m3·a))
|
|
Average (mL/m3)
|
Monthly mean
correlation
coefficient
|
Confidence level (%)
|
|
Latitude (°)
|
Longitude (°)
|
Altitude (m)
|
|
Ground
|
AIRS
|
|
Ground
|
AIRS
|
|
Mauna Loa
|
19.539
|
–155.58
|
3,397
|
|
1.914
|
1.956
|
|
387.933
|
386.765
|
0.978
|
99.9
|
|
Waliguan
|
36.28
|
100.90
|
3,810
|
|
1.926
|
1.901
|
|
388.214
|
386.989
|
0.948
|
99.9
|
|
Niwot Ridge
|
40.053
|
–105.59
|
3,523
|
|
1.943
|
1.935
|
|
388.647
|
387.909
|
0.882
|
99.9
|
|
Sonnblick
|
47.05
|
12.95
|
3,106
|
|
1.876
|
1.975
|
|
387.699
|
388.072
|
0.754
|
99.9
|
|
Summit
|
72.58
|
–38.48
|
3,238
|
|
1.972
|
1.865
|
|
388.672
|
385.504
|
0.925
|
99.9
|
4 Discussion and Conclusion
The dataset reported here was processed from global CO2 concentration data in the mid-troposphere retrieved by AIRS, and aims at providing a data foundation for studying the spatiotemporal heterogeneity of CO2. It shows the global CO2 distribution in the mid-troposphere, the annual growth rate, and an intercomparison with the atmospheric background. Analysis shows that high CO2 concentrations are mainly distributed over the regions along 30°N–60°N, and the large annual growth rate lies in the high latitudes to the north of 60°N, which agrees with the obvious warming trend in the boreal high latitudes of the Northern Hemisphere. Bias testing using ground-based observations demonstrated that the CO2 retrieved from AIRS agrees well with the ground observations, and the satellite data can present an accurate distribution of CO2 in the mid-troposphere. The use of satellite remote sensing to detect atmospheric CO2 concentrations is considerably advantageous; however, satellite data generally have a short history, and this limits analysis of the long-term change in CO2. Further optimizing the retrieval algorithm and achieving finer resolutions of satellite data are also issues that need to be solved in the field of satellite remote sensing. Nonetheless, the data retrieved by satellites will show more technique support for the global carbon cycle, as well as the impact of human activities on the CO2 concentration.
Author contributions
Dan, L. was responsible for the overall design of the dataset’s development and algorithm; Fu, C. B. processed the data and drafted the data paper.
References
[1] Tarasova, O., Koide, H., Dlugokencky, E., et al. The state of greenhouse gases in the atmosphere using global observations through 2011 [J]. EGU General Assembly, 2012, 8: 11012.
[2] Butz, A., Guerlet, S., Hasekamp, O., et al. Toward accurate CO2 and CH4 observations from GOSAT [J]. Geophysical Research Letter, 2011, 38(14): L14812. DOI: 10. 1029/2011GL047888.
[3] Ding, Y. H., Ren, G. Y., Shi, G. Y., et al. National assessment report of climate change (I): climate change in China and its future trend [J]. Advances Climate Change Research, 2006, 2(1): 3–8.
[4] Barros, V., Broome, J., Clarke, L., et al. Climate Change 2014: Synthesis Report [R]. Switzerland: IPCC Fifth Assessment Report, 2014: 151.
[5] Fu, C. B., Dan, L. Global mid-tropospheric carbon dioxide concentration dataset (2003–2015) [DB/OL]. Global Change Research Data Publishing & Repository, 2019. DOI: 10.3974/geodb.2019.03.07.V1.
[6] GCdataPR Editorial Office. GCdataPR data sharing policy [OL]. DOI: 10.3974/dp.policy.2014.05 (Updated 2017).
[7] Yao, Z. G., Zhao, Z. L., Han, Z. G. AIRS stratospheric gravity waves during summer over East Asia derived from AIRS observations [J]. Chinese Journal of Geophysics, 2015, 58(4): 1121–1134.
[8] Chahine, M. T., Chen, L., Dimotakis, P., et al. Satellite remote sounding of mid-tropospheric CO2 [J]. Geophysical Research Letters, 2008, 35: L17807.
[9] Chahine, M., Barnet, C., Olsen, E. T., et al. On the determination of atmospheric minor gases by the method of vanishing partial derivatives with application to CO2 [J]. Geophysical Research Letters, 2005, 32: L22803.
[10] Zhao, Y. C., Wen, Y. P., Deliger, et al. Change characteristics of atmospheric CO2 background concentration in Waliguan Qinghai [J]. China Environmental Science, 2006, 26(1): 1–5.
[11] Bai, W. G., Zhang, X. Y., Zhang, P. Temporal and spatial distribution of tropospheric CO2 over China based on satellite observations [J]. Chinese Science Bulletin, 2010, 55(31): 3612–3618. DOI: 10.1007/s11434- 010-4182-4.
[12] Liu, L. X., Zhou, L. X., Zhang, X. C., et al. The atmospheric CO2 variation characteristic of four background stations of China [J]. Science in China Serial D Earth Science, 2009, 39(2): 222–228.
[13] Fu, C. B., Dan, L, Feng, J. M., et al. Temporal and spatial heterogeneous distribution of tropospheric CO2 over China and its possible genesis [J]. Chinese Journal of Geophysics, 2018, 61(11): 4373–4382.