Time Series of Land Use/Cover Dataset of Changwu
County in Five-Year Increments (1990-2015)
Chen, P. F.* Zhang, Z. Q.
State Key Laboratory of Resources and Environment
Information System, Institute of Geographic Science and Natural Resources
Research of Chinese Academy of Sciences, Beijing 100101, China
Abstract: Time series of land
use/cover dataset of Changwu county in Five-Year Increments (1990-2015) was
developed based on the Landsat TM/OLI images from 1990 to 2015 in five-year
increments. According to the regional characteristics of Changwu county, this dataset
has constructed a classification system of land use/cover, including 8 primary
classification categories (cultivated land, forest land, garden land,
grassland, water bodies, residential land, industrial and mining land, and
unused land) and 24 secondary classification categories. The data was validated
by ground-sampled points and points selected from high-resolution Google Earth
images, the overall classification accuracy of the dataset is 86.64%, and the
Kappa coefficient is 0.853,6. This dataset includes the land use/cover data of
Changwu county from 1990, 2000, 2005, 2010 and 2015. The data is archived in .shp
format with a data size of 7.36 MB.
Keywords: land use/cover;
time series; Changwu county; five-year; increment
Dataset Availability
Statement:
The dataset supporting this paper was published and is accessible
through the Digital Journal of Global
Change Data Repository at: https://doi.org/10.3974/geodb.2020.05.16.V1.
1 Introduction
The Changwu county is located in Loess Plateau in northern
China. It has been strongly eroded by flowing water, and the landforms are
undulating. Mountains, hills, plains and wide valleys coexist in the area. Its
main landform types include hilly and gully areas, hilly areas, broad valley
hilly areas, grassland areas, plateau gully areas, ruined gully areas, etc. Due
to the special terrain, climate conditions and long-term human activities, its
ecological environment is fragile, and soil erosion is serious. The local land
resources are seriously degraded, and the ecological security and sustainable
social and economic development of the lower Yellow River basin are always
threatened. Over the past 30 years, the country has carried out large-scale
ecological restoration projects, coupled with the changes in mineral development
and human use of land under the influence of regional socioeconomic development,
resulting in major changes in the land use/cover status of the region[1].
Land use/cover changes have an impact on the structure and function of the
ecosystem[2], which in turn affect the natural basis for human
survival and development[3]. Changwu county is located in the hilly
and gully area of the Loess Plateau. It is an experimental demonstration county
of the program of the ??Returning Farmland to Forest??, and its economic
development is representative of the central and southern regions of the Loess
Plateau. The area of Changwu county is small, but the land is complex,
including ditch slope and flatland[4]. In most recent decades, on
the one hand, with the implementation of the national ??Returning Farmland to
Forest?? program and the development of the regional economy, the area of
sloping farmland has been drastically reduced and gradually converted to forest
land and orchards, reducing the land use intensity; on the other hand, the
implementation of the Western Development Policy and Regional Urbanization and
Dilapidated/Dangerous Housing Renovation projects have significantly increased
the construction land area in Changwu county and increased the land use
intensity[5]. These changes in external conditions have caused major
changes in the land use patterns of Changwu county, which inevitably lead to
corresponding changes in its ecosystem structure. Therefore, the production and
analysis of the land use/cover dataset of Changwu county in recent decades is
necessary to clarify the trend in land use/cover changes in the region and then
to analyze the dominant factors for the cause of land use/cover changes as well
as the changes in ecological service caused by the land use/cover changes. An
analysis from the above perspectives is of great significance for making
sustainable development policies for Changwu county.
For
providing data support for the analysis of land use/cover changes, evaluating
ecological services, and creating sustainable development policies for Changwu
county, this study designed a land use/cover classification system from the
analysis of regional characteristics. Then, a time series land use/cover
dataset of Changwu county was developed using the visual interpretation method
based on Landsat Thematic Mapper/Operational Land Imager (TM/OLI) imagery.
Compared with the existing land use/cover dataset, this research focuses on
small-scale work, designing a land use/cover classification system suitable for
Changwu county and using field-sampled data and high-resolution images to make
a more detailed evaluation of the dataset. All of these components ensure the
high accuracy of the produced dataset.
2 Metadata of the Dataset
The
metadata of the ??Land use/cover dataset of Changwu, Shaanxi, China (1990-2015)??[6] are summarized in Table 1. This
table includes information such as the full name, short name, authors, year,
temporal resolution, spatial resolution, data format, data size, data files,
data publisher, and data sharing policy, etc.
Table 1
Metadata summary of the ??Land use/cover dataset of
Changwu, Shaanxi, China (1990-2015)??
|
Items
|
Description
|
|
Dataset
full name
|
Land use/cover
dataset of Changwu, Shaanxi, China (1990-2015)
|
|
Dataset
short name
|
LULC_Changwu_1990-2015
|
|
Authors
|
Chen,
P. F. D-7136-2019, Institute of Geographic Sciences and Natural Resources
Research, Chinese Academy of Sciences, pengfeichen@igsnrr.ac.cn
Zhang,
Z. Q. AAV-6982-2020, Institute of Geographic Sciences and Natural Resources Research,
Chinese Academy of Sciences, zhangzhiqiangsnd@163.com
|
|
Geographical
region
|
Changwu
county
|
|
Year
|
1990,
2000, 2005, 2010, 2015
|
|
Temporal
resolution
|
Five
years
|
|
Spatial
resolution
|
1??100,000
|
|
Data
format
|
.shp
|
|
|
|
Data
size
|
7.36
MB (Compressed data size is 3.20 MB)
|
|
|
|
Data
files
|
The
dataset contains 5 .shp files. Data name represents the data of the corresponding
year
|
|
Foundation(s)
|
Chinese
Academy of Sciences (XDA23100101)
|
|
Data
publisher
|
Global Change Research Data Publishing &
Repository, http://www.geodoi.ac.cn
|
|
Address
|
No.
11A, Datun Road, Chaoyang District, Beijing 100101, China
|
|
Data
sharing policy
|
Data from the Global Change
Research Data Publishing &Repository includes metadata, datasets (in the Digital Journal of Global Change Data Repository), and
publications (in the Journal of Global Change Data & Discovery). Data
sharing policy includes: (1) Data are openly available
and can be free downloaded via the Internet; (2) End users are encouraged to
use Data subject to citation; (3) Users, who are by definition
also value-added service providers, are welcome to redistribute Data subject
to written permission from the GCdataPR Editorial Office and the issuance of
a Data redistribution license; and (4) If Data are
used to compile new datasets, the ??ten per cent principal?? should be followed
such that Data records utilized should not surpass 10% of the
new dataset contents, while sources should be clearly noted in suitable
places in the new dataset[7]
|
|
Communication and searchable system
|
DOI, DCI, CSCD, WDS/ISC, GEOSS, China GEOSS, Crossref
|
3 Methods
3.1 Study Area
3.1.1 Remote Sensing Data
The
dataset was created using Landsat TM/OLI data[5]. According to the
land use/cover interpretation needs, ten images corresponding to summer and
winter of 1990, 2000, 2005, 2010 and 2015 were collected. The images used are
shown in Table 2.
Table 2 The Landsat TM/OLI imageries used for
producing the dataset
|
Year
|
Date
|
Track number (column/row)
|
Image type
|
|
1990
|
1988/9/15
|
128/36
|
TM
|
|
1991/8/23
|
128/36
|
TM
|
|
2000
|
2000/5/11
|
128/36
|
TM
|
|
2000/7/30
|
128/36
|
TM
|
|
2005
|
2005/7/12
|
128/36
|
TM
|
|
2005/10/16
|
128/36
|
TM
|
|
2010
|
2010/1/15
|
128/36
|
TM
|
|
2010/7/10
|
128/36
|
TM
|
|
2015
|
2014/12/28
|
128/36
|
OLI
|
|
2015/7/24
|
128/36
|
OLI
|
3.1.2 Validation Sample
According to the remote sensing interpretation results, the
ground validation samples are randomly arranged according to the area and
fragmentation of each land type. In 2015, a field survey was conducted in
Changwu county to obtain the land use/cover type at the selected sample points,
which are shown in Figure 1. In addition, due to traffic restrictions, some
locations are difficult to reach (such as Dongjiashan). The land use/cover
types in these locations are mainly obtained through Google Earth??s
high-resolution images[1]. In total, 247 validation samples were
finally obtained. Among them, 52 samples were field-sampled data, and 195 were
obtained using Google Earth images.
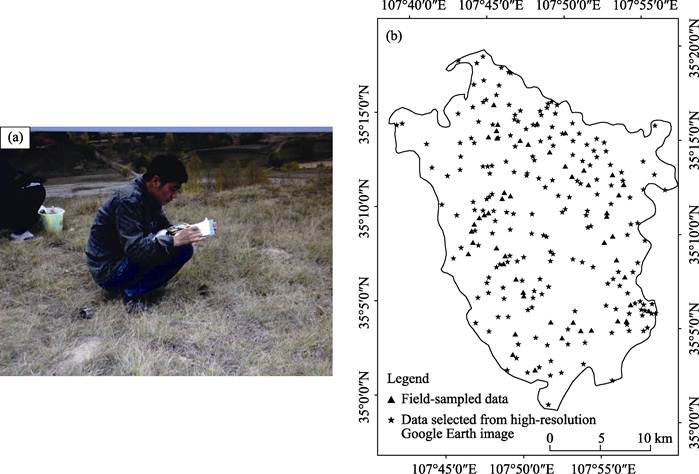
Figure 1 Photo from the
field sampling step (a) and map of the data validation samples (b)
3.1.3 Digital Elevation Model (DEM) Data
To assist in the visual interpretation of the remote
sensing images, the study also collected 30 m digital elevation data[5].
3.2 Data Processing
First, the classification system was designed according to
the regional characteristics of Changwu county (Table 3). During this process,
the national land resource classification system[8] was taken as a
reference, and some changes were made to reflect the impact of human activity
and the characteristics of Changwu county: (1) making garden land into the
first level of land classification; (2) removing permanent glaciers, snow and
mudflats from the secondary classification of water bodies; (3) making
industrial and mining land into the first level of land classification,
including industrial land and mining land; (4) removing the Gobi Desert from
the secondary classification of unused land. Second, using Landsat TM/OLI
imagery, digital elevation model (DEM) and slope data, interpretation signs
were made for each class. The slope data were calculated from the DEM. Third,
based on the interpretation signs, classification data were created from the
visual interpretation of the imagery. Finally, the classification results were
validated and evaluated using field-sampled data and data selected from Google
Earth image. The flow chart is shown in Figure 2.
Table 3 Land use/cover classification
system
|
First-level
classification system
|
Secondary-level
classification system
|
|
Cultivated land
|
Paddy land, dry land
|
|
Forest land
|
Woodland, shrub land, sparse
woodland, other woodland
|
|
Garden
land
|
Garden land
|
|
Grassland
|
High-coverage grassland,
medium-coverage grassland, low-coverage grassland
|
|
Water bodies
|
Rivers, lakes,
reservoirs/ponds, beaches
|
|
Residential land
|
Urban land, rural residential
land, other construction land
|
|
Industrial
and mining land
|
Industrial land, Mining land
|
|
Unused land
|
Sandy land, saline-alkali
land, marsh land, bare land, bare rock and gravel
|
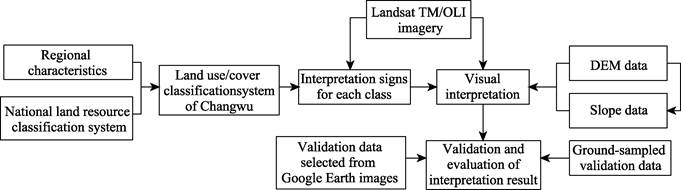
Figure 2 Flow chart of the dataset development
4 Data
Results and Validation
4.1 Data Composition
The dataset includes 40 data files, i.e., land use/cover
data of Changwu county in 1990, 2000, 2005, 2010 and 2015 (Figure 3, 4), all of
these files are in .shp (group) data format.
4.2 Data Results
The results of land use/cover in Changwu county for 1990,
2000, 2005, 2010, and 2015 are shown in Figures 3-4. For clarity, only first-level classification system
is listed at the map. Among all land types in Changwu county in 1990, the area
of cultivated land was the highest, with a value of 287.67 km2;
forest land and grassland followed, with values of 131.55 km2 and
104.03 km2, respectively. For the other land types, the areas of
residential land, garden land, water bodies and unused land were 19.61, 10.75,
8.31 and 0.08 km2, respectively. In the following 25 years, the area
of cultivated land and grassland in Changwu county continued to decrease. The
area of cultivated land decreased from 287.67 km2 to 133.28 km2,
and the area of grassland decreased from 104.03 km2 to 60.92 km2.
At the same time, the forest land, garden land, residential land, and
industrial and mining land areas continued to increase. Among them, forest land
increased from 131.55 km2 to 213.55 km2, garden land
increased from 10.75 km2 to 91.26 km2, residential land
increased from 19.61 km2 to 46.88 km2, and industrial and
mining land increased to 4.56 km2. These changes are mainly caused
by the combined effects of the program of the ??Returning Farmland to Forest??
and regional economic development. These initiatives made forest land the
largest land type in Changwu county, followed by cultivated land and garden
land. For the other land types, grassland and residential land have moderate
amounts of land area and water bodies, industrial and mining land, and unused
land have the smallest amounts of land area.
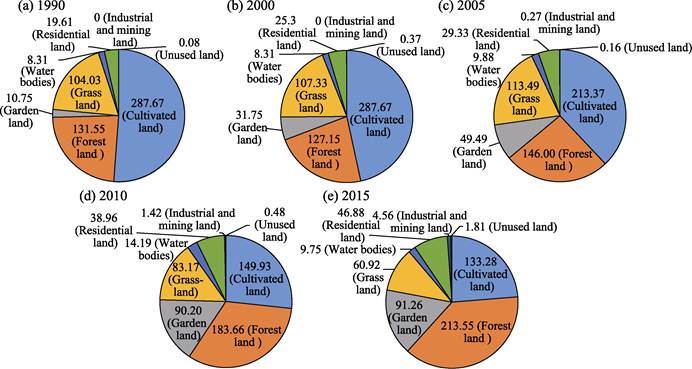
Figure 3 Area
of each land use/cover type in Changwu county (Unit: km2)
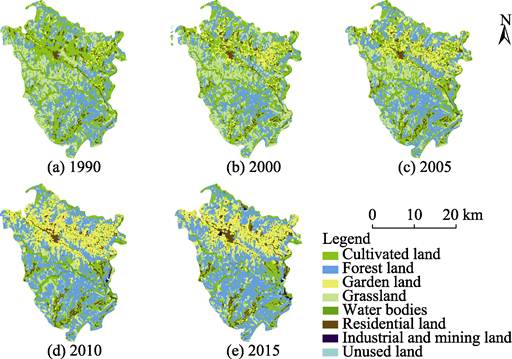
Figure 4 Map
of the first-level land use/cover classification system of Changwu county
4.3 Data Validation
Due to the long time span of the dataset, it is hard to
validate the classification results for earch of the time periods. Considering
that the dataset was made using the visual interpretation method with the establishment
of interpretation signs for each class, only the data in 2015 were validated to
represent the data accuracy for all the periods. Based on the validation
dataset, the accuracy of the classification results in 2015 is validated. From
the error matrix, the overall classification accuracy is 86.64%, and the Kappa
coefficient is 0.853,6. It is generally recognized that a Kappa coefficient
greater than 0.61 indicates that the classification method achieved good
results. Thus, the dataset produced in this study has a high accuracy. In
addition, among all the land use/cover types, the identification accuracies of
rivers, urban land, industrial land, rural residential areas, other
construction land, reservoirs/ponds, mining land, bare land, and forest land
are high, with values between 88% and 100%, because these classes can be easily
visually interpreted from the imagery. The identification accuracies of shrub
land, garden land, high-coverage grassland, medium-coverage grassland and dry
land are lower than those of the above mentioned land use/cover types, with
values between 70% and 87%. The reason is mainly because sometimes it is
difficult to distinguish between shrub land and garden land, between
high-coverage grassland and medium-coverage grassland, and between grassland
derived from abandoned cultivated land and cultivated land.
5 Discussion and Conclusion
Changwu county is representative in the central and
southern regions of the Loess Plateau, it is of great significance to study the
trend and impact of its land use/cover changes. The time series of land
use/cover classification sytem in 1990, 2000, 2005, 2010 and 2015, are based on
the interpretation of Landsat TM/OLI images. Compared with the previous similar
dataset, the classification system developed in this study is more suitable to
the local area. With the development of the regional economy, the orchard land
in the mountain area of Changwu county had increased significantly, and
gradually become the main land use/cover type in the local area. Thus, this
study considered it the primary class, which is useful for the subsequent use
of the dataset for regional ecological service assessment and sustainable
economic development policy research. On the other hand, this dataset is specifically
aimed at Changwu county. The data used in this study are more refined, and the quality evaluation is stricter than that of the
national data. The dataset can be used to analyze the trend in land use/cover
changes in Changwu county, the driving factors for land use/cover changes in
this area, as well as the decision making for regional sustainable development
policies.
Author
Contributions
Chen, P. F. designed the research
framework and writing of the data paper; Zhang, Z. Q. collected the data and
made the dataset.
References
[1]
Zhang, Z. Q.,
Chen, P. F., Shen, W. Study on land use/cover change and its impact on ecosystem
services in Changwu county [J]. Research
of Soil and Water Conservation, 2017, 24(4): 219-226,
233.
[2]
Lambin, E.
F., Baulies, Z., Bockstael, N., et al.
Land use and land cover change, Implementation Strategy [R]. IGBP Report
No.48/IHDP Report No.10.Stochkholm: IGBP, 2002.
[3]
Chen, Y. Q.,
Yang, P. Recent progresses of international study of land use and land cover
change (LUCC) [J]. Economic Geography,
2001, 21(1): 95-96.
[4]
Liu, T., Liang, Y., Cao, L. X. Localization comparison on dynamic
coupling relationship between land use change and soil organic matter at county
scale [J]. Soils, 2012, 44(4): 652-637.
[5]
Landsat TM/OLI Data [DB/OL]. USGS. https: //earthexplorer.usgs.gov/.
[6]
Chen, P. F.,
Zhang, Z. Q. Land use/cover
dataset of Changwu, Shaanxi, China (1990-2015) [J/DB/OL]. Digital Journal of Global Change Data
Repository, 2020. https://doi.org/10.3974/geodb.2020.05.16.V1.
[7]
GCdataPR
Editorial Office. GCdataPR data sharing policy [OL]. https://doi.org/10.3974/dp.policy.2014.05 (Updated 2017).
[8]
Liu, J. Y.
Marco Survey and Dynamic Research of China??s Resources and Environment Using Remote
Sensing [M]. Beijing: China Science and Technology Press, 1996.