Spatial-temporal
Distribution Dataset of Qinghai- Tibet Agriculture and Animal Husbandry
Enterprises (2011?C2021)
Liu, L.
D.1 Zhang, W. Z.2* Ma, R. F.1 Li, J. M.2,
1. Department of Geography and Spatial
Information Techniques, Centre for Land and Marine Spatial Utilization and
Governance Research, Ningbo University, Ningbo 315211, China;
2. Key Laboratory of Region Sustainable
Development Modeling, Institute of Geographic Sciences and Resources Research,
Chinese Academy of Sciences, Beijing 100101, China;
Abstract: Agriculture and animal husbandry enterprises are
the core carrier and main body of the Qinghai-Tibet Plateau agriculture and
animal husbandry market, and their spatial layout and location characteristics
represent the development level of agriculture and animal husbandry and the
degree of market allocation. Based on the national enterprise credit
information publicity system, Tianyancha and other enterprise information
publishing platforms, data mining, collation and compilation are carried out,
and the data of Tibet and Qinghai province in 2011 and 2021 are obtained,
mainly including enterprise names, industry ownership and other attributes. The
analysis shows that the number of agriculture and animal husbandry enterprises
in Qinghai-Tibet has increased from 6,460 in 2011 to 45,523 in 2021, among
which the growth rate of animal husbandry enterprises is much larger than that
of agricultural enterprises. The distribution is mainly concentrated in the
valley and continues to spread outward. The dataset includes: (1) spatial
distribution data of agricultural and animal husbandry enterprises in
Qinghai-Tibet in 2011 and 2021; (2) statistics of the agricultural and animal
husbandry enterprises in Qinghai-Tibet in 2011 and 2021. The dataset is
archived in .xls and .gdb formats, and consists of 53 data files with data size
of 14.3 MB (compressed to one file with 1.82 MB).
Keywords: Tibetan Plateau; agriculture and animal husbandry
enterprises; spatial-temporal distribution; enterprise changes; 2011-2021
DOI: https://doi.org/10.3974/geodp.2022.04.09
CSTR: https://cstr.escience.org.cn/CSTR:20146.14.2022.04.09
Dataset Availability Statement:
The
dataset supporting this paper was published and is accessible through the Digital Journal of Global Change Data Repository at:
https://doi.org/10.3974/geodb.2022.07.08.V1 or
https://cstr.escience.org.cn/CSTR:20146.11.2022.07.08.V1.
1
Introduction
As
basic industry, Agriculture and animal husbandry are an important source of
income for people in Qinghai-Tibet to improve people??s livelihood. Among them,
agriculture and animal husbandry enterprises play an important role in the
overall development of agriculture and animal husbandry in Qinghai-Tibet, not
only solve local people??s employment and increase farmers?? and herdsmen??s
income, but also improve the integration and development of the three
industries in agriculture and animal husbandry areas. However, due to the
restriction of alpine natural geographical environment, the number of
agriculture and animal husbandry enterprises in Qinghai-Tibet is small, and the
industrialization development of agriculture and animal husbandry is always at
a low level. In recent years, with the inclination of the central government??s
transfer payment funds to the industrialization of agriculture and animal
husbandry and the improvement of various infrastructures, the agricultural and
animal husbandry enterprises in Qinghai-Tibet region have grown rapidly, and
the industrialization level of agriculture and animal husbandry has been
greatly improved.
As the core
carrier and main organization of agriculture and animal husbandry, the spatial
distribution of agricultural and animal husbandry enterprises is the projection
of agricultural and animal husbandry industrialization development in geography[1],
and the location characteristics directly affect the optimization of regional
industrial spatial layout and resource allocation[2?C5]; However, the
spatial attributes and interrelations contained in spatial distribution affect
the development level and production efficiency of regional agriculture and
animal husbandry industrialization[6?C8]. Since the classical
location theory, the problem of industrial location has aroused widespread
concern[9,10]. However, there are relatively few studies on the spatial
characteristics of agricultural and animal husbandry enterprises from the
geographical perspective[11], even less on the condition and
spatial-temporal pattern changes of agricultural and animal husbandry
enterprises in plateau areas, and the spatial distribution data of agricultural
and animal husbandry enterprises in plateau areas are few. Therefore, based on
the ??Tianyancha??[12] enterprise data query platform, the attribute
data of agricultural and animal husbandry enterprises in Qinghai and Tibet in
2011 and 2021 were obtained and verified in the National Enterprise Credit
Information Publicity System[13], and the enterprise coordinates of
the verified enterprise data were obtained and verified by the Gaode map
coordinate picker[14], and finally the spatial distribution dataset
of agricultural and animal husbandry enterprises in Qinghai and Tibet was
obtained. It should be noted that the Qinghai-Tibet Plateau is defined as two
provinces, Tibet and Qinghai, in combination with the amount of data and the
availability of data[15]. The industry definition of agriculture,
animal husbandry, agricultural specialty and auxiliary activities and animal
husbandry specialty and auxiliary activities is based on the National Economic Industry Classification[16].
2 Metadata of the Dataset
The
metadata of the Spatial-temporal distribution dataset of Qinghai-Tibet
agriculture and animal husbandry enterprises (2011?C2021)[17] is summarized in Table 1. It includes the
dataset full name, short name, authors, year of the dataset, temporal
resolution, spatial resolution, data format, data size, data files, data
publisher, and data sharing policy, etc.
Table
1 Metadata
summary of the Spatial-temporal distribution dataset of Qinghai-Tibet
agriculture and animal husbandry enterprises (2011?C2021)
|
Items
|
Description
|
|
Dataset full name
|
Spatial-temporal distribution dataset of Qinghai-Tibet agriculture and
animal husbandry enterprises (2011?C2021)
|
|
Dataset short name
|
AGAHent_TibetanPlateau
|
|
Authors
|
Liu, L. D., Department of Geography and Spatial Information Techniques,
Centre for Land and Marine Spatial Utilization and Governance Research,
2011073018@nbu.edu.cn
Zhang, W. Z., Key Laboratory of Region Sustainable Development Modeling,
Institute of Geographic Sciences and Resources Research, Chinese Academy of
Sciences, zhangwz@igsnrr.ac.cn
Ma, R. F. AAX-8655-2021, Department of Geography and Spatial Information
Techniques, Centre for Land and Marine Spatial Utilization and Governance
Research, marenfeng@nbu.edu.cn
Li, J. M., Key Laboratory of Region Sustainable Development Modeling,
Institute of Geographic Sciences and Resources Research, Chinese Academy of
Sciences, lijm@igsnrr.ac.cn
|
|
Geographical region
|
Qinghai-Tibet Year 2011,
2021
|
|
Data format
|
.xls, .gdb Data size 1.82 MB
|
|
Data files
|
(1) The spatial distribution data of agricultural and animal husbandry
enterprises in Qinghai and Tibet in 2011 and 2021
(2) The statistics of agricultural and animal husbandry enterprises in
Qinghai and Tibet in 2011 and 2021
|
|
Foundation
|
Ministry of Science and Technology of P. R. China (2019QZKK0406)
|
|
Computing environment
|
ArcGIS, Institute of Geographic Sciences and Natural Resources Research,
Chinese Academy of Sciences platform
|
|
Address
|
No. 11A, Datun Road, Chaoyang District, Beijing 100101, China
|
|
Data Publisher Address
|
Global Change
Research Data Publishing & Repository, http://www.geodoi.ac.cn
|
|
Data sharing policy
|
Data from the Global Change Research Data
Publishing & Repository includes metadata, datasets (in the Digital Journal of Global
Change Data Repository), and publications (in the Journal of Global
Change Data & Discovery).
Data sharing
policy includes: (1) Data are openly available and can
be free downloaded via the Internet; (2) End users are encouraged to use Data
subject to citation; (3) Users, who are by definition also value-added
service providers, are welcome to redistribute Data subject to written
permission from the GCdataPR Editorial Office and the issuance of a Data
redistribution license; and (4) If Data are used to compile new
datasets, the ??ten per cent principal?? should be followed such that Data
records utilized should not surpass 10% of the new dataset contents, while
sources should be clearly noted in suitable places in the new dataset[18]
|
|
Communication and searchable system
|
DOI, CSTR, Crossref, DCI, CSCD, CNKI, SciEngine, WDS/ISC, GEOSS
|
|
|
|
3 Data Development Methods
The
data of agricultural and animal husbandry enterprises used in the research are
mainly obtained from the website of Tianyancha (the query time is from January
11 to 15, 2022). In the advanced search function, we first select the industry
as agriculture, animal husbandry, agricultural or animal husbandry auxiliary
activities; We select Tibet and Qinghai province; When querying the enterprise
data in 2011, we choose the establishment time of 10?C15 years and more than 15
years; When querying the enterprise data in 2021, the establishment time is
ignored, and the enterprise status is selected as existing. The data of Qinghai-Tibet
agriculture and animal husbandry enterprises in 2011 and 2021, including the
attributes of enterprise name, enterprise status, city and county to which they
belong, are obtained and verified in the National Enterprise Credit Information
Publicity System. Further, the registered address of the enterprise will be
converted into geographical coordinates through the coordinate picker of Gaode
map, and then the coordinate data will be imported into ArcGIS10.8 for
verification and screening. Finally, there were 6,460 agriculture and animal
husbandry enterprises in Qinghai-Tibet in 2011, including 2,779 agricultural
enterprises and 3,681 animal husbandry enterprises. In 2021, there were 45,523
agriculture and animal husbandry enterprises, including 14,907 agricultural
enterprises and 30,616 animal husbandry enterprises. In addition, the vector
data of Qinghai-Tibet administrative boundary is based on the year 2020, and
comes from the National Geographic Information Public Service Platform[19].
Development process of the dataset is shown in Figure 1.
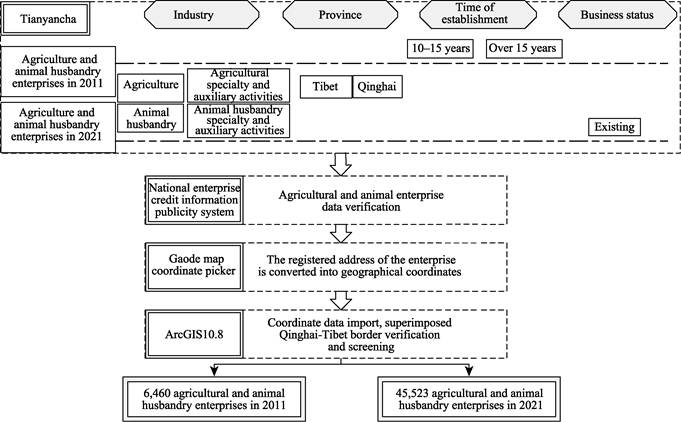
Figure
1 Development
process of the dataset
4 Data Results
4.1 Data Products
Spatial-temporal
distribution dataset of Qinghai-Tibet agriculture and animal husbandry enterprises (2011?C2021) includes two parts, namely,
the spatial distribution data of agricultural and animal husbandry
enterprises in Qinghai and Tibet in 2011 and 2021 (Figure 2) and the statistics
of agricultural and animal husbandry enterprises in Qinghai and Tibet in 2011
and 2021 (Figure 3).
4.2 Data Results
4.2.1 Temporal and Spatial Distribution Changes of Agricultural and Animal
Husbandry Enterprises in Qinghai-Tibet
The
Qinghai-Tibet Plateau, with an average altitude of more than 4,000 m, is called
the ??roof of the world?? of the earth, and its topography and climate are
complex and diverse. Restricted by the cold natural environment, the
industrialization of agriculture and animal husbandry in Qinghai-Tibet is
developing slowly, with a small number of agricultural and animal husbandry
enterprises and extremely uneven distribution, mainly concentrated in low-lying
areas such as river valleys. Among them, the Brahmaputra, Lasa River and Nyang
Qu basins are the most densely populated areas in Tibet. In addition, there are
many agricultural and animal husbandry enterprises in Nyang River, Chin-sha
River, Lancang River and Nu Jiang Valley. From the administrative unit, Tibetan
agricultural and animal husbandry enterprises are mainly distributed in Lasa,
Shigatse and Nyingchi. Agricultural and animal husbandry enterprises in Qinghai
are most concentrated in Huangshui Valley and Yellow River Valley, and there
are also a certain number of agricultural and animal husbandry enterprises in
Datong River, Lancang River, Chin-sha River valley and the coastal areas of
Qinghai Lake. It is worth noting that there is no significant difference
between the distribution of livestock enterprises and agricultural enterprises,
but the distribution range of livestock enterprises is wider than that of
agricultural enterprises. This is because the suitable development area of
planting industry is generally distributed in the valley plain below the
elevation of 4,300 m, while the highest elevation of animal husbandry can reach
5,000 m, and the requirement of animal husbandry for slope is lower than that
of planting industry. Therefore, for the sake of being close to the production
area, the distribution of animal husbandry enterprises is wider than that of
agricultural enterprises.
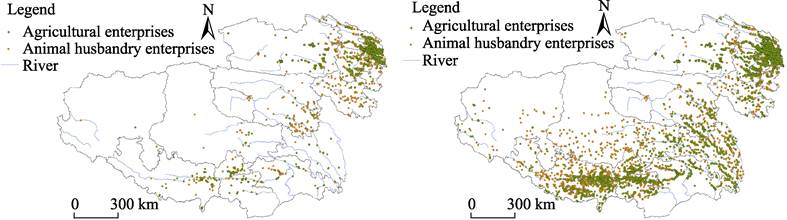
Figure 2 Map of spatial and temporal distribution of Qinghai-Tibet
agriculture and animal husbandry enterprises in 2011 and 2021
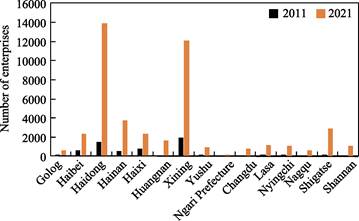
4.2.2 Spatio-temporal Changes of Agricultural and Animal Husbandry
Enterprises in Qinghai-Tibet
The
number of agriculture and animal husbandry enterprises in Qinghai-Tibet
increased from 6,460 in 2011 to 45,523 in 2021, among which the number of
animal husbandry enterprises increased from 3,681 to 30,616, which is much
larger than that of agricultural enterprises. There are obvious differences in
the number and spatial distribution characteristics of agricultural and animal
husbandry enterprises among cities in Qinghai and Tibet (Figure 4). In 2011,
the number of agriculture and animal husbandry enterprises in Xining and Lasa
ranked first in Qinghai and Tibet respectively, accounting for 33.78% and 30.7%
respectively. In 2021, the cities with the largest number of agricultural and
livestock enterprises in Qinghai and Tibet were Haidong and Shigatse,
accounting for 37% and 54.7% respectively. Although Ngari prefecture has a vast
area, it is restricted by the natural geographical environment and its own
economic development level. No matter in 2011 or 2021, the number of
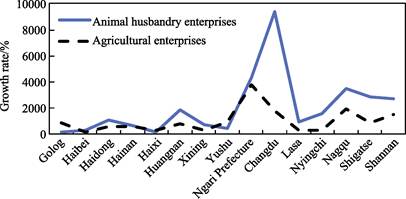
enterprises is the lowest among all cities. As far as the growth rate of
agricultural and animal husbandry enterprises is concerned, the growth rate of
agricultural and animal husbandry enterprises in Qinghai-Tibet has basically
reached more than 1,000% in the past ten years, among which the growth rate of
animal husbandry enterprises is generally larger than that of agricultural
enterprises, especially in Tibet. The growth rate of agriculture and animal husbandry enterprises in Tibet, especially animal
husbandry enterprises, is much higher than that in Qinghai. In recent years,
the assistance of the state and inland provinces and cities to the Tibet has
gradually focused on upgrading the industrial base, and is committed to
improving Tibet??s self-hematopoietic capacity. Under this background, Tibet??s
agriculture and animal husbandry industry has developed rapidly, with a higher
growth rate than Qinghai, which has a relatively good industrial development
foundation.
|
|
|
|
Figure 3 Statistics on the number of
agricultural and animal husbandry enterprises in Qinghai- Tibet in 2011 and
2021
|
Figure 4 Statistics on the growth rate of
agricultural and animal husbandry enterprises in Qinghai-Tibet in 2011 and
2021
|
5 Discussion and
Conclusion
The
development of agriculture and animal husbandry enterprises is not only an
important way to improve the industrialization of agriculture and animal
husbandry, but also an important way to solve the employment of local people.
The purpose of studying the spatial pattern evolution and its influencing
factors of agricultural and animal husbandry enterprises in Qinghai-Tibet is to
understand the spatial characteristics of agricultural and animal husbandry
industry development in Qinghai-Tibet and to clarify the direction of future
spatial adjustment. The coordinates and related attributes of 6,460 and 45,523
agricultural and animal husbandry enterprises in 2011 and 2021 were collected
and proofread through relevant websites, and the spatial distribution dataset
of agricultural and animal husbandry enterprises in Qinghai-Tibet was formed.
The results show that the agricultural and animal husbandry enterprises in
Qinghai-Tibet grew rapidly from 2011 to 2021, and the growth rate basically
reached more than 1,000%, among which the growth rate of livestock enterprises
was generally higher than that of agricultural enterprises. As far as the
distribution of agriculture and animal husbandry enterprises is concerned, both
the whole industry and the sub-industry are clustered. Specifically,
Brahmaputra, Lasa River and Nyang Qu basins in Tibet and ??Huangshui Valley?? and
??Yellow River Valley?? region in Qinghai are the most concentrated. Taking
prefecture-level cities as a unit, this dataset intuitively explains the
development process and regional differences of agriculture and animal
husbandry industry in Qinghai-Tibet. On the one hand, from the perspective of
industry??s own development, this dataset is helpful to clarify the spatial
adjustment direction of agriculture and animal husbandry industrialization in
Qinghai-Tibet region in the future, and provide direction and basis for
regional development strategy of agriculture and animal husbandry production.
On the other hand, from the perspective of sustainable utilization of resources
and environment, this dataset can be used to further identify the factors
affecting enterprise layout and environmental constraints, and put forward ways
to achieve optimal allocation of resources and transformation and upgrading of
resources and environment, so as to assist practical decisions.
Author
Contributions
Zhang, W. Z. and Ma, R. F.
proposed and promoted the research and development of this dataset, dataset
design and data paper revision; Liu, L. D. obtained the data of agricultural
and animal husbandry enterprises in Qinghai and Tibet in 2011 and 2021,
processed and compiled the dataset, and wrote data papers; Li, J. M.
participated in some data processing.
Conflicts
of Interest
The authors declare no
conflicts of interest.
References
[1]
Chen, F., Guo, J., Su, X. R., et al. Spatial distribution of
agricultural industrialization operation projects and its driving factors in
Beijing-Tianjin-Hebei region [J]. Journal
of Natural Resources, 2021, 36(2): 513?C524.
[2]
Song, Y., Wang, T. T., Zhang, Y.,
et al. Spatial distribution
characteristics and influencing factors of new-generation information
technology companies: a case of Nanjing central city [J]. Scientia Geographica Sinica, 2021, 41(7): 1199?C1209.
[3]
Hu, G. J., Lu, Y. Q., Hu, S. Y.
Research on location theory taking into account the registered address of
enterprises [J]. Geographical Research,
2022, 41(2): 580?C595.
[4]
Ma, R. F., Hou, B., Chen, P., et al. A study on the spatio-temporal
agglomeration of locations of Zhejiang marine enterprises [J]. Journal of Zhejiang University (Science Edition), 2018, 45(5): 617?C624.
[5]
Ma, R. F. Review on interaction
between creative class agglomeration and urban space evolution [J]. Academic Forum, 2022, 45(4): 16?C30.
[6]
Liu, J., Zhen, F., Zhang, S. Q.,
et al. Spatial distribution
characteristics and influencing factors of new-generation information
technology companies: a case of Nanjing central city [J]. Economic
Geography, 2022, 42(2): 114?C123.
[7]
Ma, R. F., Li, Q. Q., Dou, S. M.,
et al. Hot topics, methods and data
challenges in regional and urban industry research [J]. Think Tank: Theory & Practice, 2022, 7(2): 154?C164.
[8]
Wu, D., Wu, Y., Ni, X., et al. The location and built environment of cultural and creative industry in Hangzhou, China: a spatial
entropy weight overlay method based on multi-source data [J]. Land, 2022; 11(10): 1695.
[9]
Li, J. M., Sun, W., Zhang, W.
Z. Comparative study on micro-scale location choice of typical industries: The
case study of management service and automobile manufacturing in Beijing [J]. Geographical Research, 2018, 37(12): 2541?C2553.
[10]
Jiang, H. B., Zhang, W. Z., Yu,
J. H. Spatial and temporal pattern evolution of urban producer services in
Hangzhou [J]. Economic Geography, 2015,
35(9): 103?C111.
[11]
Yang, X., Liu, A. M., Jia, P. N.,
et al. Spatial pattern and evolution
mechanism of China??s soybean processing plants [J]. Journal of Natural Resources, 2019, 34(7): 1440?C1456.
[12]
Tianyancha. https://www.tianyancha.com.
[13]
National Enterprise Credit
Information Publicity System. https://www.gsxt.gov.cn.
[14]
Gaode map. https://lbs.amap.com.
[15]
Chen, J. R., Zhang, W. Z., Ma, R.
F., et al. Dataset of spatio-temporal
changes of enterprises in Tibet autonomous region (2010?C2020) [J/DB/OL]. Digital Journal of Global Change Data
Repository, 2022. https://doi.org/10.3974/geodb.2022.07.09.V1. https://cstr.escience.org.cn/CSTR:20146.11.2022.07.09.V1.
[16]
General Administration of
Quality Supervision, Inspection and Quarantine of the People??s Republic of
China, National Standardization Administration Committee of China. Industrial
classification for national economic activities (GB/T 4754??2017) [M]. Beijing: Standards
Press of China, 2017.
[17]
Liu, L. D., Zhang, W. Z., Ma, R,
F., et al. Spatial-temporal
distribution dataset of Qinghai-Tibet agriculture and animal husbandry
enterprises (2011?C2021) [J/DB/OL]. Digital
Journal of Global Change Data Repository, 2022.
https://doi.org/10.3974/geodb.2022.07.08.V1. https://cstr.escience.org.cn/CSTR:20146.
11.2022.07.08.V1.
[18]
GCdataPR Editorial Office.
GCdataPR data sharing policy [OL]. https://doi.org/10.3974/dp.policy.2014.05
(Updated 2017).
[19]
National Geographic Information
Public Service Platform. https:www.tianditu.gov.cn.