Magnetic Anomaly and Hypocenter Temperature Structure Dataset in Eastern Margin of
Qinghai-Tibet Plateau
Wang, J.1* Zhang, G. W.1 Liang, S. S.2
1. Institute of Crustal Dynamics, China Earthquake Administration, Beijing 100085, China;
2. China Earthquake Network Center, Beijing 100045, China
Abstract: The eastern margin of the Qinghai-Tibet Plateau is one of the most complex and intense seismic activity areas in China. Temperature is one of the key factors that indicate the brittle-plastic deformation and seismogenic layer depths distribution. Based on 6,406 seismic data records from the eastern margin of the Qinghai-Tibet Plateau, the 4,921 of them with magnitudes M≥2.0 during 2008–2017 were relocated by using two crustal velocity models and the double-difference relocation algorithm. Curie-point depths were estimated from NGDC-720 magnetic anomaly. Crustal temperature structures were then calculated by incorporating surface heat flow and Curie-point depths based on the 1D steady thermal conduction equation. The dataset consists of five Excel files: (1) earthquake relocations with magnitudes M≥2.0 in the eastern margin of the Qinghai-Tibet Plateau during 2008–2017, including 4,540 earthquakes with 2.0≤M<4.0, and 381 earthquakes with M≥4.0; (2) total and x, y, z-direction vector of NGDC-720 magnetic anomalies observed at 0 km; (3) xy, xz, yz, zz-direction gradient tensor of the NGDC-720 magnetic anomalies observed at 10 km; (4) Curie-point depths and average temperature gradients of the magnetic layer; and (5) crustal temperature structures for hypocenters. The dataset is archived in .xlsx format with data size of 15.9 MB (Compressed to one file, 15.3 MB). The research paper based on the dataset was published at Chinese Journal of Geophysics, Vol. 61, No. 5, 2018.
Keywords: earthquake relocation; NGDC-720 magnetic anomaly; Curie-point depth; crustal temperature structure; Qinghai-Tibet Plateau; Chinese Journal of Geophysics
1 Introduction
The eastern margin of Qinghai-Tibet Plateau is one of the most intense and complex seismic activity regions in China. Since the 2008 Wenchuan Ms8.0 earthquake, there have occurred four large earthquakes with the Magnitude (M) no less than 6.5 in this area[1–4]. Temperature is one of the key factors to control the lithospheric brittle-plastic deformation, which further constrains the depth of the seismogenic layer. Due to that the surface heat flow measurements in the eastern margin of the Qinghai-Tibet Plateau are mainly distributed in the Sichuan Basin, large measurement gaps covers the regions in to the west of the Longmenshan and Xianshuihe faults with strong seismic activities. Therefore, it is difficult to study the relationship between crustal temperature structure and seismicity in the whole region of the eastern margin of the Qinghai-Tibet Plateau effectively. Curie-point depths obtained from inversion of magnetic anomaly data can be used to study the temperature structure of deep crust.
This paper employed the double-difference location method[5] to relocate the earthquakes occurring in the eastern margin of the Qinghai-Tibet Plateau with M≥2.0 during 2008–2017. Curie-point depths were estimated from NGDC-720 magnetic anomaly. Crustal temperature structures were then calculated by incorporating surface heat flow and Curie-points depths based on 1D steady thermal conduction equation. Finally, the hypocenter temperatures were calculated and their geodynamic implications were discussed.
2 Metadata of Dataset
The metadata for the “Magnetic anomaly and hypocenter temperature structure dataset in eastern margin of Qinghai-Tibet Plateau”[6] is summarized in Table 1, including the name, authors, geographical region, data files, data publisher and data sharing policy, etc.
Table 1 Metadata summary of “Magnetic anomalies and temperature structures dataset in the eastern margin of Tibetan Plateau”
|
Items
|
Description
|
|
Dataset full name
|
Magnetic anomaly and hypocenter temperature structure dataset in eastern margin of Qinghai-Tibet Plateau
|
|
Dataset short name
|
MagneticAnomalyTemStr_E.Tibet
|
|
Authors
|
Wang, J. R-5559-2019, Institute of Crustal Dynamics, China Earthquake Administration, wangjianhydz@163.com
Zhang, G. W. R-5608-2019, Institute of Crustal Dynamics, China Earthquake Administration, jluaaa@163.com
Li, C. F. Department of Marine Sciences, Zhejiang University; Laboratory of Marine Mineral Resources??Qingdao National Laboratory for Marine Science and Technology,
Liang, S. S. R-6288-2019, China Earthquake Network Center, liangshanshan@seis.ac.cn
|
|
Geographical region
|
Eastern margin of the Qinghai-Tibet Plateau
|
|
Year
|
2008–2017
|
|
Data format
|
.xlsx
|
|
Data size
|
15.3 MB (after compression)
|
|
Data files
|
The dataset consists of 1 compressed data file package, including 3 data folders, 32 data files:
(1) Earthquake relocations with magnitudes M≥2.0 in the eastern margin of the Qinghai-Tibet Plateau during 2008–2017, including 4,540 earthquakes with 2.0≤M<4.0 and 381 earthquakes with M≥4.0
(2) Total and x, y, z-direction vector of NGDC-720 magnetic anomalies observed at 0 km
(3) xy, xz, yz, zz-direction gradient tensor of NGDC-720 magnetic anomalies observed at 10 km
(4) Curie-point depths and average temperature gradients of the magnetic layer
(5) Crustal temperature structures for hypocenters
|
|
Foundations
|
National Natural Science Foundation of China (41704086, 41776057); Ministry of Science and Technology of P. R. China (ZDJ2016-01, ZDJ2017-04)
|
|
Data publisher
|
Global Change Research Data Publishing & Repository, http://www.geodoi.ac.cn
|
|
Address
|
No. 11A Datun Road, Chaoyang District, Beijing 100101, China
|
|
Data sharing policy
|
Data from the Global Change Research Data Publishing & Repository includes metadata, datasets (data products), and publications (in this case, in the Journal of Global Change Data & Discovery). Data sharing policy includes: (1) Data are openly available and can be free downloaded via the Internet; (2) End users are encouraged to use Data subject to citation; (3) Users, who are by definition also value-added service providers, are welcome to redistribute Data subject to written permission from the GCdataPR Editorial Office and the issuance of a Data redistribution license, and; (4) If Data are used to compile new datasets, the ‘ten percent principal’ should be followed such that Data records utilized should not surpass 10% of the new dataset contents, while sources should be clearly noted in suitable places in the new dataset[4]
|
|
Communication and searchable system
|
DOI, DCI, CSCD, WDS/ISC, GEOSS, China GEOSS
|
3 Method
3.1 Data Source
The earthquake data with M≥2.0 in the eastern margin of the Qinghai-Tibet Plateau during 2008–2017 used in the relocation were obtained from the China Earthquake Network Center. NGDC-720 magnetic anomaly was acquired from the National Geophysical Data Center of the United States (https://www.ngdc.noaa.gov/). The magnetic data was constructed from the magnetic anomaly model EMAG2 and the satellite magnetic anomaly model MF6 to construct a global 720-order spherical harmonic magnetic anomaly model, which can calculate the three-component magnetic anomalies at different observed altitudes at any latitude and longitude. Therefore, it has broad application value[8].
3.2 Methodology
3.2.1 Earthquake Relocation Algorithm
Double-difference relocation method is a relative earthquake location method, and its basic principle is as follows[5]: If the distance between two earthquake sources is smaller than the distance between event and station, and the scale of velocity heterogeneity, then the ray paths of the hypocenter and this station are almost the same. Because the source of absolute error for different events is the same, the ray path is only different in a small area near the hypocenter. Therefore, the travel-time difference between two events observed at a common station can be considered as a spatial offset between the two events. This method can eliminate effectively the location errors caused by the lateral inhomogeneity of crustal velocity structure.
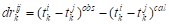
Assuming that the two events i and j are close to each other, then the travel-time difference observed by station k and the residual error when calculating it, i.e., the double-difference drij k is calculated as follows:
 (1)
(1)
where ti k and tj k are the travel-time of the events i and j for the station k, respectively. obs and cal indicate the observed and calculated travel times, respectively. Combining all hypocentral pairs for a station, and for all stations to form a linear equation system.
 (2)
(2)
where G defines a matrix with the size of M×4N (M, number of double-difference observations; N, number of events), m is the variation in hypocentral parameters, d is the data vector in Equation (1), W is a diagonal matrix to weight each equation. Damped least squares can be constructed by applying conjugate gradient method on Equation (2)[5].
3.2.2 NGDC-720 Magnetic Anomalies and Their Gradient Tensors
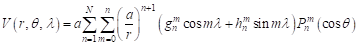
The Earth’s geomagnetic field potential function can be written in a spherical harmonic series [9]
 (3)
(3)
where a is the Earth’s radius (6,371.2 km), r is he geocentric coordinates (km), θ and λ are the colatitude and longitude (°), respectively. gm n and hm n are called the Gauss coefficients, and Pm n(cosθ) is the Schmidt quasi-normalized form of associated Legendre function of degree n and order m. The three-vector components of the geomagnetic field can be obtained from:
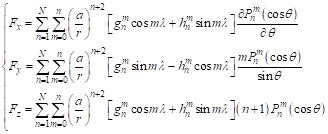 (4)
(4)
where N=720; Fx, Fy, and Fz are the x, y, z-direction vector of magnetic anomaly. The total magnetic anomaly can be calculated by 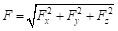 , and the gradient tensor FGT can be derived from:
 (5)
(5)
3.2.3 Curie-point Depth Estimation
Assuming infinite horizontal extensions of magnetic sources, the radially averaged amplitudes spectrum of the total field magnetic anomaly can be expressed as[9]:
 (6)
(6)
where  and
and  are the radially averaged amplitude spectra of the total field magnetic anomaly and magnetization, respectively. B is a constant. Zt and Zb are the depths to the top and bottom of the magnetic sources, respectively. k is the wavenumber. In the case of fractal magnetization, the following relation is established:
 (7)
(7)
where β is the fractal exponent for the 3D magnetization. Substituting Equation (7) into Equation (6) and taking natural logarithm on both sides, we can get:
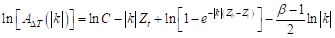 (8)
(8)
where C is a constant. Equation (8) can be simplified at middle- to high-wavenumber band to
 (9)
(9)
where D is a constant and at low-wavenumber band to
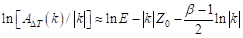 (10)
(10)
where E is a constant and Z0 is the centroid depth of the magnetic source. Zt and Z0 can be estimated by least-square linear fitting at middle- to high-wavenumber and low-wavenumber bands based on Eqations (9) and (10), respectively. Zb can be estimated by
 (11)
(11)
3.2.4 Crustal Temperature Structure
Assuming a continuous heat production in the lithosphere that decreases exponentially with depth, the 1D steady heat conduction equation is
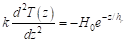 (12)
(12)
where T is the temperature (oC), z is the depth (km), k is the thermal conductivity (W/(m·oC)), H0 is the heat production rate at the surface (μW/m3), and hr is the characteristic drop-off of heat production (km). Integrating Equation (12) we can get:
 (13)
(13)
Assuming that the temperature at the surface Z0 is T0 and the temperature Tc is at the depth of Zb, then
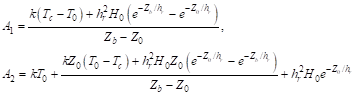 (14)
(14)
3.3 Technology Route
Firstly, we relocated the original earthquake catalogue by the double-difference location method[5]. Secondly, we calculated NGDC-720 three-component geomagnetic anomaly, total field magnetic anomaly, and gradient tensors. Thirdly, we estimated Curie-point depth according to 3d fractal magnetization model, and calculated crustal temperatures using the thermal conductivity changes with temperature. Finally, we analyzed and discussed the relationship between the crustal temperature structure and seismicity. The specific technical route is shown in Figure 1.

Figure 1 Technical route of data development
4 Results and Validation
4.1 Dataset Composition
Magnetic anomaly and hypocenter temperature structure dataset in eastern margin of Qinghai-Tibet Plateau includes:
(1) Earthquake relocations with magnitudes M≥2.0 in the eastern margin of the Qinghai-Tibet Plateau during 2008–2017, including 4,540 earthquakes with 2.0≤M≤4.0 and 381 earthquakes with M>4.0: RelocatedEarthquakes.xlsx.
(2) Total and three-component vectors of NGDC-720 magnetic anomalies observed at 0 km: MagneticAnomaly_NGDC-720.xlsx.
(3) Gradient tensors of NGDC-720 magnetic anomalies observed at 10 km: GradientTensor_NGDC-720.xlsx.
(4) Curie-point depths and average temperature gradients of the magnetic layer: CurieDepth_ Tem.Gra dient.xlsx.
(5) Crustal temperature structures for hypocenters: Tem.Structure.xlsx.
 4.2 Dataset Validation
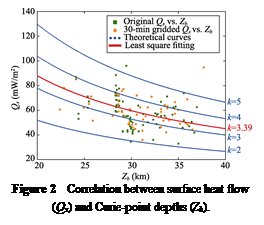
We calculated average temperature gradient of the magnetic layer in the eastern margin of the Qinghai-Tibet Plateau. Most regions show distinct low geothermal gradient (<20 oC/km). Drilling data of the Sichuan Basin show that the geothermal gradient is about 17.7-33.3 oC /km with an average of about 22.8 oC/km[12], indicating that the average geothermal gradient of the magnetic layer in the eastern margin of the Qinghai-Tibet Plateau estimated in this study is in line with the actual geological settings. The crustal temperature parameters (k=3.39 W/(m·oC), hr=8.684 km, and H0=2.08 μW/m3) obtained by using the least square fitting (Figure 2) are consistent with those measured in the laboratory[12–13]. The hypocenter temperatures of the 2008 Wenchuan Ms8.0, 2013 Lushan Ms7.0, 2013 Minxian Ms6.6, 2014 Ludian Ms6.5 and 2017 Jiuzhaigou Ms7.0 are almost around 300 oC, indicating that these earthquakes occurred in the crustal brittle-plastic deformation transition zone (Figure 3).
Table 2 Relocation of M≥6.5 earthquakes in the eastern margin of the Qinghai-Tibet Plateau[11]
|
Earthquake
|
Longitude (°E)
|
Latitude (°N)
|
Depth (km)
|
Compared depth (km)
|
|
2013 Lushan Ms7.0
|
102.971,0
|
30.298,3
|
19.5
|
17.8[1]
|
|
2013 Minxian Ms6.6
|
104.211,7
|
34.546,9
|
13.0
|
13.5[2]
|
|
2014 Ludian Ms6.5
|
103.330,1
|
27.115,5
|
13.5
|
15.0[3]
|
|
2017 Jiuzhaigou Ms7.0
|
103.837,6
|
33.165,5
|
15.9
|
16.9[4]
|
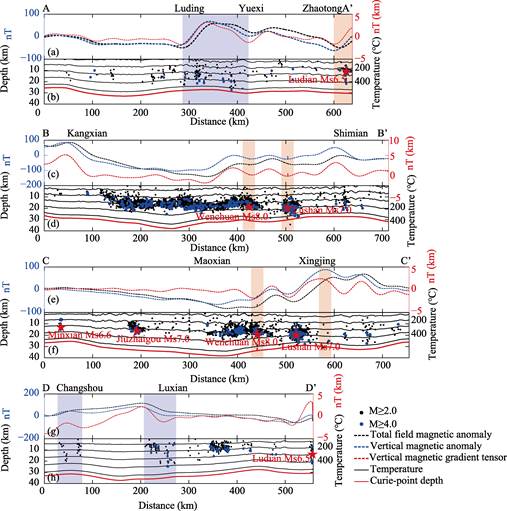
Figure 3 Magnetic anomalies and gradient tensors, crustal temperature structures and distribution of relocated focal depths along four profile AA’ (a and b), BB’ (c and d), CC’ (e and f) and DD’ (g and h)
5 Discussion and Conclusion
The magnetic anomaly and hypocenter temperature structure dataset in Eastern Margin of Qinghai-Tibet Plateau includes the accurate relocation of 4,921 earthquakes with  in the eastern margin of the Qinghai-Tibet Plateau from 2008 to 2017 obtained by using two different crustal velocity models according to the double-difference relocation algorithm. The depths of relocated earthquakes domain 5–20 km. The dataset contains three components and total field and gradient tensor magnetic anomalies based on the NGDC-720 geomagnetic model. Most earthquakes occurred in the negative or strong/weak magnetic anomaly domains. The gradient tensor magnetic anomalies can identify the locations with intense seismicity better, especially with large earthquakes, than those on the vector and total field anomaly maps. In addition to the 2013 Minxian Ms6.6 earthquake, the other four earthquakes with M≥6.5 all occurred in regions with large Curie depths and low geothermal gradients. The crustal temperature structures indicate that most M≥2.0 earthquakes in the eastern margin of the Qinghai-Tibet Plateau occurred at temperature of 100–500 oC, and most M≥4.0 earthquakes occurred at temperature of 200–400 oC. The 2008 Wenchuan Ms8.0, 2013 Minxian Ms6.6, 2014 Ludian Ms6.5 and 2017 Jiuzhaigou Ms7.0 earthquakes all occurred at about 300 oC, while the 2013 Lushan Ms7.0 earthquake occurred at nearly 400 oC, which was related to local tectonic stress anomalies.
Author Contributions
Wang, J. designed the dataset and completed the manuscript. Zhang, G. W. and Liang, S. S. collected data for the earthquake relocations.
References
[1] Zhao, B., Gao, Y., Huang, Z. B., et al. Double difference relocation, focal mechanism and stress inversion of Lushan MS7.0 earthquake sequence [J]. Chinese Journal of Geophysics, 2013, 56(10): 3385–3395.
[2] Feng, H. K., Zhang, Y. S., Liu, X. Z., et al. Relocation of Mainshock and aftershocks of the 2013 Minxian-
Zhangxian MS6.6 Earthquake in Gansu [J]. China Earthquake Engineering Journal, 2013, 35(3): 443–447.
[3] Wang, W. L., Wu, J. P., Fang, L. H., et al. Double difference location of the Ludian MS6.5 earthquake sequences in Yunnan province in 2014 [J]. Chinese Journal of Geophysics, 2014, 57(9): 3042–3051.
[4] Yi, G. X., Long, F., Liang, M. J., et al. Focal mechanism solutions and seismogenic structure of the 8 August 2017 M7.0 Jiuzhaigou earthquake and its aftershocks, northern Sichuan [J]. Chinese Journal of Geophysics, 2017, 60(10): 4083–4097.
[5] Waldhauser, F., Ellsworth, W. L. A double difference earthquake location algorithm: method and application to the Northern Hayward fault, California [J]. Bulletin of the Seismological Society of America, 2000, 90(6): 1353–1368.
[6] Wang, J., Zhang, G. W., Li, C. F., et al. Magnetic anomaly and hypocenter temperature structure dataset in eastern margin of Tibetan Plateau [DB/OL]. Global Change Research Data Publishing & Repository, 2018. DOI: 10.3974/geodb.2018.08.04.V1.
[7] GCdataPR Editorial Office. GCdataPR data sharing policy [OL]. DOI: 10.3974/dp.policy.2014.05 (Updated 2017).
[8] Maus, S. An ellipsoidal harmonic representation of Earth’s lithospheric magnetic field to degree and order 720 [J]. Geochemistry, Geophysics, Geosystems, 2010, 11: Q06015.
[9] Blakely, R. J. Potential Theory in Gravity and Magnetic Applications [M]. Cambridge: Cambridge University Press, 1996: 1–441.
[10] Li, C. F., Wang, J. L., Zhou, Z. Y., et al. 3D geophysical characterization of the Sulu-Dabie orogen and its environs [J]. Physics of the Earth and Planetary Interiors, 2012, 192-193: 35–53.
[11] Wang, J., Zhang, G. W., Li, C. F., et al. Correlating seismicity to Curie-point depths in the eastern margin of the Tibetan Plateau [J]. Chinese Journal of Geophysics, 2018, 61(5): 1840–1852.
[12] Xu, M., Zhu, C. Q., Tian, Y. T., et al. Borehole temperature logging and characteristics of subsurface temperature in Sichuan basin [J]. Chinese Journal of Geophysics, 2011, 54(4): 1052–1060.
[13] Huang, F., Liu, Q. Q., He, L. J. Tectono-thermal modeling of the Sichuan Basin since the Late Himalayan period [J]. Chinese Journal of Geophysics, 2012, 55(11): 3742–3753.