Glacial Lake Bathymetry and Inventory Dataset in the Poiqu
Basin, Central Himalayas
Qi,
M. M.1,2 Liu, S. Y.1,2* Gao, Y. P.1,2 Zhu, Y.1,2 Xie, F. M.1,2 Wu, K. P.1,2
Yao, X. J.1,2
1. Institute of International
Rivers and Eco-Security, Yunnan University, Kunming 650091, China;
2. Yunnan Key Laboratory of
International Rivers and Transboundary Eco-security, Kunming 650091, China
3. College of Geography and
Environmental Science, Northwest Normal University, Lanzhou 730070, China
Abstract: The Poiqu Basin is located in the Central Himalayas,
with extensive glacial landforms and a complex and changing environment. It is
one of the areas with the most glacial lakes and the most frequent glacial lake
outburst floods worldwide. In September 2020, the authors conducted an in-situ bathymetric survey for five
moraine-dammed lakes in this region. Additionally, glacial lake boundaries were
extracted using 33 Landsat images from 1988, 2000, 2010 and 2020, as well as
maps from 1974. On this basis, the optimal glacial lake volume estimation
equation was then used to determine the lakes?? volume. The resulting dataset
comprises (1) glacial lake bathymetry, (2) a glacial lake inventory from 1974
to 2020 and the boundary data of five glacial lakes in September 2020 and (3)
glacial lake volume data. The dataset is archived in 102 data files in three
group files in .tif, .shp, and .xls data formats with a total file size of 4.92
MB (compressed into a single 766 KB file).
Keywords: lake bathymetry;
glacial lake inventory; glacial lake volume; Poiqu; Central Himalayas
DOI: https://doi.org/10.3974/geodp.2022.04.08
CSTR: https://cstr.escience.org.cn/CSTR:20146.14.2022.04.08
Dataset Availability Statement:
The dataset
supporting this paper was published and is accessible through the Digital Journal of
Global Change Data Repository at: https://doi.org/10.3974/geodb.2022.07.05.V1 or
https://cstr.escience.org.cn/CSTR:20146.11.2022.07.05.V1.
1 Introduction
The Poiqu Basin (Sun
Koshi) is a Koshi River tributary in the central Himalaya Region with highly
concentrated glacial lakes between China and Nepal and frequent glacial lake
outburst floods (GLOFs)[1]. This basin contains important
international trade ports (Zhangmu Port) and major highways (China?CNepal
Highway) between China and Nepal. Under the influence of global warming, GLOFs
have induced a series of secondary disasters in recent decades such as
downstream mudslides that have caused extensive damage to Zhangmu Port and the
China?CNepal Highway. In addition, the GLOFs that caused heavy casualties in
1981 and the transboundary floods that destroyed hydropower stations in Nepal
in 2016 all originated from the Poiqu Basin[2]. The frequent
occurrence of GLOFs has seriously affected the lives and property safety of
residents in disaster-affected areas, as well as influencing the development of
transportation, infrastructure, agriculture and animal husbandry, ice and snow
tourism, and even national defence in cold areas[3,4]; thus,
GLOFs have become a key factor restricting the sustainable economic and social
development of cold areas[5]. Therefore, to improve understanding of
GLOF risk, it is essential to develop glacial lake bathymetry and water storage
datasets for the Poiqu for disaster avoidance and mitigation purposes.
Glacial lake bathymetry
is directly related to GLOFs and is a key indicator of both flood volume and peak discharge[6].
The echo principle can be used to measure the depth of glacial lakes. Lake
basin 3D views can be obtained from complete bathymetric point cloud data of the
entire lake surface and, based on this method, the precise depth and volume of
the glacial lake can be obtained. In recent years, the use of unmanned boats
has become the preferred approach for glacial lake depth sounding?Dsuch vehicles
can carry a variety of data acquisition equipment, and use precise satellite
positioning and a range of sensors to achieve integrated underwater
measurements[1,7]. However, due to traffic and environmental
constraints, it is very difficult to measure the water depth of all glacial
lakes. In the currently published literature, there are likely less than 100
measured glacial lake depth data points on the third pole; however, according
to the latest glacial lake inventories, there are more than 30,000 glacial
lakes in this region[8]. Accurately estimating glacial lake volumes
is critical to assessing the potential of GLOFs. Accordingly, this issue has
motivated the development of a range of empirical relationships to estimate the
link between lake depths, areas and volumes. Qi et al. (2022)[1] constructed a new glacial lake volume
method based on extensive bathymetry data; compared with other existing
formulas, this method significantly reduces the uncertainty of estimation
results. Here, we provide bathymetric data for five glacial lakes in the Poiqu
Basin. In addition, we provide multi-period glacial lake volume estimation
results from 1974 and 2020 based on the new volume estimation method[1],
which can provide essential basic data for assessing the GLOF risk in this
region.
2 Metadata of the Dataset
The content of the dataset[9]
consists of three parts, including: (1) glacial lake
bathymetry; (2) glacial lake inventory from 1974 to 2020 and (3) glacial lake
volume. A detailed
description of the dataset is shown in Table 1.
3 Methods for Data
Production Development
3.1 Glacial Lake
Bathymetry
In this study, we
used an unmanned boat with a single-beam echo sounder (CHCNAV D230) for
bathymetric surveying. This equipment combines a dual Global Navigation
Satellite System positioning and heading sensor with a stable and reliable hull
attitude and an Inertial Measurement Unit sensor. To ensure that the transducer
was always immersed in the water and to prevent the transducer and propeller
from touching the lake bedrock, the measurement route was located at least 2?C5
m from the lake??s shore. Given the harsh survey environment, with risks
including frequent falling rocks and floating ice, using an automatic route
planning method would have been hazardous; thus, the sensor systems were manually
remotely controlled. Accordingly, some inaccessible parts of the lakes near the
glacier terminus were not surveyed for Jialong Co, Longmuqie Co and Chamaqudan
Co. However, the investigation tracks and sampling points were not arranged
polygonally, the investigation tracks nonetheless covered most of the lake and
fulfilled the data density requirements for spatial interpolation. The
depth-sounding process and bathymetric survey routes for the five glacial lakes
are shown in Figure 2.
Table 1 Metadata summary of the Glacial
lake bathymetry and inventory dataset in the Poiqu and adjacent area of the
central Himalayas
|
Items
|
Description
|
|
Dataset full name
|
Glacial lake
bathymetry and inventory dataset in the Poiqu and adjacent area of the
central Himalayas
|
|
Dataset short
name
|
GlacialLakes_Poiqu
|
|
Authors
|
Qi, M. M. GLQ-7037-2022, Institute of
International Rivers and Eco-Security, Yunnan University, qmm@mail.ynu.edu.cn
Liu, S. Y. AAT-4278-2020, Institute of
International Rivers and Eco-Security, Yunnan University,
shiyin.liu@ynu.edu.cn
Gao, Y. P. GLQ-7281-2022, Institute of
International Rivers and Eco-Security, Yunnan University,
gyp_geogis@mail.ynu.edu.cn
Zhu, Y. ABD-2058-2020, Institute of
International Rivers and Eco-Security, Yunnan University, yuzhu@mail.ynu.edu.cn
Xie, F. M. ABD-3175-2020, Institute of
International Rivers and Eco-Security, Yunnan University, xfm@mail.ynu.edu.cn
Wu, K. P. AEB-7274-2022, Institute of
International Rivers and Eco-Security, Yunnan University,
wukunpeng@ynu.edu.cn
Yao, X. J. H-1333-2015, College of
Geography and Environmental Science, Northwest Normal University,
xj_yao@nwnu.edu.cn
|
|
Geographical
region
|
85??40¢E‒86??20¢E, 27??20¢N‒28??40¢N
|
|
Time resolution
|
Sep. 1. 2020?CSep.
14. 2020; 1974?C2020
|
|
Spatial
resolution
|
4 m
|
|
Data files
|
.shp, .tif, .xls
|
|
Data size
|
6.12 MB
|
|
Data files
|
(1) glacial lake
bathymetry; (2) glacial lake inventory; (3) glacial lake volume
|
|
Foundations
|
Ministry of
Science and Technology of P. R. China (2019QZKK0208, 2021YFE0116800);
National Natural Science Foundation of China (42171129); Yunnan University
(YJRC3201702, 2021Z018, 2020Z47); Scientific Research Fund project of Yunnan
Education Department (2022Y059)
|
|
Computing
environment
|
Python 3.7, MATLAB
R2021a
|
|
Data publisher
|
Global Change
Research Data Publishing & Repository, http://www.geodoi.ac.cn
|
|
Address
|
No. 11A, Datun
Road, Chaoyang District, Beijing 100101, China
|
|
Data sharing
policy
|
Data from
the Global Change Research Data Publishing & Repository includes metadata, datasets
(in the Digital Journal of Global Change Data Repository), and
publications (in the Journal of Global Change Data & Discovery). Data sharing policy
includes: (1) Data are openly available and can be free downloaded via the
Internet; (2) End users are encouraged to use Data subject to
citation; (3) Users, who are by definition also value-added service
providers, are welcome to redistribute Data subject to written permission
from the GCdataPR Editorial Office and the issuance of a Data redistribution
license; and (4) If Data are used to compile new
datasets, the ??ten per cent principal?? should be followed such that Data
records utilized should not surpass 10% of the new dataset contents, while
sources should be clearly noted in suitable places in the new datase[10]
|
|
Communication and
searchable system
|
DOI, CSTR, Crossref, DCI, CSCD,
CNKI, SciEngine, WDS/ISC, GEOSS
|

Figure 1 The depth-sounding process
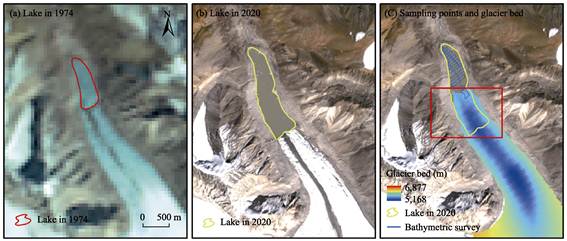
Figure 2 (a) Longmuqie Co and mother glacier in
1974; (b) Longmuqie Co and mother glacier in 2020; (c) Bathymetric surveying
route of the Longmuqie Co in 2020 and glacier bed topography in 1974. The base
maps are Landsat and Sentinel-2 images
In this study, the incomplete bathymetric data for
Jialong Co, Longmuqie Co and Chamaqudan Co were supplemented based on the
glacier bed topography. These lakes were classified as proglacial lakes whose
expansion is caused by glacier retreat; in this case, we interpreted the
underwater terrain of these lakes near the glacier terminus to be equivalent to
the basal topography of the glacier tongue before retreating. We first
estimated the ice thickness and bed topography of glaciers using the Volume and
Topography Automation (VOLTA) tool[11,12]. The glacial bed
topography of the 1970s, as modeled by VOLTA, was then used to supplement the
areas where no sampling points were available in this study, as shown in Figure
2. The lake
volume can then be estimated by interpolating between the limited sampling
points and the glacier bed data.
3.2 Glacial Lake
Inventory
In this study, a
total of 33 Landsat images with a spatial resolution of 30 m from 1988 to 2020,
were obtained via the Google Earth Engine platform, and two topographic maps of
1974 were used to extract glacial lake boundaries. The annual lake boundary was
then mapped via the satellite imagery-derived normalized difference water index
(NDWI) followed by strict visual quality assurance and case-by-case manual
inspection.
3.3 Glacial Lake
Volume
The volume of glacial lakes
can be calculated by the following equations[1]:
If A larger
than 0.1 km2,
 (1)
(1)
If A less
than 0.1 km2,
 (2)
(2)
 (3)
(3)
where V was the lake volume (??106 km3), A was the lake area (km2),
and R was the maximum width (m)
divided by the maximum length (m) of the glacial lake.
3.4 Uncertainty Analysis
The water volume estimation uncertainty mainly relates to two aspects: the
reliability of the bathymetric survey and the glacier bed topography data. In
this study, we performed rigorous error analysis for both the bathymetric data and calculation methods. The accuracy of the
individual survey points (d??ob), interpolation error (d??in) and error in lake area (d??ar) were quantitatively estimated. Given their low degree of dependence
(if any), these errors can be assumed to be independent (Mart??nespañol et al., 2016). The uncertainties in volume estimation (d??V) can be estimated as:
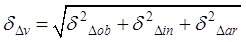 (4)
(4)
The d??ob term mainly results
from measurement errors (such as the actual sound velocity and motor rotation
speed) and external factors (such as water temperature differences, bubbles in
the water, the rocking of the boat, etc.)[14]. In this study, the
echo sounder data accuracy is assumed to be 0.01 m ?? 0.1% of the measured
depth. Furthermore, given a ??2 ??C temperature uncertainty, the corresponding
depth error is around ??0.7% based on similar previous studies[14]. Additionally, we assumed a further 0.1% depth uncertainty due to the
presence of nearshore rock outcrops[14] and measurement errors,
thus making our overall uncertainty for bathymetric analysis ??1.9% of the water
depth. The value of d??in depends primarily on the representativeness of the observed points.
Here, we applied the cross-validation technique to assess the spatial
interpolation of the bathymetric data; in this approach, 80% of the observation points were used for
interpolation and the remaining 20% was used for testing, with the average
deviation between the two values then calculated. The value of d??ar can be calculated
using the following
formula[15]:
 (5)
(5)
where P (m) was the perimeter of the lake, and G (m) was the spatial resolution of the images used.
4
Data Results and Validation
4.1 Dataset Composition
The dataset includes (1) glacial lake
bathymetry; (2) glacial lake inventory from 1974 to 2020, and the boundary data
of 5 glacial lakes in September 2020; and (3) glacial lake volume. The dataset
is archived in 102 data files in three group files in .tif, .shp, and .xls data
formats. The detailed description of the dataset is shown in Table 2 and the
meanings of each field in the glacial lake inventory are shown in Table 3.
Table 2 Descriptions
of the dataset files
|
Data Name
|
Data Properties
|
Data Size
|
|
File Name
|
Time Range
|
Resolution
|
Descriptions
|
|
Glacial lake bathymetry.tif
|
Lake bathymetry_Jialong Co.tif
|
Sep. 1.
2020?CSep. 14. 2020
|
4 m
|
Lake bathymetry
|
3.5 MB
|
|
Lake bathymetry_Tara Co.tif
|
|
Lake bathymetry_Paqu Co.tif
|
|
Lake bathymetry_Longmuqie Co.tif
|
|
Lake bathymetry_Chmaqudan Co.tif
|
|
Glacial lake inventory.shp
|
Lake_boundary_JialongCo.shp
|
Sep.2020
|
10 m
|
Lake bathymetry
|
1.34 MB
|
|
Lake_boundary_TaraCo.shp
|
|
Lake_boundary_PaquCo.shp
|
|
Lake_boundary_LongmuqieCo.shp
|
|
Lake_boundary_ChamaqudanCo.shp
|
|
Glacial lake_1974.shp
|
1974
|
9 m
|
Lake inventory
|
|
Glacial lake_1988.shp
|
1988
|
30 m
|
|
Glacial lake_2000.shp
|
2000
|
|
Glacial lake_2010.shp
|
2010
|
|
Glacial lake_2020.shp
|
2020
|
|
Glacial lake volume.xls
|
Glacial lake volume.xls
|
1974?C2020
|
/
|
Lake volume
|
84 KB
|
Table 3 Descriptions of each field
name in the glacial lake inventory
|
Field name
|
GLAKE_ID
|
GL_Type
|
GL_Elev
|
GL_Area
|
|
Mean
|
Lake number
|
Lake type
|
Lake elevation (m)
|
Lake area
|
|
Field name
|
GL_Peri
|
GL_A_Error
|
GL_Long
|
GL_Lati
|
|
Mean
|
Lake perimeter (m)
|
Area error
|
Longitude
|
Latitude
|
|
Field name
|
Width
|
Length
|
Ratio
|
|
Mean
|
Maximum width (m)
|
Maximum length (m)
|
The ratio of width to length
|
4.2 Data Results
Table 4 shows the
bathymetric results for the five glacial lakes. Jialong Co and Chawuqudan Co
had the maximum water depths of 136 m and 74 m, whereas the other three glacial
lakes were all less than 40 m in depth. A 3D view of the lakes?? basin
morphology was created based on the bathymetric data (Figure 3). Not all
glacial lake bottoms are as flat as those of Jialong Co and Chawuqudan Co. For
example, the Paqu Co and Tara Co lakes exhibit a basin bottom morphology with
their deepest regions near the moraine dam and glacier terminus. We suggest
that this morphology is the result of the formation and coalescence of two
small glacial lakes, an interpretation that is strongly supported by earlier
remote sensing images.
In 2020,
103 glacial lakes with a total area of 20.35 ?? 1.51 km2 were
identified above 4,200 m elevation in the Poiqu Basin (Figure 4a). Most of the
glacial lakes were less than 0.1 km2 in size, and the ice-contacted
lakes had the largest average area (0.61 ?? 0.02 km2). A total of 24
lakes were newly formed in the Poiqu Basin between 1974 and 2020, and the total
lake area increased by 97%. This expansion was mainly contributed by the moraine-dammed lakes
directly connected to the glacier. Using the formulas
in section 3.3, the total lake volume in the Poiqu Basin in 2020 was estimated
as 831??30.1 million m3. The corresponding estimated lake volumes in
previous decades were 764??23.3 million m3 in 2010, 574??21.5 million
m3 in 2000, 448??14.5 million m3 in 1988 and 335??7.8
million m3 in 1974. Overall, the total glacial lake volume increased
by 148% from 1974 to 2020 (Figure 4b).
Table 4 The results of bathymetry for five glacial lakes in 2020
|
Attributes
|
Jialong Co
|
Longmuqie Co*
|
Paqu Co
|
Tara Co
|
Chamaqudan Co*
|
|
Position (??)
|
85.85E, 28.21N
|
86.23E, 28.35N
|
86.16E, 28.30N
|
86.13E, 28.29N
|
86.19E, 28.33N
|
|
Date
|
2020.09.04
|
2020.09.01
|
2020.09.13
|
2020.09.14
|
2020.09.03
|
|
Area (km2)
|
0.58??0.03
|
0.59??0.04
|
0.58??0.05
|
0.24??0.02
|
0.54??0.03
|
|
Width max (m)
|
608
|
508
|
318
|
342
|
443
|
|
Length max (m)
|
1,433
|
1,770
|
2,162
|
1,054
|
1,482
|
|
Depth mean (m)
|
62
|
14
|
16
|
12
|
36
|
|
Depth max (m)
|
135.80??2.58
|
30.70??0.58
|
36.30??0.68
|
24.20??0.45
|
73.68??1.40
|
|
Volume (106 m3)
|
37.53??0.03
|
8.28??0.04
|
8.80??0.05
|
2.64??0.02
|
19.60??0.03
|
(*
indicates sampling sites not completely covering the whole lake surface)

Figure 3 The 3D view of lake basin morphology
based on the bathymetric data
Figure 4 Glacial lake inventory and volume change
from 1974 and 2020.
4.3 Data
Validation
Table 5 shows the lake volume error based on the bathymetric survey.
Overall, the
uncertainties in volume estimation (d??V)
based on the bathymetric data were all below 50 m3 and the mean
error was 34 m3. By considering the three types of uncertainties, a
mean uncertainty of 0.4% was obtained based on the bathymetric data, which was
deemed accurately reflect the lake volume. In practical applications, since the
error is small and unlikely to affect the results, it can be ignored.
Table 5 The error of lake volume based on the bathymetry
|
Name
|
d??ob (m)
|
d??in (m)
|
d??ar (km2)
|
d??V (??106 m3)
|
|
Jialong Co
|
??2.58
|
1.5
|
??0.03
|
??0.03
|
|
Chamaqudan Co
|
??1.40
|
0.69
|
??0.03
|
??0.03
|
|
Longmuqie Co
|
??0.58
|
0.51
|
??0.04
|
??0.04
|
|
Paqu Co
|
??0.68
|
1.00
|
??0.05
|
??0.05
|
|
Tare Co
|
??0.45
|
1.01
|
??0.02
|
??0.02
|
In this study, we
selected Jialong Co, with complete bathymetric data[16], as an
example to verify the glacier bed data availability. Figure 5 shows a
significant difference between the bathymetric map (Figure 5a) and the
simulated glacier bed topography (Figure 5b); however, after the corrections
were applied, the water depth changes between both datasets indicate some similarities
(Figure 5a, c and d). The estimated lake volume was 37,535,223 m3
before correction and 38,999,117 m3 after correction, i.e. a
relative error of +3.9%, suggesting that our calculation provides a reasonable
approximate estimate. In addition, this outcome also demonstrates that using
glacier bed topography data to estimate lake volumes was a valid approach where
bathymetric data are not available.
Figure 5 Comparison between bathymetric data and
simulated glacier bed topography
5 Discussion and Summary
In this dataset, the
basal topography of five glacial lakes was constructed based on an in-situ bathymetric survey combined with
simulated glacier bed data. In addition, we mapped a glacial lake inventory
from 1974 and 2020 in the Poiqu Basin. Finally, the volumes of all the lakes
were estimated using the optimized water volume estimation formula.
Due to the harsh
field survey environment of the glacial lakes, the bathymetric data of the
three lakes in this dataset were incomplete. Therefore, this study used
simulated glacier bed topography to supplement the missing data and
systematically evaluate the feasibility and accuracy of this method. The final
data after secondary development was highly credible enough to be used as
important input data in the assessment of glacial lake outburst flood
disasters.
This dataset provides bathymetric data for five
glacial lakes. The lake inventory and volume results can systematically and
comprehensively reveal changes in both the area and water storage of the glacial
lakes from 1974 to 2020. In summary, the compilation of basic data provided in
this dataset will help to assist in assessing glacial lake outburst risks and
disasters in this area and provide an important reference for the sustainable
development of alpine regions.
Author Contributions
Liu, S. Y. and
Qi, M. M. designed the algorithms and research framework of the dataset. Gao,
Y. P., Zhu, Y., Xie, F. M., Wu, K. P. and Yao, X. J. performed the bathymetric survey. Qi, M. M. wrote the
data paper and Liu, S. Y. reviewed the paper.
Conflicts of Interest
The authors
declare no conflicts of interest.
References
[1] Qi, M. M., Liu, S. Y., Wu, K. P., et al. Improving the accuracy of glacial lake volume estimation: a
case study in the Poiqu basin, central Himalayas [J]. Journal of Hydrology, 2022, 610: 127973.
[2] Nie, Y., Liu, Q., Wang, J. D., et
al. An inventory of historical glacial lake outburst floods in the
Himalayas based on remote sensing observations and geomorphological analysis [J].
Geomorphology, 2018, 308: 91?C106.
[3] Liu, S. Y., Wu, T. H., Wang, X., et
al. Changes in the global cryosphere and their impacts: a review and new
perspective [J]. Sciences in Cold and
Arid Regions, 2020, 12(6): 343−354.
[4] Gao, Y. P., Liu, S. Y., Qi, M. M., et al. Glacier-related hazards along the international karakoram
highway: status and future perspectives [J]. Frontiers in Earth Science, 2021, 9: 611501.
[5] Wu, G. J., Yao, T. D., Wang, W. C., et al. Glacial hazards on Tibetan Plateau and surrounding alpines [J].
Bulletin of Chinese Academy of Sciences,
2019, 34(11), 1285?C1292.
[6] Qi, M. M., Liu, S. Y., Gao, Y. P. Zhangmu and Gyirong ports under
the threat of glacial lake outburst flood [J]. Sciences in Cold and Arid Regions, 2020, 12(6): 461−476.
[7]
Yao,
X. J., Liu S. Y., Sun, M. P., et al.
Volume calculation and analysis of the changes in moraine-dammed lakes in the
north Himalaya: a case study of Longbasaba lake [J]. Journal of Glaciology, 2012, 58: 753?C760.
[8] Wang, X., Guo, X., Yang, C., et
al. Glacial lake inventory of high-mountain Asia in 1990 and 2018 derived
from Landsat images [J]. Earth System
Science Data, 2020, 12: 2169?C2182.
[9] Qi, M. M., Liu, S. Y., Gao, Y. P., et al. Glacial lake bathymetry and inventory dataset in the Poiqu
and adjacent area of the central Himalayas [J/DB/OL]. Digital Journal of Global Change Data Repository, 2022.
https://doi.org/10.3974/geodb.2022.07.05.V1.
https://cstr.escience.org.cn/CSTR:20146.11.2022.07.05.V1.
[10] GCdataPR Editorial Office. GCdataPR data sharing policy [OL].
https://doi.org/10.3974/dp.policy.2014.05 (Updated 2017).
[11] Kienholz, C., Rich, J. L., Arendt, A., et al. A new method for deriving glacier centerlines applied to
glaciers in Alaska and northwest Canada [J]. Cryosphere, 2014, 8: 503?C519.
[12] Paul, F., Barry, R. G., Cogley, J. G., et al. Recommendations for the compilation of glacier inventory
data from digital sources [J]. Annals of
Glaciology, 2010, 50: 119?C126.
[13] Mart??nespañol, A., Lapazaran, J. J., Otero, J., et al. On the errors involved in ice-thickness estimates i:
ground-penetrating radar measurement errors [J]. Journal of Glaciology, 2016, 62: 1008?C1020.
[14] Haritashya, U. K., Kargel, J. S., Shugar, D. H., et al. Evolution and controls of large
glacial lakes in the Nepal Himalaya [J]. Remote
Sensing, 2018, 10: 798.
[15] Hanshaw, M. N., Bookhagen, B. Glacial areas, lake areas, and snow
lines from 1975 to 2012: status of the Cordillera Vilcanota, including the
Quelccaya Ice Cap, northern central Andes. Peru [J]. Cryosphere, 2014, 8: 359?C376.
[16] Li, D., Shangguan, D. H., Wang, X. Y., et al. Expansion and hazard risk assessment of glacial lake
Jialong Co in the central Himalayas by using an unmanned surface vessel and
remote sensing [J]. Science of Total
Environment, 2021, 784: 147249.