A Dataset on the Spatial Distribution of Annual
Precipitation in Middle and Western China (2010)
Jiang, Y. H.1,2 Li, B. L.1,2* Yuan, Y. C.1 Gao, X. Z.1 Zhang, T.1,2 Liu, Y.1,2
Li, Y.1,2 Li, H.3
Luo, Z. Y.3 Ma, Q.3 Wang, X. M.3 Ciren, D. J.4
1. State Key Laboratory of Resources and Environmental
Information Systems, Institute of Geographic Sci
ences and Natural Resources Research, Chinese Academy of
Sciences, Beijing 100101, China;
2. University of Chinese Academy of Sciences, Beijing 100049, China
3. Meteorological Bureau of Mongolian Autonomous County of
Henan, Tibetan Autonomous Prefecture of Huangnan 811599, Qinghai, China;
4. Lhasa Meteorological Bureau, Lhasa 850000, Tibet, China
Abstract: The data set on the spatial distribution of annual
precipitation in middle and western China (2010) is a simulation of regional
precipitation with High Accuracy Surface Modeling (HASM), applying Hybrid
Interpolation. The method includes three steps: First, steady precipitation
changes within the space, or the trend surface, is represented with the TRMM
data (spatial interpolation results from station observations values); then the
residue values without the trend surface is calculated by incorporating the
ground station observation values and interpolated with HASM, obtaining the
residual field in the space with unsteady changes; finally, the interpolation
calculation is completed by adding the trend surface and the residual field.
The results show that HASM simulation with TRMM as the background field is significantly
more precise and more adaptive than traditional interpolation methods. Mean
Absolute Error (MAE) and Root Mean Square Error (RMSE) are used as the
precision assessment indexes for the results. On a global scale, MAE and RMSE
are 125.15mm and 155.80mm, respectively; on a local scale, MAE and RMSE are
167.53mm and 228.81mm, respectively. An article about the findings from the
data set has been published on the Journal of Geo-Information Science 2015 Vol.
17 Issue 8.
Keywords: precipitation; TRMM satellite; high accuracy surface modeling; middle and west China; Journal of Geo-Information Science
1 Introduction
Precipitation is an important environmental variable and
plays an essential role in surface runoff, atmospheric movement, and agricultural
resources. Large-scale precipitation data are usually based on the results of
discrete site observations and are obtained using spatial interpolation. The
traditional spatial interpolation method does not consider the characteristics
of the spatial surface itself. In the modeling process, the constraint effect
of the intrinsic factors on the surface reconstruction is neglected, while HASM
could effectively resolve the issue of peak flattening and boundary turbulence
that are difficult to avoid with traditional interpolation methods[1].
However, in areas with fewer stations, the feasibility of the HASM model is
greatly restricted. Satellite remote sensing data allows for large-scale and
synchronous observation, which can make up for the limited observation range of
ground stations. Therefore, the accuracy of spatial simulation of regional
precipitation could be improved by integrating satellite precipitation product
information while simulating precipitation with HASM[2].
The data set on the spatial distribution of annual precipitation in middle
and western China (2010)[3] is funded by the Department of
Science and Technology projects of the People??s Republic of China. This product
is developed on the basis of the readily available TRMM 3B43 V7 data product
with 0.25????0.25?? resolution[4?C5]. To resolve the issue of poor HASM accuracy in
regions with fewer stations, setting the TRMM data as the background field
(trend surface) by using hybrid interpolation, the residual field is revised
with HASM (after removing the trend) to improve HASM??s depicting capacity of
spatial details of regional precipitation. The revised product is compared with
the results generated from ground station interpolation to validate its
effectiveness.
2
Metadata of Dataset
The metadata for the ??A dataset on the spatial distribution of
annual precipitation in middle and western China (2010)?? is summarized in Table
1. It
includes the name, authors, geographical areas, decade of the
data, temporal resolution, spatial resolution, composition of the data set,
platform for data publication and sharing services, and data sharing policies.
etc.
Table 1 Metadata summary for the ??A dataset on
the spatial distribution of annual precipitation in middle and western China
(2010)??
|
Items
|
Description
|
|
Dataset full name
|
A data set on
the spatial distribution of annual precipitation in middle and western China
(2010)
|
|
Dataset short name
|
PrecipMidwesternChina2010
|
|
Authors
|
Jiang, Y. H. N-8765-2019, State Key Laboratory of Resources and Environmental Information
Systems, Institute of Geographic Sciences and Natural Resources Research,
Chinese
Academy of Sciences, jiangyh@lreis.ac.cn
|
|
Li, B. L. N-8884-2019, State Key Laboratory of Resources and
Environmental Information
Systems, Institute of Geographic Sciences and Natural Resources Research,
Chinese
Academy of Sciences, libl@lreis.ac.cn
|
|
Yuan, Y.C. N-9047-2019, State Key Laboratory of Resources and Environmental Information
Systems, Institute of Geographic Sciences and Natural Resources Research,
Chinese
Academy of Sciences, yuanyc@lreis.ac.cn
|
|
Gao, X, Z. N-1655-2019, State Key Laboratory of Resources and Environmental Infor[1]mation Systems, Institute
of Geographic Sciences and Natural Resources Research, Chinese Academy of
Sciences, gaoxz@lreis.ac.cn
|
|
Liu, Y. N-8844-2019, State Key Laboratory of Resources and Environmental Infor[1]mation Systems, Institute
of Geographic Sciences and Natural Resources Research, Chi[1]nese Academy of Sciences,
liuy.18b@igsnrr.an.c.cn
|
|
|
Li, Y. Y-4384-2019,
State Key Laboratory of Resources and Environmental Infor[1]mation Systems, Institute
of Geographic Sciences and Natural Resources Research, Chi[1]nese Academy of Sciences,
liying9391@126.com
|
|
|
Li Hong, Meteorological Bureau of Mongolian Autonomous
County of Henan, Tibetan Autonomous Prefecture of Huangnan, lh691208@163.com
|
(To be Continued on the next page)
(Continued)
|
Item
|
Description
|
|
Authors
|
Luo Zhiying, Meteorological Bureau of Mongolian Autonomous
County of Henan, Tibetan Autonomous Prefecture of Huangnan, 393352158@qq.com
|
|
Ma Qiang, Meteorological Bureau of Mongolian Autonomous
County of Henan, Tibetan Autonomous Prefecture of Huangnan, 107082968@qq.com
|
|
Wang Xiaoming, Meteorological Bureau of Mongolian
Autonomous County of Henan, Tibetan Autonomous Prefecture of Huangnan, 2444869807@qq.com
|
|
Ciren Duoji, Lhasa Meteorological Bureau, LSNSE111@126.com
|
|
Geographical region
|
25??N?C35??N??105??E?C115??E,
including Chongqing, Guizhou, Hunan, Hubei, the majority of Henan, eastern
Sichuan, southern Shaanxi and southeastern Gansu, with total area of 1.06??106
km2.
|
|
Year
|
2010 Temporal
resolution 1 month
|
|
Spatial resolution
|
0.25????0.25?? Data format .shp,
.tif
|
|
Data size
|
59 KB
(compressed)
|
|
Data files
|
The data set is composed
of 2 folders:
Folder ??grids_precip??
stores 4 files in the tiff format: hasm_idw2010.tif, hasm_kriging2010.tif,
hasm_spline2010.tif and hasm_trmm2010.tif, representing the 2010
precipitation data with Inverse Distance Weighted (IDW), Kriging
interpolation, Spline interpolation and TRMM data results as the HASM drive
field and using hybrid interpolation. The spatial resolution is 0.25??;
(2) Folder
??pts_precip?? stores 2 vector files in the .shp format, including stps 96 and
stps 25, which respectively stores the location of the 96 national weather
stations and 25 local weather stations in the region of interest (field lat
and lon refer to latitude and longitude respectively), station code (field
no_st) and the accumulated precipitation in 2010 (field precip).
|
|
Foundations
|
Ministry of Science and
Technology of P. R. China (2016YFC0500205, 2015CB954103)
|
|
Computing Enviroment
|
Matlab 2011b; ArcGIS campus license of Institute of Geographical
Sciences and Natural Resources Research, Chinese Academy of Sciences,
Beijing, China.
|
|
Data publisher
|
Global Change Research Data Publishing & Repository,
http://www.geodoi.ac.cn
|
|
Address
|
No. 11A, Datun Road, Chaoyang District, Beijing 100101, China
|
|
Data sharing policy
|
Data from the Global Change
Research Data Publishing & Repository includes metadata, datasets (data
products), and publications (in this case, in the Journal ofGlobal Change
Data &
Discovery). Datasharing
policy includes: (1) Data are
openly available and can be free downloaded via the Internet; (2) End users
are encouraged to use Data subject
to citation; (3) Users,
who are by definition also value-added service providers, are welcome to
redistribute Data
subject to written permission from the GCdataPR Editorial Office and
the issuance of a Data
redistribution license; and (4) If Data are used to compile new datasets, the ??ten percent
principal?? should be followed such that Data
records utilized should not surpass 10% of the new dataset contents,
while sources should be clearly noted in suitable places in the new dataset[6]
|
|
Communication and searchable system
|
DOI, DCI, CSCD, WDS/ISC, GEOSS, China GEOSS
|
3 Methods
3.1
Algorithm Principles
Precipitation
interpolation results are more uncertain in sparce stations and in areas with
greater ground surface change. Remote sensing precipitation products could well
manifest the spatial distribution patterns of precipitation. Therefore, this
data set applies hybrid interpolation incorporated with the HASM model and
remote sensing precipitation product to simulate the regional precipitation.
The method includes three steps: First, steady precipitation changes within the
space, or the trend surface, is represented with the TRMM data (or spatial
interpolation results from contrast methods); then the residue values without
the trend surface is calculated by incorporating the ground station observation
values and interpolated with HASM, obtaining the residual field in the space
with unsteady changes; finally, the final interpolation results are obtained by
adding the trend surface and the residual field.
3.2
Technical Route
In the
hybrid interpolation, HASM, IDW, Spline AND kriging interpolation results and
TRMM data were applied to calculate the trend surface. The respective
interpolation results are expressed as HASM_I, HASM_S, HASM_K and HASM_t. The
HASM model equation system is resolved with iteration, using the Preconditioned
Conjugate Gradient [7] (Figure 1).
|
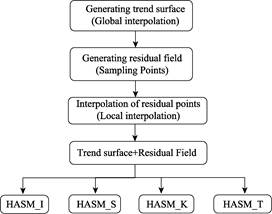
Figure 1 A dataset
on the spatial distribution of annual precipitation in middle and western
China (2010)
Technical route for research and development
|
Large-scale model simulation
accuracy is tested, using randomly selected standard weather stations as the
modelling points and the remaining weather stations as global validation
points; Without changing the modelling points, all local weather stations are
used as local validation points to test the simulation effects of small-scale
models. HASM of the background field is simulated and its results are compared
by using the TRMM data product, IDW, Spline and Kriging interpolation results
with 0.25????0.25?? as the analysis unit.
4 Results and Validation
4.1
Composition of Results
The data set is composed of 2 folders:
(1) Folder
??grids_precip?? stores 4 files in the tiff format: hasm_idw2010.tif,
hasm_kriging2010.tif, hasm_spline2010.tif and hasm_trmm2010.tif, representing
the 2010 precipitation data with Inverse Distance Weighted (IDW), Kriging
interpolation, Spline interpolation and TRMM data results as the HASM drive
field and using hybrid interpolation. The spatial resolution is 0.25??;
(2) Folder ??pts_precip?? stores 2
vector files in the .shp format, including stps96 and stps 25, which
respectively stores the location of the 96 national weather stations and 25
local weather stations in the region of interest (field lat and lon refer to
latitude and longitude respectively), station code (field no_st) and the
accumulated precipitation in 2010 (field precip).
4.2
Data Results
It can
be sen from Figure 2 that precipitation data from four sources have similar
spatial distribution patterns. Results of HASM simulation with TRMM as the drive
filed have manifested more information on spatial changes in precipitation in
regions without station observation, which are superior to other HASM
simulation results with drive fields generated from traditional interpolation
methods. In Figure 2, there are few discrepencies in the HASM-simulated spatial
patterns of precipitation in various background fields, generally exhibiting a
gradual decrease in precipitation from the southeast to the northwest. Results
of HASM simulation with TRMM as the drive filed have manifested more
information on spatial changes in precipitation in regions without station
observation, which are superior to other HASM simulation results with drive
fields generated from traditional interpolation methods. Locus A in the figure
is a drastic transition area from humid and semi-humid regions to semi-arid
regions, where the precipitation should present a rapidly decreasing trend from
the southeast to the northwest [8]. Of the four methods, only the
HASM_T method was able to simulate such changes. Locus B is situated in the
Weihe Plain, where HASM_T was able to simulate precipitation distribution that
is consistent with the results of previous studies. Locus C is the upstream of
the Lishui River on the northen branch of the Wuling Mountains. It is one of
the precipitation centres of Hunan Province. Locus D is the Hengyang-Shaoyang
hugelland region and a primary ??arid area?? [9] of Hunan Province.
HASM_T dinstinctly reflected these regions of precipitation extrema.
4.3
Validation
It can bee seen from Figure 2 that accuracy of HASM
simulation with TRMM as the drive filed is superior to that of HASM simulation
with traditional interpolation methods as the drive field. In the global
validation results, the MAE and RMSE of HASM_T is 125 and 156mm (Table 2),
respectively. The MAEs of HASM_I, HASM_S and HASM_K are 212, 234 and 192mm,
which are respectively 70%, 87% and 54% higher than HASM_T results; the RMSEs
are 260, 328 and 241mm, which are respectively 67%, 110% and 54% higher than
HASM_T results. In the local validation results, the MAE and RMSE of HASM_T is
168 and 229mm, respectively. The MAEs of HASM_I, HASM_S and HASM_K are 196, 198
and 197mm, which are respectively 17%, 18% and 17% higher than HASM_T results;
the RMSEs are 263, 260 and 256mm, which are respectively 15%, 14% and 12%
higher than HASM_T results.
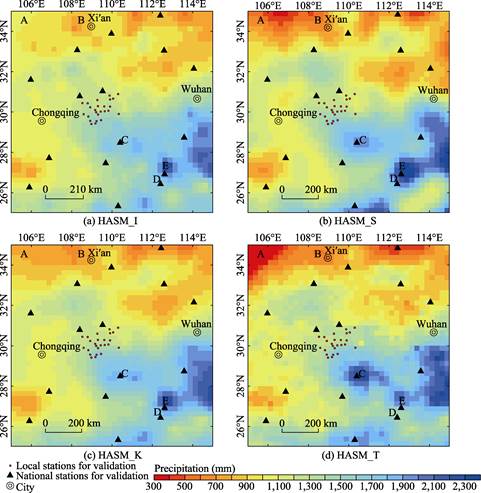
Figure
2 HASM simulated precipitation distribution in
different background fields
Table 2 HASM calculation accuracy in different
background fields (mm)
|
Validation point
|
HSAM_I
|
HSAM_S
|
HSAM_K
|
HSAM_T
|
|
MAE
|
RMSE
|
MAE
|
RMSE
|
MAE
|
RMSE
|
MAE
|
RMSE
|
|
Global
|
212
|
260
|
234
|
328
|
192
|
241
|
125
|
156
|
|
Local
|
196
|
263
|
198
|
260
|
197
|
256
|
168
|
229
|
5 Discussion
and Conclusion
This
data set uses TRMM satellite precipitation data as the background field and
revises the residual field by incorporating the HASM model. The spatial
distribution of precipitation in 2010 is simulated with middle and western
China as an example; in the meantime, precipitation spatial distribution data
are obtained with traditional interpolation. HASM simulation with TRMM as the
background field is significantly more accurate than traditional interpolation
methods. On a global scale, MAE and RMSE are 125.15mm and 155.80mm, respectively;
on a local scale, MAE and RMSE are 167.53mm and 228.81mm, respectively. HASM
simulation results with local region TRMM as the background field can better
reflect the basic spatial patterns of precipitation. The results can show the
rapid changes in precipitation, reflect precipitation extrema areas and effectively
avoid outstanding phenomenon due to high observation values of individual
stations occurring in traditional spatial interpolation algorithms. In
different sub-regions, HASM simulation with TRMM as the background field has
lower deviation better adaptability.
Author Contributions
Li,
B. L. and Jiang, Y. H. created the overall design for the data collection
development; Liu, Y. and Li, Y. processed the TRMM
precipitation data; Zhang, T. and Yuan, Y.
C. designed the model and algorithm; Gao, X. Z. performed data verification; Li, H.,
Luo, Z. Y., Ma, Q., Wang, X. M. and CiRen, DuoJi. provided the weather station
data. Jiang, Y. H. and Li, B. L. wrote the data
paper.
References
[1]
Zhao, N., Jiao, Y. M., et al. Downscaling of TRMM Satellite
Precipitation Data [J]. Journal of Geo-Information
Science, 2018, 20(10): 20?C27.
[2]
Zhang, T. Li, B. L., Zhao, N., et al. Analysis on High Accuracy Surface
Modeling in Regional Rainfall
[3]
Estimation Combined with TRMM
Data [J]. Journal of Geo-Information
Science, 2015, 17(8): 895?C901
[4]
Jiang Y. H., Li B. L., Yuan, Y.
C., et al. A dataset on the spatial
distribution of annual precipitation in middle and western China (2010)
[DB/OL], Global Change Research Data Publishing and Re-pository, 2019. DOI:
10.3974/geodb.2019.05.18.V1.
[5]
Kummerow, C., Barnes, W. The tropical
rainfall measuring mission (TRMM) sensor package [J]. Journal of Atmospheric and Oceanic Technology, 1998, 15: 809?C817.
[6]
Huffman, G. J., Bolvin, D. T.,
Nelkin, E. J., et al. The TRMM
multisatellite precipitation analysis (TMPA): quasi-global, multiyear,
combined-sensor precipitation estimates at fine scales [J]. Journal of Hydrometeorology, 2007, 8(1):
38?C55.
[7]
GCdataPR
Editorial Office. GCdataPR data sharing policy [OL]. DOI:
10.3974/dp.policy.2014.05 (Updated 2017).
[8]
Golub, G. H., Van Loan, C. F.
Matrix Computations [M]. Beijing: Posts & Telecom Press, 2009.
[9]
Zhao, X., Ma, J. Z., Nie, Z.
Q., et al. Spatiotemporal pattern of
precipitation in Tianshui region and its response to the Indian Ocean dipole [J].
Arid Zone Research, 2009, 26(6): 917-922
[10]
You, X., Li, C., Yu, W. H.
Analysis of Precipitation Characteristics in Hunan Province [J]. Hunan Hydro & Power, 2004 (6):41-43.