1 km Growing Season Length Data Product over China-ASEAN (2013)
LI, J. Xia, C. F. Liu, Q. H.* Zhao, J. Wang, C. Peng, J. J.
State Key Laboratory of Remote Sensing Science, Institute of Remote Sensing and Digital Earth, Chinese Academy of Sciences, Beijing 100101, China
Abstract: The Growing Season Length (GSL) determines the effective growth periods of vegetation. Using the Leaf Area Index (LAI) and NDVI products, GSL product of China and the Association of Southeast Asian Nations (ASEAN) for 2013 with a spatial resolution of 1 km (MuSyQ-GSL-1km-2013) was developed by a universal multi-life-cycle phenology monitoring method (UMPM). The data indicates that the vegetation growing season length is from 0 to 365 days in China and ASEAN region. The spatial pattern of vegetation growing season length is significantly associated with vegetation types. The growing season length of the tropical rain forest, which is full year, is the longest. The growing season length of the crop is between 180 to 240 days, and the grass is shorter than 180 days. Comparisons with the data from 194 ground observations show that the correlation coefficient between GSL derived from MODIS LAI and from ground observation ranged from 0.64 to 0.82. The MuSyQ-GSL-1km-2013 product could better characterize vegetation communities. The MuSyQ- GSL-1km-2013 dataset is achieved in a single file in .tif data format and compressed file size of 11.2 MB.
Keywords: China; ASEAN; remote sensing; phenology; length of vegetation season day; Leaf Area Index (LAI)
1 Introduction
The vegetation phenology is a more directly and sensitively comprehensive indicator for the seasonal and annual changes of environmental conditions, and it is important to global climate changes and the terrestrial ecosystems studies[1]. The Growing Season Length (GSL) is defined as the effective length of the plants growth stages during a whole year. The effective length records the days from the start to the end of the season[2]. 1 km Growing Season Length Data Product over China-ASEAN (2013)[3] is a useful dataset for the regional studies. In this paper, the detailed information and basic principle of the dataset production was
given and its validation was also demonstrated.
2 Metadata of Dataset
The metadata of the 1 km Growing Season Length Data Product over China-ASEAN (2013)[3] is summarized in Table 1. It includes the dataset full name, short name, authors, year of the dataset, temporal resolution, spatial resolution, data format, data size, data files, data publisher, and data sharing policy, etc.
Table 1 Summary of the MuSyQ-GSL-1 km-2013 dataset metadata
|
Items
|
Description
|
|
Dataset full name
|
1 km growing season length data product over China and the Association of Southeast Asian Nations for 2013
|
|
Dataset short name
|
MuSyQ-GSL-1km-2013
|
|
Authors
|
Li, J. R-7298-2016, State Key Laboratory of Remote Sensing Science, Institute of Remote Sensing and Digital Earth, CAS, lijing01@radi.ac.cn
Xia, C. F. M-4146-2017, State Key Laboratory of Remote Sensing Science, Institute of Remote Sensing and Digital Earth, CAS, xiachuanfu2897@163.com
Liu, Q. H. S-1647-2016, State Key Laboratory of Remote Sensing Science, Institute of Remote Sensing and Digital Earth, CAS, liuqh@radi.ac.cn
Zhao, J. A-3272-2017, State Key Laboratory of Remote Sensing Science, Institute of Remote Sensing and Digital Earth, CAS, zhaojing1@radi. ac.cn
Wang, C. M-4144-2017, State Key Laboratory of Remote Sensing Science, Institute of Remote Sensing and Digital Earth, CAS, wangcong418@ 126.com
Peng, J. J. S-1261-2016, State Key Laboratory of Remote Sensing Science, Institute of Remote Sensing and Digital Earth, CAS, rspeggy@163.com
|
|
Geographic region
|
The geographical region covers the area from 10°55′12″S to 53°32′24″N, 73°37′12″E to 141°0′36″E
The region covers the area of the following 11 nations: Brunei, Cambodia, China, Indonesia, Laos, Malaysia, Myanmar, Philippines, Singapore, Thailand, and Vietnam
|
|
Year
|
2013
|
|
Temporal resolution
|
Yearly Spatial resolution 1 km
|
|
Data format
|
.tif
|
|
|
|
Data size
|
92.8 MB (11.2 MB in Compressed file)
|
|
|
|
Data files
|
One data file: MuSyQ_GSL_1km_2013.tif
|
|
Foundations
|
Ministry of Science and Technology of P. R. China (2012AA12A304, 2013AA12A301)
|
|
Data publisher
|
Global Change Research Data Publishing & Repository, http://www.geodoi.ac.cn.
|
|
Address
|
No. 11A, Datun Road, Chaoyang District, Beijing 100101, China.
|
|
Data sharing policy
|
Data from the Global Change Research Data Publishing & Repository includes metadata, datasets (data products), and publications (in this case, in the Journal of Global Change Data & Discovery). Data sharing policy includes: (1) Data are openly available and can be free downloaded via the Internet; (2) End users are encouraged to use Data subject to citation; (3) Users, who are by definition also value-added service providers, are welcome to redistribute Data subject to written permission from the GCdataPR Editorial Office and the issuance of a Data redistribution license; and (4) If Data are used to compile new datasets, the ‘ten per cent principal’ should be followed such that Data records utilized should not surpass 10% of the new dataset contents, while sources should be clearly noted in suitable places in the new dataset[4]
|
3 Methods
The input data of UMPM algorithm is mainly LAI time series product at least one year. Considering the absence of LAI inversions during the observation periods, the LAI time series data were reconstructed based on the BISE algorithm. The numbers of the growth cycle were extracted by combining of the Fourier and polynomial function fitting method. The key transition dates were extracted for each growing cycle based on the Logistic function fitting as the main algorithm and piecewise linear fitting as a backup algorithm. Then, the growing season length dataset were calculated from these key transition dates[5]. The flowchart of the UMPM algorithm based on remote sensing LAI products was shown in Figure 1.
Because of the higher miss rate of LAI inversions in the tropical rain forest areas and the lower value of LAI inversions in the desert or Gobi region of western China, the UMPM algorithm was failure to extract the validate phenology parameters. Therefore, a NDVI threshold method was used to estimate the growing season length when the UMPM algorithm failed. When NDVI value was greater than 0.2 from the whole year NDVI data, the sum of the selected NDVI periods was considered as the growing season length.
|
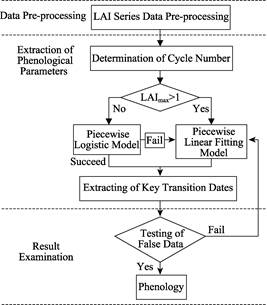
Figure 1 Flowchart of the growing season length extracted from remote sensing LAI products
|
4 Results and Data Validation
4.1 Data Products
The 1 km Growing Season Length Data Product over China-ASEAN (2013) is recorded by the geographic coordinates with the .tif data format. The spatial distribution of the growing season length over China-ASEAN is shown in Figure 2.
The spatial distribution of vegetation growing season length is significantly different in China-ASEAN region in 2013. The growing season length is increased from northwest to southeast, and it is also related to the vegetation types. The growing season is full year in the Malay Islands near the equator, and around 310 days in the subtropical forests and shrubs regions in the Sichuan, Yunnan and Guangxi province of China, and the Indo-China Peninsula, 180 to 240 days in the North China Plain which dominated by farmland, and less than 180 days in Northeast of China and Northern Xinjiang region, and even no any suitable day for vegetation growing in high mountains in Himalaya region.
4.2 Data Validation
The phenology extraction results were validated based on the ground phenology observations. The ground phenology observations were obtained from the China Meteorological Administration (CMA) and Chinese Ecosystem Research Network (CERN). The ground phenology observations include various ground-cover types, such as grass, forest, bare land, wheat, cotton, rice, and soybean. The ground phenology observations with better data integrity and representativeness sites were 194, which included 36 CERN stations and 158 CMA agricultural meteorological stations. There is a strong correlation between the phenology extraction results from remote sensing and ground phenology observations, and the correlation coefficients range from 0.64 to 0.82. The phenology extraction results from remote sensing in this paper were better agreed with the ground phenology observations, and it can better describe the phenological characteristics of plant communities[6]??

Figure 2 Spatial distribution map of growing season length over China-ASEAN (2013)
5 Discussion and Conclusion
The phenological characteristic parameters extracted from the UMPM algorithm of this paper have a good agreement with the ground phenology observations. It could more accurately describe the phenological characteristics of plant communities. These phenological characteristics can be widely used in studies of the vegetation phenology monitoring and global climate change, and have great significance for in-depth research on global climate change and its relationship with terrestrial ecosystems.
Author Contributions
Li, J., Xia, C. F., and Liu, Q. H. designed the algorithms of dataset. Wang, C. contributed to the data validation. Zhao, J. and Peng, J. J. wrote the data paper.
References
[1] Chen, X. Q., Hu, B. and Yu, R. Spatial and temporal variation of phenological growing season and climate change impacts in temperate eastern China [J]. Global Change Biology, 2005, 11(7): 1118-1130.
[2] Wu, Y. F., Li, M. S., Li, J. Research on a Detection Method of Chinese Terrestrial Vegetation Greenness Periods Based on Remote Sensing [J]. Journal of Remote Sensing, 2008, 12(1): 92-103.
[3] Li, J., Xia, C. F., Liu, Q. H., et al. 1 km Growing Season Length Product over China and the Association of Southeast Asian Nations for 2013 [DB/OL]. Global Change Research Data Publishing & Repository, 2015. DOI: 10.3974/geodb.2015.02.03.V1.
[4] GCdataPR Editorial Office. GCdataPR Data Sharing Policy [OL]. DOI: 10.3974/dp.policy.2014.05 (Updated 2017).
[5] Xia, C. F., Li, J., Liu, Q. H. Vegetation phenology monitoring method using time-series MODIS LAI data [J]. Transactions of the Chinese Society of Agricultural Engineering, 2012, 28(19): 103-109.
[6] Gao, Y. B. Validation and analysis of remote sensing phenology products in china [D]. Beijing: Institute of Remote Sensing and Digital Earth, Chinese Academy of Sciences, 2014.