250 m Raster Dataset of Vegetation Classification in the
Xizang Autonomous Region Based on FY-3D NDVI (2020)
Zhang, L.1 Zhou, G. S.2* Ren, H. R.1 Lv, X. M.2
Ji, Y. H.2
1. Department of Geomatics,
Taiyuan University of Technology, Taiyuan 030024, China;
2. Chinese Academy of
Meteorological Sciences, Beijing 100081, China
Abstract: Understanding the
complex vegetation types in the Xizang Autonomous Region is
vital for assessing and monitoring ecosystem health. This study developed the 250
m raster dataset of vegetation classification in the Xizang Autonomous Region
(2020) utilizing the Google Earth Engine (GEE)
platform, the random forest (RF) classification algorithm, and data
encompassing terrain, climate, and FY-3D NDVI data. This map, with a 250 m spatial
resolution, achieved an overall accuracy (OA) of 81.5% and a Kappa coefficient
of 0.79. The results showed that the FY satellite data demonstrates high
precision in regional vegetation mapping. This dataset is essential for
comprehending the characteristics of Xizang Autonomous Region??s vegetation, the
ecological changes within the region, and how they respond to climatic factors. The dataset includes: (1) vegetation
classification system table, and (2) vegetation distribution data in 250 m raster
in 2020. The dataset is archived in .xlsx and .tif formats, and consists of 2
data files with data size of 3.16 MB (compressed to one single file with 2.73
MB).
Keywords: Xizang Autonomous
Region;
GEE; FY satellite; vegetation map; RF
DOI: https://doi.org/10.3974/geodp.2024.01.05
CSTR: https://cstr.escience.org.cn/CSTR:20146.14.
2024.01.05
Dataset Availability Statement:
The dataset supporting this paper was published and is accessible through
the Digital Journal of Global Change Data Repository at: https://doi.org/10.3974/geodb.2024.04.07.V1 or
https://cstr.escience.org.cn/CSTR:20146.11.2024.04.07.V1.
1 Introduction
Vegetation,
referring to the Earth??s surface plant communities, plays a pivotal role in
maintaining biodiversity, preserving soil stability, and regulating the
hydrological cycle, thus forming the cornerstone of the planet??s environmental
health. Vegetation maps, as a representation of vegetation distribution, not
only serve as foundational data revealing the patterns and driving factors of
surface vegetation distribution but also provide essential information for land
management, environmental conservation, and natural disaster prevention.
Recently, remote
sensing data from satellites such as Sentinel, Landsat, and the MODIS series
has become essential for acquiring land cover/land use information, owing to
their high-quality spatio-temporal resolution. Products derived from the
Sentinel series, like ESA WorldCover 10m[1] and Sentinel-2 10m Land
Use/Land Cover[2], are recognized for their detailed land cover
representations. Similarly, Landsat series-based products, including
GlobeLand30[3], CLCD[4], and GLC_FCS30[5],
play a crucial role in land cover research at both global and regional levels.
The MODIS-based MCD12Q1 product[6] is also pivotal in tracking
long-term global changes. Contrastingly, the Fengyun-3 (FY-3) satellite, as
China??s second-generation polar-orbiting climate satellite, provides FY-3D
remote sensing data[7]. Compared to remote sensing data from
Sentinel, Landsat, and MODIS, FY-3D does not have significant advantages in
terms of spatial resolution, spectral resolution, and temporal coverage.
Additionally, it lacks support from cloud platforms like Google Earth Engine
(GEE) and Pixel Information Expert Engine (PIE-Engine). Therefore, FY-3D data
is less commonly used in the field of regional vegetation mapping, and its
effectiveness and potential application value still need further validation and
exploration.
Located at the
center of the Qinghai-Tibet Plateau, the Xizang Autonomous Region is
distinguished by its diverse terrain, extreme climate, and unique environment.
Understanding the vegetation distribution is vital for local sustainable
development and ecological conservation in the region and beyond. This study
aims to map the complex vegetation distribution in the Xizang Autonomous Region
using FY remote sensing data. The objective is to explore the characteristics
and patterns of vegetation in the Xizang Autonomous Region and to evaluate the
effectiveness of the FY satellite in regional vegetation mapping tasks.
2 Metadata of the Dataset
The
metadata of the 250 m raster dataset of vegetation classification in the Xizang
Autonomous Region based on FY-3D NDVI (2020)[8] is summarized in
Table 1. It includes the dataset full name, short name, authors, year of the
dataset, spatial resolution, data format, data size, data files, data
publisher, and data sharing policy, etc.
3 Methods
3.1 Study Area
The Xizang Autonomous Region
is located between 26??50ʹN to 36??53ʹN and 78??25ʹE to 99??06ʹE, with an average
altitude of over 4,000 m and a total area of about 1.202,8 million km2.
Known as one of the highest regions in the world, the Xizang Autonomous Region
is characterized by a terrain that slopes from northwest to southeast,
featuring intersecting mountains and vast plateaus. Influenced by the southern
Himalayas, the Xizang Autonomous Region exhibits marked precipitation
differences between the northern and southern parts, resulting in a warm and
moist climate in the southeast contrasted with a cold and dry climate in the
northwest. The vegetation in the Xizang Autonomous Region is varied,
encompassing broad-leaved forest, coniferous forest, scrub, meadow, grassland,
and desert. The central plateau is predominantly covered with extensive meadow and
grassland, whereas the southeast, benefiting
from warm and humid conditions, is rich in forest cover. Scrubs are
Table 1 Metadata
summary of the 250 m raster dataset of vegetation classification in the Xizang
Autonomous Region based on FY-3D NDVI (2020)
|
Items
|
Description
|
|
Dataset full name
|
250 m raster
dataset of vegetation classification in the Xizang Autonomous Region based on
FY-3D NDVI (2020)
|
|
Dataset short
name
|
VegetationXizang2020
|
|
Authors
|
Zhang, L.,
Taiyuan University of Technology, zhanglei1136@link.tyut.edu.cn
Zhou, G. S.,
Chinese Academy of Meteorological Sciences, zhougs@cma.gov.cn
Ren, H. R.,
Taiyuan University of Technology, renhongrui@tyut.edu.cn
Lv, X. M.,
Chinese Academy of Meteorological Sciences, lvxm@cma.gov.cn
|
|
Geographical
region
|
Xizang Autonomous
Region
|
|
Year
|
2020
|
|
Spatial
resolution
|
250 m
|
|
Data format
|
.xlsx, .tif
|
|
|
|
Data size
|
3.16 MB (2.73 MB
after compression)
|
|
|
|
Data files
|
The dataset
consists of 2 data files, which includes: (1) vegetation classification
system table and (2) vegetation distribution data at 250 m resolution in 2020
|
|
Foundation
|
Ministry of
Science and Technology of P. R. China (2019QZKK0106)
|
|
Data publisher
|
Global Change Research Data Publishing & Repository,
http://www.geodoi.ac.cn
|
|
Address
|
No. 11A, Datun
Road, Chaoyang District, Beijing 100101, China
|
|
Data sharing
policy
|
(1) Data are openly available and can be
free downloaded via the Internet; (2) End users are encouraged to use Data subject to citation; (3) Users,
who are by definition also value-added service providers, are welcome to
redistribute Data subject to
written permission from the GCdataPR Editorial Office and the issuance of a Data redistribution license; and (4)
If Data are used to compile new
datasets, the ??ten percent principal?? should be followed such that Data records utilized should not
surpass 10% of the new dataset contents, while sources should be clearly
noted in suitable places in the new dataset[9]
|
|
Communication and searchable system
|
DOI, CSTR, Crossref,
DCI, CSCD, CNKI, SciEngine, WDS/ISC, GEOSS
|
typically found in the area surrounding the
central Lhasa River Valley. In the northwest, the region is characterized by
its vast desert vegetation, creating a unique desert ecosystem[10, 11].
3.2 Data Sources
In
this study, vegetation in the Xizang Autonomous Region was classified into 12
vegetation types: broad-leaved forest, coniferous forest, coniferous and
broad-leaved mixed forest, scrub, alpine meadow, alpine grassland, alpine
vegetation, alpine desert, cultivated vegetation, wetland, water, and other.
This categorization is based on the Vegetation Map of the People??s Republic of
China (1:1,000,000)[12]. Sample data, comprising 2,774 points, was obtained from 2020
high-resolution Google online imagery (Figure 1). Samples were visually chosen
to ensure consistent vegetation types within a 250 m radius around each. These
samples, covering various vegetation types, were spread across the study area.
As detailed in Table 2, 90% of the samples were used for training, with the
remaining 10% reserved for validation.
The remote sensing data used in this study
was obtained from the FY-3D MERSI-II 10-day composite vegetation index dataset
available through the FENGYUN Satellite Data Center,
featuring a temporal resolution of 10 days and a spatial resolution of 250 m,
encompassing six bands including blue, green, red, near-infrared, NDVI, and
EVI. This study selected 36 NDVI images from 2020 as vegetation mapping
features. This dataset missing values in areas of water, glacier, and snow
cover. Therefore, this study recalculated the NDVI values for these regions
using the red and near-infrared bands (Equation1).
Table 2 Statistics of training and validation
samples for the Xizang Autonomous Region vegetation distribution data at 250 m raster
(2020)
|
Vegetation types
|
Training samples
|
Validation samples
|
Total
|
|
Broad-leaved
forest
|
239
|
27
|
266
|
|
Coniferous
forest
|
120
|
12
|
132
|
|
Coniferous and
broad-leaved mixed forest
|
79
|
5
|
84
|
|
Scrub
|
111
|
9
|
120
|
|
Alpine meadow
|
409
|
44
|
453
|
|
Alpine grassland
|
490
|
49
|
539
|
|
Alpine vegetation
|
166
|
22
|
188
|
|
Alpine desert
|
193
|
26
|
219
|
|
Cultivated
vegetation
|
102
|
10
|
112
|
|
Wetland
|
82
|
8
|
90
|
|
Water
|
252
|
35
|
287
|
|
Other
|
256
|
28
|
284
|
|
Total
|
2,499
|
275
|
2,774
|
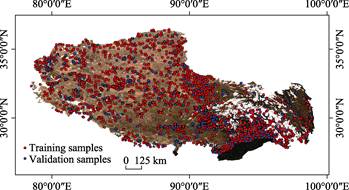
Figure 1 Spatial distribution of training and
validation samples for the Xizang Autonomous Region vegetation distribution
data at 250 m raster (2020)
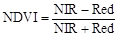 (1)
(1)
where
NIR is the near-infrared band and Red is the red band in FY remote sensing
data.
The terrain data
for this study was obtained from the Shuttle Radar Topography Mission (SRTM)
provided by the USGS[13], with a spatial resolution of 30 m. This
data was used to calculate the elevation, slope, and aspect in the Xizang
Autonomous Region for vegetation mapping. The climate data, including annual
average temperature[14] and annual precipitation[15] for
2020, was sourced from the National Tibetan Plateau / Third Pole Environment
Data Center at a spatial resolution of
1,000 m. To achieve consistency across the datasets, the elevation, slope,
aspect, annual average temperature, and annual precipitation were resampled to 250
m using the GEE platform.
3.3 Study Methods
3.3.1 GEE Platform and RF Model
The
GEE cloud platform is renowned for its robust geospatial data processing
capabilities and the comprehensive integration of satellite imagery.
Consequently, it has been widely applied in fields such as climate change and
environmental monitoring[16]. A variety of machine learning models
are compatible with GEE, such as support vector machine (SVM), RF, and gradient
boosting tree (GBT). In this study, the RF classification model[17]
was employed for vegetation mapping. This model operates by randomly selecting
samples and features to train each decision tree, thereby enhancing
classification accuracy through the combination of predictions from multiple
trees. Such an approach effectively minimizes the risk of overfitting and
improves the capacity to generalize to new datasets, leading to its widespread
use in a range of complex analytical tasks.
3.3.2 Feature Importance Evaluation and Feature
Selection
Utilizing
a combination of terrain, climate, and remote sensing data, this study
developed 41 vegetation mapping features. These features include elevation,
slope, aspect, annual average temperature, annual precipitation, and 36 NDVI
features derived from the FY3D MERSI-II 10-day composite vegetation index
dataset. To prevent model overfitting caused by an excess of features, an
approach combining incremental feature selection with minimization of
out-of-bag (OOB) error was employed to identify the most effective features for
mapping. The process began with assessing the importance of each of the 41
features within the RF model, ranking them from the most to the least
importance. Subsequently, models were constructed incrementally, starting with
the most important feature and progressively including less significant ones,
thus forming various combinations of RF models. The out-of-bag error (OOB
error), which is the misclassification rate of the samples not included in the
training of each decision tree in the random forest, was calculated for each
model. The mapping features corresponding to the model with the lowest OOB
error were then utilized in the construction of the final random forest model
for vegetation mapping.
3.3.3 Evaluation of Mapping Accuracy
Employing
the GEE platform, this study constructed a RF model using the optimal set of
features. Combining terrain, climate, and FY-3D NDVI data enabled the creation
of the 250 m raster dataset of vegetation classification in the Xizang Autonomous
Region (2020). The mapping accuracy was evaluated with the confusion matrix
method, which involved calculating the overall accuracy (OA) (Equation 2),
Kappa coefficient (Equation 3), producer??s accuracy (PA) (Equation 4), and
user??s accuracy (UA) (Equation 5).
 (2)
(2)
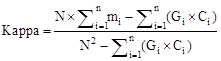 (3)
(3)
 (4)
(4)
 (5)
(5)
where
mi is the count of
correctly classified samples in class i; n represents the total categories; N
is the sum of all classified pixels; Ci
indicates the pixels classified into class i; Gi is the actual count of pixels in class i; OA is
used to denote overall accuracy; Kappa for the Kappa coefficient; PA symbolizes
producer??s accuracy; UA defines user??s accuracy.
3.4 Technical Route
The
main development process, as depicted in Figure 2, began with the collection of
terrain, climate, and FY-3D NDVI data from 2020, which were resampled to a 250
m resolution. This step generated 41 mapping features, including elevation, slope,
aspect, annual average temperature, annual precipitation, and 36 NDVI features
from the FY3D MERSI-II 10-day composite vegetation index dataset. Subsequently,
2,774 representative vegetation samples, selected via visual interpretation
from high-resolution Google online imagery, were divided into training (90%)
and validation (10%) sets. Utilizing the training set, the study identified an
optimal feature set through incremental selection and minimizing OOB error,
which then served as the foundation for constructing the RF classification
model. This model??s effectiveness was assessed using metrics such as OA, UA,
PA, and the Kappa coefficient, based on the validation samples. Finally, by
employing the developed RF classification model and integrating terrain,
climate, and remote sensing data, this study produced the Xizang Autonomous
Region vegetation distribution data at 250 m resolution (2020).
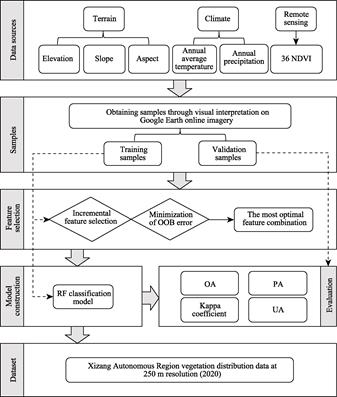
Figure 2 Flowchart of dataset
development
4 Data Results and Validation
4.1 Data Results
Incremental
feature selection and OOB error minimization were utilized to identify the most
effective features for vegetation mapping in this study. Analysis showed that
increasing the number of features led to a reduction in OOB error, which
reached its minimum of 0.16 with 14 features. However, the error slightly
increased to 0.17 as the number of features grew to 41, indicating no further
enhancement in model performance beyond 14 features. Therefore, this study
identified a set of 14 optimal features for effective mapping: elevation,
slope, annual average temperature, annual precipitation, and various NDVI
indices (NDVI_0720, NDVI_1020, NDVI_0110, NDVI_0220, NDVI_0310, NDVI_0229,
aspect, NDVI_0930, NDVI_1031, and NDVI_0120). Utilizing these features with the
RF classification model, vegetation distribution data of the Xizang Autonomous
Region with 250 m for 2020 was produced (Figure 3). The distribution area of
each vegetation type in the Xizang Autonomous Region for 2020 was then
calculated (Table 3).
Table 3 Distribution area of each vegetation type
in the Xizang Autonomous Region in 2020
|
Vegetation types
|
Area (km2)
|
Vegetation types
|
Area (km2)
|
|
Broad-leaved forest
|
49,039.6
|
Alpine vegetation
|
136,594.9
|
|
Coniferous forest
|
49,870.5
|
Alpine desert
|
154,924.0
|
|
Coniferous and broad-leaved mixed forest
|
7,163.1
|
Cultivated vegetation
|
3,834.1
|
|
Scrub
|
10,386.3
|
Wetland
|
4,259.3
|
|
Alpine meadow
|
292,323.9
|
Water
|
32,169.5
|
|
Alpine grassland
|
404,775.0
|
Other
|
63,814.6
|
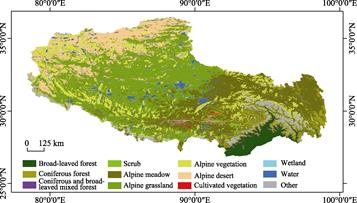
Figure 3
Map of Xizang Autonomous Region vegetation at 250 m raster (2020)
4.2 Data Validation
The
Xizang Autonomous Region vegetation distribution data at 250 m resolution
(2020) exhibited an overall accuracy of 0.81 and a Kappa coefficient of 0.79,
with details of the confusion matrix, PA, and UA provided in Table 4. The UA for
coniferous and broad-leaved mixed forest, scrub, alpine meadow, alpine
vegetation, and wetland were all below 80%, with coniferous and broad-leaved
mixed forest and alpine vegetation specifically at 40.0% and 54.5%,
respectively. Furthermore, the UA shows that coniferous and broad-leaved mixed
forest, alpine grassland, alpine desert, and cultivated vegetation did not
exceed 80%, with coniferous and broad-leaved mixed forest at 50.0%.
According to the confusion matrix, there
is noticeable confusion between the broad-leaved forest and coniferous and
broad-leaved mixed forest, as well as between alpine grassland and alpine
meadow. Coniferous and broad-leaved mixed forest, comprising both broad-leaved
and coniferous tree species, exhibit spectral characteristics intermediate to
those of broad-leaved and coniferous forests. The phenological changes in
broad-leaved trees during spring and autumn, particularly the budding and
shedding of leaves, lead to NDVI values that closely resemble those of a
broad-leaved forest. This similarity often leads the RF model to misclassify
coniferous and broad-leaved mixed forests as broad-leaved forests. Alpine
meadows and alpine grassland, both consisting of herbaceous plants, often
intertwine in their transition zones, forming ecological transition areas. This
intermingling leads to significant similarities in NDVI values in these
regions, making the accurate classification of these vegetation types
difficult. Alpine vegetation, situated between the treeline or scrub line and the
lower limit of the perennial snowline, exhibits low and sparse coverage.
Accurately extracting this type of vegetation is a significant challenge due to
its distribution characteristics.
Table 4 Confusion matrix, PA, and UA of the
Xizang Autonomous Region vegetation distribution data at 250 m raster (2020)
|
|
Broad-
leaved
forest
|
Conife-rous forest
|
Coniferous and broad-
leaved
mixed forest
|
Scrub
|
Alpine mea-
dow
|
Alpine
grass-
land
|
Alpine
vegeta-
tion
|
Al-
pine desert
|
Culti-vated vege-
tation
|
Wet-
land
|
Water
|
Other
|
Total num-ber of types
|
PA
|
|
Broad-leaved forest
|
24
|
1
|
2
|
0
|
0
|
0
|
0
|
0
|
0
|
0
|
0
|
0
|
27
|
88.9%
|
|
Coniferous forest
|
0
|
12
|
0
|
0
|
0
|
0
|
0
|
0
|
0
|
0
|
0
|
0
|
12
|
100.0%
|
|
Coniferous and broad-leaved mixed forest
|
3
|
0
|
2
|
0
|
0
|
0
|
0
|
0
|
0
|
0
|
0
|
0
|
5
|
40.0%
|
|
Scrub
|
0
|
0
|
0
|
6
|
3
|
0
|
0
|
0
|
0
|
0
|
0
|
0
|
9
|
66.7%
|
|
Alpine meadow
|
0
|
0
|
0
|
1
|
35
|
7
|
0
|
0
|
0
|
1
|
0
|
0
|
44
|
79.5%
|
|
Alpine grassland
|
0
|
0
|
0
|
0
|
0
|
43
|
0
|
5
|
0
|
0
|
1
|
0
|
49
|
87.8%
|
|
Alpine vegetation
|
0
|
0
|
0
|
0
|
2
|
3
|
12
|
0
|
0
|
0
|
0
|
5
|
22
|
54.5%
|
|
Alpine desert
|
0
|
0
|
0
|
0
|
0
|
2
|
1
|
22
|
0
|
0
|
1
|
0
|
26
|
84.6%
|
|
Cultivated vegetation
|
0
|
0
|
0
|
0
|
0
|
0
|
0
|
0
|
9
|
0
|
0
|
1
|
10
|
90.0%
|
|
Wetland
|
0
|
0
|
0
|
0
|
0
|
0
|
0
|
0
|
0
|
6
|
2
|
0
|
8
|
75.0%
|
|
Water
|
0
|
0
|
0
|
0
|
1
|
3
|
0
|
2
|
0
|
0
|
29
|
0
|
35
|
82.9%
|
|
Other
|
0
|
0
|
0
|
0
|
0
|
0
|
1
|
0
|
3
|
0
|
0
|
24
|
28
|
85.7%
|
|
Total number of types
|
27
|
13
|
4
|
7
|
41
|
58
|
14
|
29
|
12
|
7
|
33
|
30
|
275
|
|
|
UA
|
88.9%
|
92.3%
|
50.0%
|
85.7%
|
85.4%
|
74.1%
|
85.7%
|
75.9%
|
75.0%
|
85.7%
|
87.9%
|
80.0%
|
|
|
5 Discussion and Conclusion
Based
on terrain, climate, and FY remote sensing data, this study utilized the GEE
platform and the RF model to produce the Xizang Autonomous Region vegetation
distribution data at 250 m resolution (2020). This map achieved an OA of 81.5%
and a Kappa coefficient of 0.79. The mapping features used in the RF model
underscored topography and climate as key determinants of vegetation
distribution in the Xizang Autonomous Region. Among these features, elevation,
slope, annual average temperature, and annual precipitation were the most
influential. The study revealed that ranging from forest, scrub, alpine meadow,
and alpine grassland to alpine desert from southeast to northwest, and alpine
grassland and scrub to alpine vegetation with increasing altitude. Moreover,
this vegetation distribution data achieved high accuracy using FY-3D MERSI-II
NDVI data, a contrast to distribution data typically reliant on satellite data
from Sentinel, Landsat, and MODIS. This highlights the potential of China??s FY
satellite in the realm of vegetation mapping.
In summary, this
dataset not only reveals a more detailed vegetation distribution in the Xizang
Autonomous Region but also validates the potential of domestic FY satellite in
regional vegetation mapping. It should be noted, however, that in areas with
transitional vegetation, as well as regions where vegetation is dispersed and
fragmented, the 250 m spatial resolution may lead to overlap in spectral
information and mixed pixel phenomena.
Author Contributions
Zhou,
G. S. and Ren, H. R. designed the algorithms of dataset. Lv, X. M. and Ji, Y.
H. performed data validation. Zhang, L. collected, processed the data, and
wrote the data paper.
Conflicts of Interest
The
authors declare no conflicts of interest.
References
[1] Venter,
Z. S., Barton, D. N., Chakraborty, T., et al. Global 10 m land use land
cover datasets: A comparison of dynamic world, world cover and esri land cover
[J]. Remote Sensing, 2022, 14(16): 4101.
[2]
Karra, K., Kontgis, C.,
Statman-Weil, Z., et al. Global land use/land cover with Sentinel 2 and
deep learning [C]. 2021 IEEE international geoscience and remote sensing
symposium IGARSS. Institute of
Electrical and Electronics Engineers, 2021: 4704?C4707.
[3]
Chen, J., Ban, Y., Li, S. Open
access to Earth land-cover map [J]. Nature, 2014, 514(7523): 434?C434.
[4]
Yang, J., Huang, X. The 30 m
annual land cover dataset and its dynamics in China from 1990 to 2019 [J]. Earth
System Science Data, 2021, 13(8): 3907?C3925.
[5]
Zhang, X., Liu, L., Chen, X., et
al. GLC_FCS30: Global land-cover product with fine classification system at
30 m using time-series Landsat imagery [J]. Earth System Science Data,
2021, 13(6): 2753?C2776.
[6]
Friedl, M. A., McIver, D. K.,
Hodges, J. C., et al. Global land cover mapping from MODIS: algorithms
and early results [J]. Remote sensing of Environment, 2002, 83(1/2),
287?C302.
[7]
Gao, H., Tang, S. H., Han, X.
Z. China??s Fengyun (FY) meteorological satellites, development and applications
[J]. Science &
Technology Review, 2021, 39(15): 9?C22.
[8]
Zhang, L., Zhou, G., Ren, H., et
al. 250 m raster dataset of vegetation classification in the Xizang
Autonomous Region based on FY-3D NDVI (2020) [J/DB/OL]. Digital Journal of
Global Change Data Repository, 2024.
https://doi.org/10.3974/geodb.2024.04.07.V1. https://cstr.escience.org.cn/CSTR:20146.
11.2024.04.07.V1.
[9]
GCdataPR Editorial Office.
GCdataPR Data Sharing Policy [OL]. https://doi.org/10.3974/dp.policy.2014.05
(Updated 2017).
[10]
Zhou, G. S., Ren, H. R., Liu,
T., et al. A new regional vegetation mapping method based on terrain-
climate-remote sensing and its application on the Qinghai-Xizang Plateau [J]. Science
China Earth Sciences, 2023, 53(2): 227?C235.
[11]
Zhou, G. S., Ren, H. R., Liu,
T., et al. Vegetation map of Qinghai Tibet Plateau in 2020 with 10 m
spatial resolution [DB/OL]. National
Tibetan Plateau / Third Pole Environment Data Center, 2022.
[12]
Editorial Board of the
Vegetation Map of China, Chinese Academy of Sciences. Vegetation and Its
Geographical Pattern in China-description of Vegetation Map of the People??s
Republic of China [M]. Beijing: Geology Publishing House, 2007.
[13]
Rabus, B., Eineder, M., Roth,
A., et al. The shuttle radar topography mission??a new class of digital
elevation models acquired by spaceborne radar [J]. ISPRS Journal of Photogrammetry
and Remote Sensing, 2003, 57(4): 241?C262.
[14]
Peng, S. Z. 1-km monthly mean
temperature dataset for China (1901?C2022) [DB/OL]. National Tibetan Plateau / Third Pole
Environment Data Center, 2019.
[15]
Peng, S. Z. 1-km monthly
precipitation dataset for China (1901?C2022) [DB/OL]. National Tibetan Plateau / Third Pole
Environment Data Center, 2020.
[16]
Johansen, K., Phinn, S.,
Taylor, M. Mapping woody vegetation clearing in Queensland, Australia from
Landsat imagery using the Google Earth Engine [J]. Remote Sensing
Applications: Society and
Environment, 2015, 1: 36?C49.
[17]
Biau, G. Analysis of a random
forests model [J]. The Journal of Machine Learning Research, 2012, 13:
1063?C1095.