Standardized Anomaly Dataset of Global Marine Net Primary
Productivity (1998–2019)
Sun, Y. Q.1, 2 Xue, C. J.2, 3* Hong, Y. L.4 Xu, Y. F.2,5 Liu, J. Y.2,6
1. China
University of Geosciences, Beijing 100083, China;
2.
China Aerospace Information Research Institute Chinese Academy of Sciences, Beijing
100094, China;
3.
China Key Laboratory of Digital Earth Science, Aerospace Information Research
Institute, Chinese Academy of Sciences, Beijing 100094, China;
4. China Multidisciplinary
Digital Publishing Institute, Beijing 101100, China;
5. China
University of Petroleum, Qingdao 266580, China;
6. China CETC
Key Laboratory of Aerospace Information Applications, Shi Jiazhuang 050081,
China
Abstract: Marine net primary production (MNPP) is an important parameter in
marine ecosystems and is an indicator that measures the photosynthesis capacity
of marine phytoplankton. The temporal and spatial characteristics of its
abnormal change patterns are related to global climate change, the carbon
cycle, and the global ecological environment, which have close ties. This article
uses the SeaWiFS.R2014 version from January 1998 to December 2002 and the
MODIS. R2018 version from January 2003 to December 2019
as provided by the Ocean Productivity website of Oregon State University as the
original data. The spatiotemporal statistical analysis methods have developed a
global ocean primary productivity standardized anomaly dataset on three time
scales from 1998 to 2019: yearly, quarterly, and monthly. The dataset has a
spatial resolution of 9 km ?? 9 km and a temporal resolution of 9 km ?? 9 km. For
the month category, the data format is HDF4 with a volume of 16.82 GB (4.81 GB
after compression). This paper uses the multiple El Niño-Southern Oscillation
(ENSO) index (MEI) to initially analyze the coupling relationship between the
abnormal change pattern of the marine primary productivity and the ENSO event.
The results show that the evolutions of the abnormal
change pattern of marine primary productivity and the occurrence and disappearance
of ENSO events are closely related, which proves the feasibility and validity
of the global ocean primary productivity standardized anomaly dataset.
Keywords: Marine primary productivity; abnormal change; monthly mean
anomaly; seasonal mean anomaly; annual mean anomaly
DOI: https://doi.org/10.3974/geodp.2021.02.08
CSTR: https://cstr.escience.org.cn/CSTR:20146.14.2021.02.08
Dataset Availability Statement:
The
dataset supporting this paper was published and is accessible through the Digital Journal of Global Change Data Repository
at: https://doi.org/10.3974/geodb.2020. 2020.07.13.V1 or
https://cstr.escience.org.cn/CSTR:20146.11.2020.07.13.V1.
1 Introduction
The
marine net primary production (MNPP) is the photosynthesis capacity of marine
phytoplankton per unit area[1]. This is an important
parameter in marine ecosystems as it helps to understand the global carbon
cycle, fishery production capacity, etc.[2]. The application of satellite remote sensing technology provides new
possibilities to study MNPP. Satellite remote sensing has the characteristics
of a large coverage area and long observation time series, making it an
indispensable tool to measure and research marine phytoplankton abundance at
large time and space scales. The MNPP has abnormal changes in time and space in
the average state of a long time series at a certain time, which can occur at
the monthly, seasonal, annual, etc. scales[3]. Abnormal changes in the MNPP and the associated relationship with marine
environmental elements have different temporal and spatial distribution
characteristics[4]. The abnormal change patterns
of MNPP and the correlation patterns with marine environmental elements provide
a basis to clarify the primary influencing factors on the temporal and spatial
distributions of phytoplankton, while at the same time providing a basis to
study how climate change affects the marine food web[5]. In addition, abnormal changes in the MNPP are also closely related to El
Niño-Southern Oscillation (ENSO) events[6]. For example, Bastos et al.
found that there is a strong anti-correlation between the ENSO and MNPP, which
is driven primarily by ecosystems in tropical and subtropical latitudes[7]. Chavez et al. found that during
the occurrence of ENSO, MNPP increased significantly in tropical regions due to
the influences of upwelling and nutrient supply[8]. Therefore, it is significant to research abnormal changes in the MNPP[9]. Although there are a variety of MNPP datasets based on satellite remote
sensing, such as GlobalMarineABMP_NPP[10], Chlorophyll-a Concen of Poyang Lake, China[11], and MuSyQ-NPP-1km-2013[12], there are no relevant
reports on spatiotemporal datasets.
This
paper is based on the existing monthly average MNPP dataset (1998.01–2019.12) using
geographic temporal and spatial statistical analysis methods. This work
considers the temporal and spatial characteristics of marine primary productivity
and designs the production method for the MNPP abnormal change dataset to remove
seasonal variations. Thus, standardized anomaly datasets of marine primary
productivity on annual, seasonal, and monthly time scales are generated (MNPP
monthly anomaly datasets, MNPP-MAD; MNPP seasonal anomaly datasets, MNPP-SAD;
MNPP annual anomaly datasets, MNPP-AAD). This dataset provides a basis for
global climate change research.
2 Metadata of the Dataset
The metadata of the Standardized anomaly dataset of global
marine net primary productivity (1998–2019)[13] is summarized in Table 1. It includes the dataset full
name, short name, authors, year of the dataset, temporal resolution, spatial
resolution, data format, data size, data files, data publisher, and data
sharing policy, etc.
3 Data Development Method
3.1 Data Sources
The NPP data in this article from January 1998 to
December 2002 are derived from the data of Sea-Viewing Wide Field-of-View
Sensor (SeaWiFS) satellite platform R2014 based on the SeaWiFS CHL, AVHRR SST,
and SeaWiFS photosynthetic radiation (PAR) data. The data are calculated using
the vertical generalized production model (VGPM) algorithm[15]. The
NPP data from January 2003 to December 2019 are derived from the Moderate Resolution
Imaging Spectroradiometer (MODIS) sensor on the Aqua satellite platform, and
the data version is R2018. This dataset is based on MODIS CHL, MODIS SST, and
MODIS PAR. The data were calculated using the VGPM model algorithm, and the NPP
data for the two
Table 1 Metadata
summary of Standardized anomaly dataset of global marine net primary productivity
(1998–2019)
|
Item
|
Description
|
|
Dataset name
|
Standardized
anomaly dataset of global marine net primary productivity (1998–2019)
|
|
Dataset short name
|
Global_MNPP_Anomaly_1998-2019
|
|
Authors
|
Sun, Y. Q., China
University of Geosciences, Beijing, Aerospace Information Research Institute,
Chinese Academy of Sciences, syqsdkd@126.com
Xue, C. J. 0000-0003-3605-6578, Aerospace
Information Research Institute, Chinese Academy of Sciences, Key Laboratory
of Digital Earth Science, Aerospace Information Research Institute, Chinese
Academy of Sciences, xuecj@aircas.ac.cn
Hong, Y. L.,
Multidisciplinary Digital Publishing Institute, Beijing, 515251357@qq.com
Xu ,Y. F., China
University of Petroleum??Qingdao, Aerospace Information Research Institute,
Chinese Academy of Sciences, xuyf187627@163.com
Liu, J. Y., CETC
Key Laboratory of Aerospace Information Applications, liujy@aircas.ac.cn
|
|
Geographical
region
|
Global waters
Year From January 1998 to December 2019
|
|
Temporal
resolution
|
Month, season, year
|
|
Spatial
resolution
|
9 km ?? 9 km Data
format HDF4
|
|
Data size
|
16.82 GB (After compression 4.81 GB)
|
|
Data files
|
The dataset
consists of six sub-datasets, which are described as follows:
(1) Original
dataset of the global ocean primary productivity year
(2) Seasonal raw
datasets of the global ocean primary productivity
(3) Monthly raw
dataset of the global ocean primary productivity
(4) Monthly
standardized dataset of the global ocean primary productivity
(5) Dataset for
seasonally standardized anomalies of the global marine primary productivity
(6) Global Ocean
Primary Productivity Annual Standardized Anomaly Dataset
|
|
Foundations
|
Strategic Type A
Pilot Special Project of the Chinese Academy of Sciences (XDA19060103); National
Key R&D Program Project (2017YFB0503605); and National Natural Science
Foundation of China (41671401)
|
|
Data
publisher
|
Global Change Research Data Publishing &Repository http://www.geodoi.ac.cn
|
|
Address
|
No. 11, Datun
Road, Chaoyang District, Beijing 100101
|
|
Data sharing policy
|
Data from
the Global Change Research Data Publishing & Repository includes metadata, datasets
(in the Digital Journal of Global Change Data Repository), and
publications (in the Journal of Global Change Data & Discovery). Data sharing policy
includes: (1) Data are openly available and can be free downloaded via the
Internet; (2) End users are encouraged to use Data subject to citation;
(3) Users, who are by definition also value-added service providers, are welcome
to redistribute Data subject to written permission from the GCdataPR
Editorial Office and the issuance of a Data redistribution license; and
(4) If Data are used to compile new datasets, the ??ten per cent
principal?? should be followed such that Data records utilized should not
surpass 10% of the new dataset contents, while sources should be clearly
noted in suitable places in the new dataset[14]
|
|
Communication and searchable system
|
DOI, CSTR, Crossref, DCI, CSCD,
CNKI, SciEngine, WDS/ISC, GEOSS
|
periods were provided by the
Oregon State University Ocean Productivity Website (http:// www.science.oregonstate.edu/ocean.productivity)[6].
The data time resolution is monthly, the spatial resolution is 9 km ?? 9 km, and
the global grid number is 2160??4320.
3.2 Algorithm Flow
For the data obtained by the
two sensors, SeaWiFS and MODIS, Couto et
al. conducted correlation and standard deviation analyses. The results show
that the two datasets can be combined and the results are not affected by
sensor conversion[16]. Therefore, this paper uses the MNPP dataset from the
two sensors as the original input data. First, the original data was spatially
converted, and the longitude range of the original data was converted from
–180??–180?? to 0??–360?? and was processed using time interpolation and time
aggregation algorithms to obtain the original data for the seasonal and annual
scales. The time interpolation algorithm fills in bad data by taking invalid
grid values at a certain time and filling them in with the average of those at
the same location at adjacent times (previous and next). The time aggregation
algorithm, taking spring as an example, averages the data for March, April, and
May to generate the corresponding seasonal scale data. For annual scale data,
the data from January to December of each year are averaged. As marine primary
productivity has strong seasonal changes (shown in Figure 3), which is driven
primarily by solar radiation, it conceals abnormal change patterns of the
marine primary productivity. Thus, we study the abnormal changes in the MNPP
data collection to eliminate these seasonal patterns. This paper adopts the
standardized anomaly method called the Z-score to eliminate seasonal variation
patterns in the marine primary productivity[17]. For any month
from January to December, we obtain the value each year to form a time series
and calculate its average and standard deviation. The mean and standard
deviation are used to discretize the average monthly value over all years, as
shown in equation (1)[18].
 ??j=1,2,????.,12??
(1)
??j=1,2,????.,12??
(1)
where i
is the year, j is the month,  and
and  are the mean and standard
deviation, respectively, and
are the mean and standard
deviation, respectively, and  and
and  are the original and converted
values of the long-term image series.
are the original and converted
values of the long-term image series.
To verify the applicability of the MNPPAD dataset,
this paper selects a typical MNPP cluster evolution model and analyzes its
relationship with ENSO events, which indirectly proves the scientific nature of
the dataset. The algorithm flow of the MNPPAD dataset is shown in Figure 1.
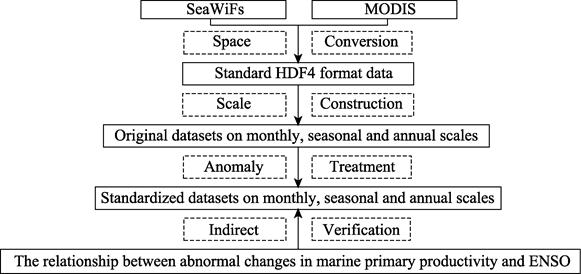
Figure 1 Technology roadmap
4 Data Result
4.1 Dataset Composition
The global ocean primary
productivity dataset (1998–2019) includes raw and result data. The data format
is HDF4, and its data structure is customized, as shown in Figure 2. The data
description module description is shown in Table 1, and the data elements and
attributes are described in Table 2.
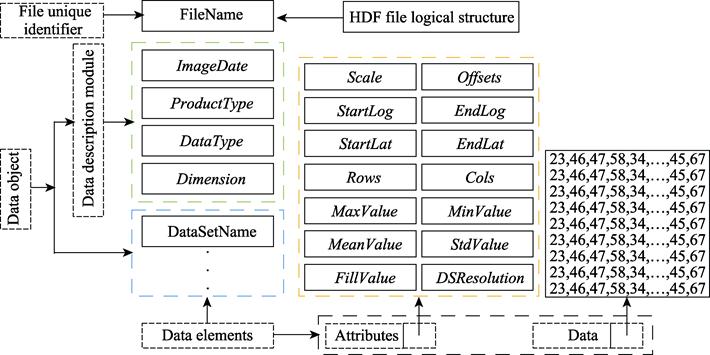
Figure 2 HDF4 data structure diagram
Table 1 HDF4 data description module table
|
Name
|
Definition
|
Comment
|
|
ImageDate
|
DFNT_CHAR8
|
Time of remote sensing image
|
|
ProductType
|
DFNT_CHAR8
|
Product type:the default is Product
|
|
DataType
|
DFNT_CHAR8
|
Data type:default is 0
|
|
Dimension
|
DFNT_CHAR8
|
Data dimension: the default is two-dimensional
|
Table 2 HDF4 data element and attribute
description table
|
Name
|
Definition
|
Comment
|
|
DataSetName
|
DFNT_INT32
|
Dataset name
|
|
Scale
|
DFNT_FLOAT64
|
Scale factor: default is 0.001
|
|
Offsets
|
DFNT_FLOAT64
|
Scale intercept: default is 0
|
|
StartLog
|
DFNT_FLOAT64
|
Remote sensing image starting longitude
|
|
EndLog
|
DFNT_FLOAT64
|
Remote sensing image termination longitude
|
|
StartLat
|
DFNT_FLOAT64
|
Starting Latitude of remote sensing image
|
|
EndLat
|
DFNT_FLOAT64
|
Remote sensing image termination latitude
|
|
Rows
|
DFNT_UINT16
|
Number of rows of remote sensing image
|
|
Cols
|
DFNT_UINT16
|
Number of remote sensing images
|
|
MaxValue
|
DFNT_FLOAT64
|
Remote sensing image pixel maximum
|
|
MinValue
|
DFNT_FLOAT64
|
Remote sensing image pixel minimum
|
|
MeanValue
|
DFNT_FLOAT64
|
Remote sensing image pixel value average
|
|
StdValue
|
DFNT_FLOAT64
|
Standard deviation of remote sensing image pixel value
|
|
FillValue
|
DFNT_INT32
|
Filling value of remote sensing image: default is –9999
|
|
DSResolution
|
DFNT_FLOAT64
|
Remote sensing image spatial resolution
|
4.2 Data
Preprocessing
Figure 3 compares the time
series of the original marine primary productivity data and the anomalous data
in global oceans from January 1998 to December 2019. The analysis of Figure 3
indicates that the standardized anomaly processing after removing the seasonal
component of the original data better shows the volatility of the marine
primary productivity in the time series. After the standardized anomaly
processing, the spatial distribution map of the monthly average anomaly in the
MNPP from Figure 4(b) shows the abnormally increased and decreased areas.
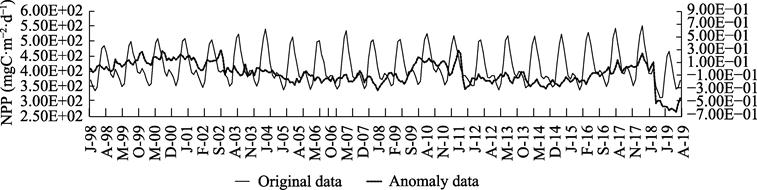
Figure 3 Comparison of the time series between the
original marine primary productivity data and the anomaly data (January
1998–December 2019)

(a)
Spatial distribution of MNPP (b)
Spatial distribution of standardized monthly mean
anomalies
of MNPP
Figure 4 Original MNPP data and monthly average
standardized anomaly data in January 1998
4.3 Data
Result
The data result include: (1) global ocean primary
productivity annual standardized anomaly Dataset (see Figure 5 for an example);
(2) global ocean primary productivity seasonal standardized anomaly dataset
(see Figure 6 for an example); and (3) global ocean primary productivity annual
standardized anomaly dataset (see Figure 6 for an example) (4) monthly
standardized anomaly dataset for productivity (see Figure 7 for an example).

Figure 5 Annual average anomaly map of global
marine primary productivity (1998–2019)

Figure
6 Data map of seasonal average
anomalies for the global marine primary productivity (1998–2019)

Figure 7 Data map of
monthly average anomalies for the global marine primary productivity (1998–2019)
4.4 Dataset
Suitability Verification
This paper uses the coupling
relationship between the MEI and the abnormal change pattern of the marine
primary productivity to indirectly verify the applicability of the MNPPAD dataset.
The double-constrained clustering method developed by the subject[19] is
used to extract the temporal and spatial cluster patterns of the primary productivity
anomalies in the Pacific Ocean to analyze the El Niño event from January 1998
to July 1998 and the La Niña from December 1998 to August 1999. During the La
Niña event, the El Niño event from August 2006 to February 2007, and the La
Niña event from June 2010 to March 2011, the temporal and spatial cluster
patterns of the ocean primary productivity anomalies in the Indian Ocean,
equatorial Pacific, and Atlantic regions were mainly. The results are shown in
Figures 8–15.
Figure 8 shows the spatial variations
of the spatial and temporal clusters for the abnormally low marine primary
productivity in the western Indian Ocean from January 1998 to July 1998. Over
time, the position of the spatiotemporal cluster remained nearly unchanged, and
the coverage area gradually decreased until disappearing. Figure 9 shows the
correlation diagram between the area of the spatiotemporal cluster and MEI. It
is seen that during El Niño, the spatiotemporal evolution cluster has a
response relationship with the MEI index, and the correlation coefficient
reaches 0.97.
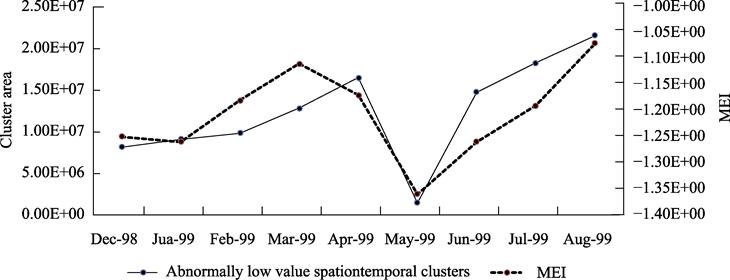
Figure 10 shows the spatial variations of the spatial and temporal clusters
of the abnormally high ocean primary productivity in the central and eastern
equatorial Pacific from December 1998 to August 1999. Over time, the temporal
and spatial anomalous high-value
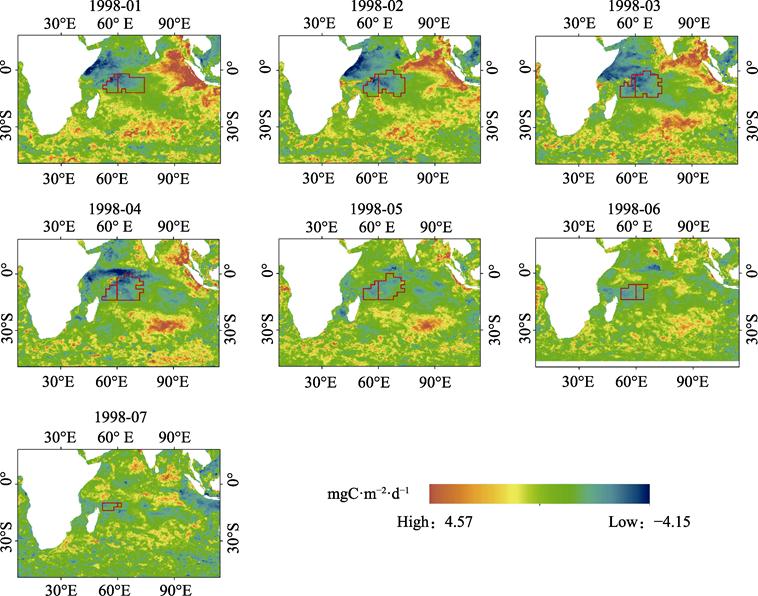
Figure 8 Spatial movement of anomalous low-value
spatiotemporal clusters in the western Indian Ocean
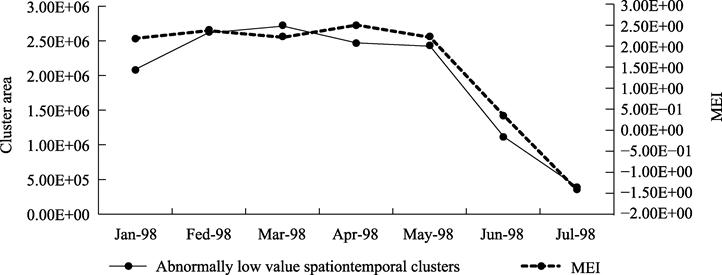
Figure 9 Correlation between the area of the
spatiotemporal clusters and the MEI
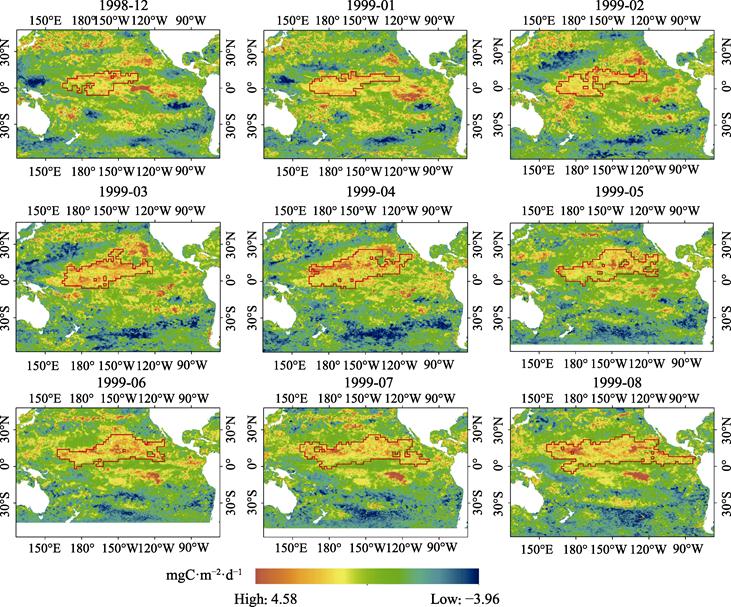
Figure 10 Spatial
movement of anomalous
high-value spatiotemporal clusters in the equatorial Central and Eastern
Pacific
clusters gradually moved east,
and the coverage area gradually increased. Figure 11 shows the correlation
diagram between the spatiotemporal evolution cluster area and the MEI. It is
seen that during La Niña, the spatiotemporal evolution cluster has a response
relationship with the MEI index, and the correlation coefficient reaches 0.79.
Figure 12 shows the spatial variation in
the spatial and temporal clusters of the abnormally low marine primary
productivity in the central and southern equatorial Pacific Ocean from June
2006 to February 2007. Over time, the temporal and spatial anomalous low-value
clusters gradually moved southeast, and the coverage area gradually became
larger. Since January 2007, the area gradually became smaller and disappeared.
Figure 13 shows the correlation diagram between the area of the spatiotemporal
evolution cluster and the MEI. It is seen that during El Niño, the spatiotemporal
evolution cluster has a response relationship with the MEI index, and the
correlation coefficient reached 0.75.
Figure 14 shows the spatial variations of the
spatial and temporal clusters of the abnormally low marine primary productivity
in the central Atlantic Ocean from June 2010 to March 2011.
Figure
11 Correlation between the areas of the
spatiotemporal clusters and MEI

Figure 12 Spatial
movement of the spatiotemporal clusters of the abnormally low values in the
equatorial
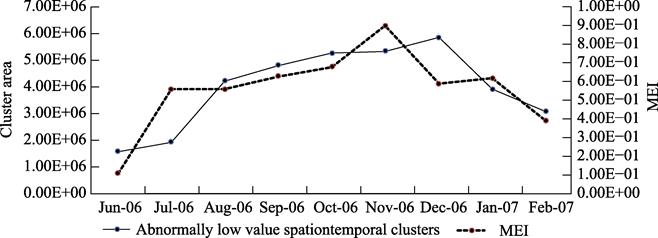
Figure 13 Correlation between the area of
the spatiotemporal clusters and the MEI

Figure 14 Spatial movement of the abnormally
low-value spatiotemporal clusters in the central Atlantic Ocean
Over time, there
is nearly no change in the location of the spatiotemporal abnormally low-value
cluster, and the coverage area gradually became smaller. However, in November
2010, the area began to gradually increase and disappear. Figure 15 shows the
correlation diagram between the area of the spatiotemporal evolution cluster
and the MEI. It is seen that during El Niño, the spatiotemporal evolution
cluster has a response relationship with the MEI index, and the correlation
coefficient reached 0.63.
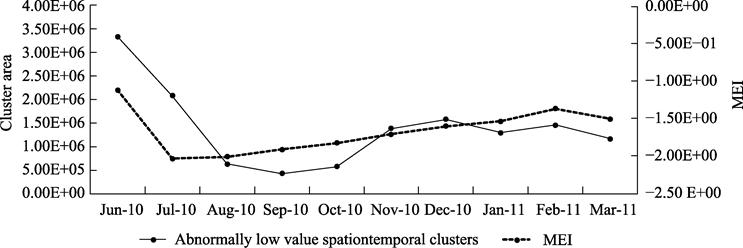
Figure 15 Correlation between the area of the
spatiotemporal clusters and the MEI
5 Discussion and Summary
Based
on the original datasets of the SeaWiFS and MODIS ocean primary productivity,
this paper uses geographic spatiotemporal statistical methods to produce a
dataset of standardized anomalies in marine primary productivity on three time
scales from 1998 to 2019 with a data size of 16.82 GB. (4.81 GB in
compression). The applicability of the MNPPAD dataset was verified using the
coupling relationship between the abnormal change patterns of the marine
primary productivity and ENSO events. In global seas, there is a strong correlation
between the abnormal evolution clusters of the marine primary productivity and
the MEI characterization. The results show that the abnormal change pattern of
marine primary productivity is closely related to ENSO events, which provides
an important data basis for global climate change research but is also
necessary to increase the sample size to explore the relationship between
abnormal change patterns of marine primary productivity and ENSO events. This
is also the focus and direction of future research.
Author Contributions
Xue, C. J. and Hong, Y. L., made an overall design
for the development of the dataset; Sun, Y. Q., and Xu, Y. F. collected and
processed the raw data of marine primary productivity; Liu, J. Y. designed a
method for mining anomalous changes in the spatio-temporal clusters of ocean;
Hong, Y. L. and Sun, Y. Q. made data verification; Sun, Y. Q. wrote data paper.
Conflicts of Interest
The authors declare no conflicts of interest.
References
[1]
Guosheng, L., Fang, W., Qiang,
L., Jilong, L. Remote sensing inversion of primary productivity in the East
China Sea and its spatiotemporal evolution mechanism [J]. Acta Geographica Sinica, 2003(4): 483–493.
[2]
Peizhong, W. Satellite
detection of marine primary productivity [J]. Remote sensing of land and resources, 2000(3): 7–15.
[3]
Liu, J. Y., Xue, C. J., Fan, Y.
G., et al. A grid-oriented
space-attribute dual constrained clustering method [J]. Journal of Geo-Information Science, 2016, 19(4): 447–456. DOI:10.3724/SP.J.1047.2017.0447.
[4]
Sun, Q., Xue, C. J., Liu, J.
Y., et al. Mining and analysis of
temporal and spatial correlation patterns between global marine primary
productivity and marine environmental factors [J]. Marine Environmental Science, 2020, 39(3): 340–352. DOI:
10.13634/j.cnki.mes.2020.03.003.
[5]
Behrenfeld, M. J., O??Malley, R.
T., Siegel, D. A., et al.
Climate-driven trends in contemporary ocean productivity [J]. Nature,
2006, 444: 752‒755.
[6]
Behrenfeld, M., Falkowski, P. A
consumer??s guide to phytoplankton primary productivity models [J]. Limnology
& Oceanography,
1997, 42(7): 1479‒1491.
[7]
Bastos, A., Steven, W.,
Gouveia, C., et al. The global NPP
dependence on ENSO: La Niña and the extraordinary year of 2011 [J]. Journal
of Geophysical Research:
Biogeosciences, 2013(118): 1247‒1255. DOI: 10.1002/jgrg.20100.
[8]
Chavez, F. P., Messie, M.,
Pennington, J. T. Marine primary production in relation to climate variability
and change [J]. Annual
Review of Marine Science, 2011, 3: 227‒260.
[9]
Messi??, M., Chavez, F. A global
analysis of ENSO synchrony: the oceans?? biological response to physical forcing
[J]. Journal of Geophysical Research
Oceans, 2012, 117: C09001.
[10]
Tal, Z., Zhou, X., Ma, S.
Global ocean primary productivity remote sensing monitoring 9-km resolution
monthly dataset based on ABPM model (2003–2012) [J/DB/OL]. Digital Journal of Global Change Data Repository, 2014. https://doi.org/10.3974/geodb.2014.02.03.V1.
[11] Wang, J. L., Zhang, Y. J., Yang, F., et al. Chlorophyll a concentration dataset of Poyang Lake (2009–2012)
[J/DB/OL]. Digital Journal of Global
Change Data Repository, 2014. https://doi.org/10.3974/geodb.
2014.02.08.V1.
[12] Gao, S., Liu, W. H., Kang, J., et al. The 1-km resolution vegetation
net primary productivity dataset for China and ASEAN in 2013 [J/DB/OL]. Digital Journal of Global Change Data
Repository, 2015.
https://doi.org/10.3974/geodb.2015.01.15.V1.
[13] Sun, Y. Q., Xue, C. J., Hong, Y. L., et al. Standardized anomaly dataset of global marine net primary
productivity (1998–2019)
[J/DB/OL]. Digital Journal of Global
Change Data Repository, 2020. https://doi.org/10.3974/geodb.2020.07.13.V1.
https://cstr.escience.org.cn/CSTR:20146.11.2020.07.13.V1.
[14]
GCdataPR
Editorial Office. GCdataPR data sharing policy [OL]. https://doi.org/10.3974/dp.policy.2014.05 (Updated 2017).
[15]
Behrenfeld, M. J., Falkowski, P.
G. Photosynthetic rates derived from satellite-based chlorophyll concentration
[J]. Limnology and Oceanography,
1997, 42(1): 1–20.
[16]
Couto, A., Holbrook, N.,
Maharaj, M. Unravelling eastern Pacific and central Pacific ENSO contributions
in south Pacific chlorophyll-a variability through remote sensing [J]. Remote
Sensing, 2013, 5(8): 4067‒4087.
[17]
Zhang, P., Steinbach, M.,
Kumar, V., et al. Discovery of Patterns
of Earth Science Data Using Data Mining [M]. In New Generation of Data Mining Applications (Zurada, J., Kantardzic, M., eds), New
Jersey: John Wiley & Sons Inc., 2005.
[18]
Xue, C., Song, W., Qin, L., et al. A spatiotemporal mining framework
for abnormal association patterns in marine environments with a time series of
remote sensing images [J]. International Journal of Applied Earth
Observation and Geoinformation, 2015, 38: 105‒114.
[19]
Liu, J., Xue, C., He, Y., et al. Dual-constraint spatiotemporal
clustering approach for exploring marine anomaly patterns using remote sensing
products [J]. IEEE J-STARS, 2018, 11(11): 3963‒3976.