Spectral Monitoring Online
System for Water Quality Assessment Based on Satellite?CGround Data Integration
Zhang, L. F.1,2* Zhang,
L. S.1,3 Sun, X. J.1 Chen, J.1,3 Wang, S.1,3 Zhang, H. M.1 Tong, Q. X.1
1. State Key Laboratory of Remote Sensing Science, Aerospace
Information Research Institute, Chinese Academy of Sciences, Beijing 100101, China;
2. Key Laboratory of Oasis Eco-agriculture, Xinjiang Production
and Construction Corps, Shihezi University, Shihezi 832003, China;
3. University of Chinese Academy of Sciences, Beijing 100049, China
Abstract: With urbanization and economic growth, water pollution has become
a key factor that restricts the sustainable development of
cities. Traditional water quality monitoring methods are time-consuming and can
easily cause secondary pollution. Online water quality monitoring can automatically
and rapidly display water quality in place and in real time, and satellite data
can provide sources for large-scale and long-term water quality monitoring assessments.
Based on the demand for real-time online monitoring of inland water in China,
this study combined a water quality spectral monitoring online system with
multisource remote sensing data to research and assess the application of a satellite?Cground
integrated water quality monitoring system and improve the accuracy and stability
of water quality parameter inversion over a long duration and on a large scale
by data cross-validation with real-time ground monitoring data.
Keywords: satellite?Cground data integration; water quality; hyperspectral;
online assessment
1 Introduction
Water
quality is directly related to human life. With urbanization and rapid economic
growth, the demand for water resources in China is increasing, but the water
environment is deteriorating in some areas[1].
Water pollution has become a key factor restricting the sustainable development
of cities[2]. The China government
proposed adherence to the basic national policy of environmental protection,
and thus high-tech methods must be used to carry out research regarding water
pollution of lakes and rivers to rapidly and comprehensively perceive the water
environment and water pollution status[3].
The traditional
method for water quality monitoring involves collection of water samples
on-site and transport to the laboratory for analysis using appropriate instruments,
or the construction of a fixed monitoring station[4]. Although traditional
methods have great accuracy, there are several problems. First, the cost
is high. Manpower and material resources are required for field sampling and
transportation to the laboratory, the construction and maintenance costs of
fixed stations are high, and chemical reagents must be consumed. Second,
secondary pollution can be problematic. Traditional water quality monitoring is
based on chemical methods that produce considerable waste during the detection
process, which is difficult to manage. Third, monitoring limitations exist.
Traditional water quality monitoring involves ex situ detection. Water quality
can only be monitored at a specific time and at limited sampling points;
therefore, it is difficult to acquire data regarding the temporal and spatial
distributions and changes in water quality for a large range of waters.
Spectral online
monitoring of water quality can obtain water quality parameter information
rapidly, continuously, without pollution, and in real time, thereby avoiding
the shortcomings of traditional water quality monitoring. However, it is
difficult to perform rapid and efficient monitoring of water quality in large
areas because of spatial uncertainty. Satellite remote sensing compensates for
the lack of point monitoring through its advantages of wide-range, high-speed,
long-term, and dynamic monitoring[5], thus providing a new method
for large-scale and long-term water quality monitoring[6].
Therefore, a new approach for dynamic monitoring of the spatiotemporal inland
water quality in China involves the combination of satellite remote sensing
with a ground-spectra online monitoring system. The key aspect of this research involves establishment of a method for
coordinating observations between the spectral monitoring system and the
satellite data. To satisfy the demand for inland water quality monitoring in
China, this paper proposes a water quality spectral monitoring method based on
satellite data, aviation data, and ground data, as well as the project and key technologies of a satellite?Cground integrated
water quality spectral monitoring online system.
2 Spectral Monitoring of Water
Quality
The
current data sources of water quality monitoring include mainly satellite data,
aviation data, and ground data. Satellite data include multispectral and
hyperspectral data, aviation data include mainly manned aircraft and unmanned
aerial vehicle data, and ground data are obtained mainly by field portable
spectrometers.
2.1 Satellite Data
Multispectral
satellite data, such as TM, ETM+, and OLI data in the United States, HRVR data
in France, and GF series data in China, were used in the early stages of water quality
monitoring, and the TM data were most widely used[7]. Multispectral
remote sensing has the advantage of rich data, but its spectral range is
concentrated mainly in the visible to near-infrared bands. Moreover, the
spectral resolution is usually 20?C70 nm and only 4?C8 bands can be analyzed;
therefore, it is difficult to capture the small spectral characteristics of
water. Hyperspectral satellites provide a new data source for inland water
quality monitoring because of their rich spectral resolution. For example, GF-5[8]
and OHS[9] have been used
widely in water quality monitoring.
During the
inversion of water quality parameters from satellite data, there is generally a
requirement for radiometric correction, atmospheric correction, geometric
correction, and filtering to obtain remote sensing images of the study area
with suitable quality. An empirical model or a semi-empirical model is
established and combined with the measured water quality parameters. Because
the band combination is usually determined by enumeration comparison, the
inversion results of the model are typically unstable and lack sufficient robustness[10].
The process of retrieving water quality parameters from satellite data
is illustrated in Figure 1.
|
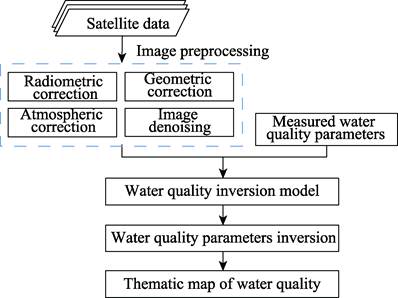
Figure 1 Flow chart of water quality parameter
inversion based on satellite remote sensing data
|
2.2 Aviation Data
Due
to the influences of return period, spatial resolution, and weather, the
acquisition and post-processing of satellite data are difficult, especially for
areas with frequent rain. However, the miniaturization of hyperspectral
hardware has permitted the application of hyperspectral remote sensing data
based on platforms on manned aircraft and unmanned aerial vehicles in the field
of water quality monitoring[11].
In contrast to satellite remote sensing, aerial remote sensing allows the selection
of flight time and route as necessary for specific tasks. Because the aerial remote
sensing flight altitude is much lower than satellite altitude, aerial remote
sensing can obtain higher spatial resolution image data, which can better
reflect the spectral and spatial information of water and thus improve the
accuracy of water quality monitoring. At present, the main manned aircraft
hyperspectral systems include HyMAP-C in Australia, the Prob series in the
United States, CASI/SASI/TASI in Canada, AISA+ in Finland, and PHI in China.
Hyperspectral equipment based on the unmanned aerial vehicle platform includes
mainly OCI in the United States, SPECIM in Finland, HySpex in Norway, and small
hyperspectral imaging systems developed by CIOMP, SITP, and AIR of the Chinese
Academy of Sciences.
In 2017, the
author??s team completed aerial hyperspectral remote sensing monitoring of water
quality (Figure 2) in Baiyang Lake, Xiongan New Area, Hebei Province[12],
using the Yun-5 fixed wing flight platform carrying a self-developed,
full-spectra, and multimode imaging spectrometer. In 2018, the author??s team
used a six-rotor unmanned aerial vehicle platform carrying a small push-broom
hyperspectral spectrometer to obtain hyperspectral images of the Maozhou River
in Shenzhen, completed the water quality parameter inversion in accordance with
the established model based on the chemical values of water parameters, and
finally produced a water quality thematic map of the entire area (Figure 3).
In contrast to satellite data, the coverage
of aerial data is limited, and both geometric correction and mosaic
preprocessing are needed. Both geometric and spectral consistencies of the
image should be considered to avoid capturing the same object using different
spectra.
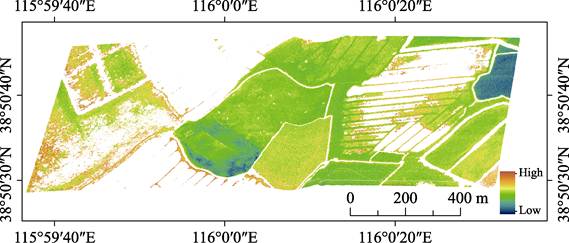
Figure 2 Thematic map of suspended matter
inversion of Baiyang Lake
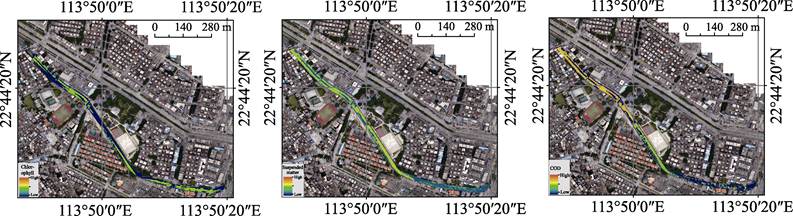
Figure 3 Thematic map of water quality inversion of
Maozhou River
The process of
retrieving water quality parameters through aerial remote sensing data is shown
in Figure 4.
2.3 Ground Data
When
no satellite data are accessible, spectral data can be obtained flexibly by
field portable spectrometer at low cost. At present, the main manufacturers of
field spectrometers include Ocean Optics, ASD, and Avantes. The FieldSpec-4
field portable spectrometer by ASD and the
USB4000 and Torus-series microspectrometers by Ocean Optics are used
widely in China. Although a microspectrometer cannot compare with the
large-scale spectrometer in terms of resolution or spectral measurement range,
it has advantages with respect to
portability, intelligence, and integration; it can also display field data in
real time[13].
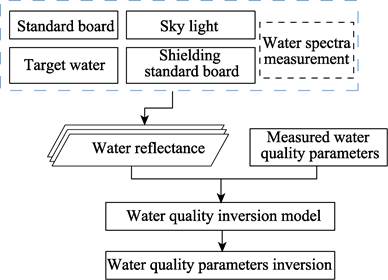
When using a field
spectrometer to obtain water spectra, water, sky light, and standard plate must
be measured, and the remote sensing reflectance of the water must be calculated
according to the formula. Hence, the surface reflectance of gas and water, direct
solar reflection of the capillary wave, and integration time affect the quality
of the data obtained, as well as the inversion accuracy of the water quality parameters[14]. The process of monitoring
water quality parameters by ground data is shown in Figure 5.
A spectral monitoring online system of water
quality can realize automatic, rapid, and in situ measurement in a stable
external environment without chemical reagents and secondary
|

|
|
|
Figure 4 Flow chart of water quality parameter
inversion based on aerial remote sensing data
|
Figure 5 Flow chart of water quality parameter
inversion based on ground data
|
pollution. It can meet the need for
real-time online water quality monitoring, a focus of current research. The
author??s team developed a portable, intelligent, water quality spectrometer, as
well as a fixed, intelligent, water quality spectrometer. The device can obtain
real-time water spectral data and realize in situ, rapid, real-time, and
pollution-free water quality monitoring based on the established multiparameter
inversion model. This approach produces high-quality inversion results in many cases.
2.3.1 Portable,
Intelligent, Water Quality Spectrometer
The
author??s team developed the innovative portable, hyperspectral, intelligent
water quality spectrometer in China, known as Water Color (Figure 6). The
system can rapidly detect water quality in the field using spectral analysis
technology. It consists of a portable, intelligent water quality spectrometer,
APP operation software (i.e., Water Color), and a water quality, big-data cloud
service platform[15].
Figure 6 Portable intelligent water quality
spectrometer
|
Table 1 Parameters of portable, intelligent, water quality spectrometer
|
|
Index
|
Parameters
|
|
Weight
|
<0.58
kg
|
|
Size
|
20
cm ?? 10 cm ?? 4 cm
|
|
Wavelength
|
350?C1,050
nm
|
|
Spectral
resolution
|
Better
than 5 nm, up to 3 nm
|
|
Number
of spectral channel
|
303
|
|
Connector
|
Bluetooth
|
|
Continuous
working hours
|
2
to 4 hours (single battery)
|
The device is connected with a smart phone
via Bluetooth, and spectra are collected by controlling the spectra acquisition
device. The spectral data are transmitted to the big-data cloud service platform
through a 4G/5G network, and the analysis results are displayed on the smart
phone terminal in real time. The device parameters are shown in Table 1.
The portable, intelligent, water quality
spectrometer has the advantages of small volume, all-weather capability, high
sensitivity, high resolution, low power consumption, and high cost performance.
The device can simultaneously detect more than 10 water quality parameters
(e.g., total phosphorus, dissolved oxygen, and ammonia nitrogen) with robust
expansibility. When compared with traditional water quality analysis in the
laboratory, the greatest technical breakthrough of the system is rapid,
real-time, and intelligent monitoring, which can meet the need for rapid,
real-time detection of water quality for environmental protection and water
departments, as well as other departments. Figure 7 shows the inversion results
of total phosphorus and total nitrogen in the city of Ningbo. The overall trend
of the predicted value is consistent with the trend of the actual value, and
the inversion accuracy is high.
2.3.2 Fixed, Intelligent, Water
Quality Spectrometer
The fixed,
intelligent, water quality spectrometer developed by the author??s team is a non-mobile,
fixed-point, water quality detection system that can be applied to rivers,
lakes, ponds, and other bodies of water. It consists of a HyScan
micro-intelligent spectrometer, fixed buoy, and water quality big-data cloud
service platform, as shown in Figure 8. The parameters are shown in Table 2.
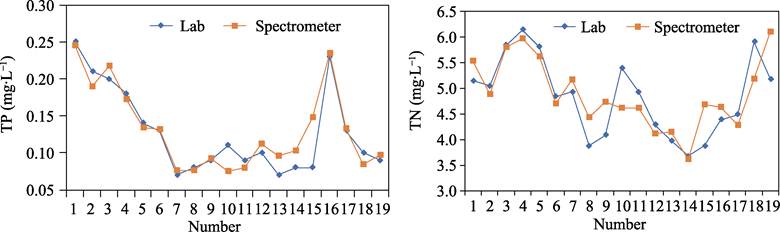
Figure 7 Accuracy comparison chart between the
inversion value from the portable, intelligent, water quality spectrometer and
the laboratory value
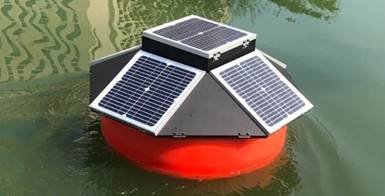
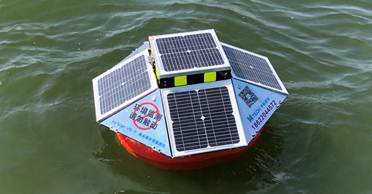
Figure 8 Fixed, intelligent, water quality spectrometer
|
Table 2 Parameters of fixed, intelligent, water quality spectrometer
|
Index
|
Parameters
|
|
Wavelength
|
400?C1,000 nm
|
|
Power supply
|
Micro USB/Solar/Rechargeable battery pack
|
|
Weight
|
20 kg
|
|
Size
|
??80 cm ?? 80 cm ?? 50 cm
|
|
Sampling frequency
|
Every 30 minutes, 10 groups of data each time
|
|
The fixed,
intelligent, water quality spectrometer can freely adjust the collection frequency
and time to collect spectra at intervals of ?? 5 s. It can automatically
retrieve water quality parameters and realize data transmission, cloud data
storage, data display, and statistical analysis in real time. Users can view
the results in real time through a terminal, such as a large screen, iPad, or
mobile phone. Figure 9 shows an accuracy analysis of the data measured at a
station. The predicted values of water quality parameters are consistent with
the real values, indicating that changes in water quality can be displayed
well.
3 Scheme
and Key Technologies of Satellite?CGround Integrated Water Quality
Spectra Online Monitoring
3.1 Satellite?CGround
Integrated Water Quality Spectral Monitoring Scheme
The establishment of a water quality
parameter inversion model in remote sensing depends heavily on observation
samples, which can cause instability of the inversion model. The
satellite?Cground integrated water quality spectra monitoring system can improve the
stability and accuracy of water quality parameter inversion to realize a wide
range of water quality monitoring and spatiotemporal analyses, thus providing a
new method for long-term water quality monitoring in China.
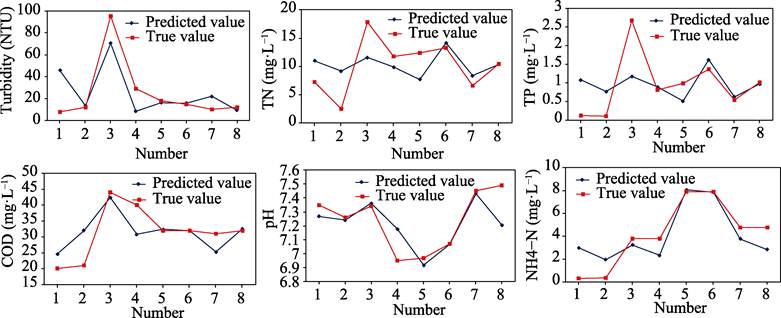
Figure 9 Accuracy analysis chart of data measured at
the test station
Figure 10 shows the overall scheme of the satellite?Cground integrated, water
quality spectra monitoring online system. The satellite data provide the basis
for selection of the optimal networking mode, sampling frequency, and
observation time. The ground system provides the water quality parameter and
measured spectral data. Then, the data are transmitted to the big-data cloud
platform. The water quality parameters are retrieved in real-time from the
water quality parameter samples, satellite remote sensing data, and inversion
model, then stored in the cloud platform. Finally, the real-time monitoring
results of the ground network and the water quality inversion products of the
satellite data are displayed on the terminal.
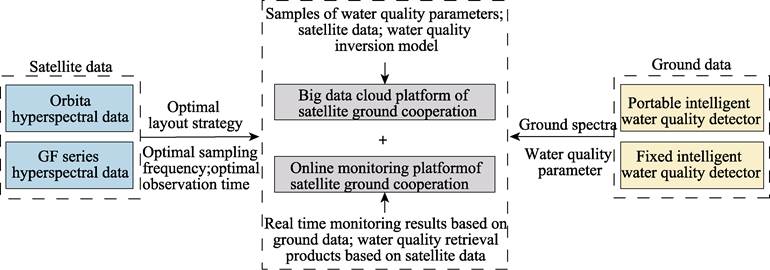
Figure 10 Diagram of satellite?Cground integrated water
quality spectra online monitoring scheme
3.2 Key Technologies of Satellite?CGround Integrated Water Quality Spectral
Monitoring
3.2.1
Intelligent Selection of Inversion Models
Water spectra differ among
spatial and temporal distributions; therefore, the water must
be classified and an inversion model must be established to improve
accuracy. The water
quality parameter inversion model is the key to the
design of the water quality spectral monitoring online
system. The system provides two inversion modes: a geographic proximity model
based on geographical coordinates and a similar water-type model based on
spectral matching. The inversion process is shown in Figure 11.
|
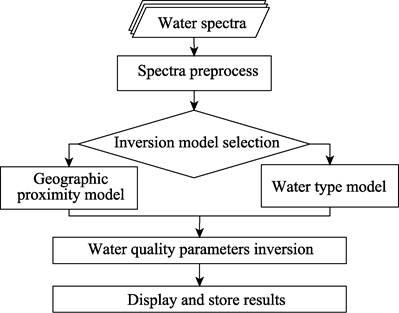
Figure 11 Flow chart of inversion model selection
|
The basic process
of water quality parameter inversion in the system is as follows. The water
spectra are measured by the spectrometer and then transmitted to the
intelligent analysis cloud platform. After pretreatment of the water spectra,
the system retrieves water quality parameters according to the selected
inversion model. Then, the inversion results are transmitted to the terminal
and stored in the cloud platform. At present, the system provides two water
quality inversion models:
(1) Geographic
proximity model
According to the
GPS positioning information of the survey point, the system automatically
identifies and assesses the water quality inversion model adjacent to the survey
point and applies it to the survey point. When the satellite passes, the
satellite data processing system automatically searches the water near the
water to be measured. In combination with the water quality parameters of the
ground network provided by the water quality online monitoring equipment, water
quality parameters are retrieved in real time through a preset algorithm in the
system. The real-time monitoring results and satellite data water quality
parameter inversion products are displayed at the terminal.
(2) Water-type
model
The water spectra
of the point to be measured are automatically matched to all existing water
types in the cloud platform, according to the classification method. Then, the
water quality parameters are retrieved. The water classification method
currently used in the system is the Normalized Trough Depth at 675 nm (NTD675)
method. The types of water quality inversion models will be expanded in future
research and applications. Users will be able to choose a water quality
inversion model according to their actual needs.
3.2.2
Intelligent Matching of Time Scale
Water
quality conditions in complex waters may change within a few hours, and daily observations
are insufficient for fully assessing the spatiotemporal variation of water
quality. Therefore, the optimal observation time and sampling frequency should
be studied to achieve optimal observation with the time scale of the ground
network (Figure 12). The assessment could provide a basis for establishment of
the observation frequency and transit time of hyperspectral water color
satellites.
The high-frequency
observation data obtained by the fixed, intelligent, water quality spectrometer
were resampled. Then, the maximum value, minimum value, mean value, and
variance were determined, as were the characteristics of daily, weekly, and
monthly changes. Inversion of water quality parameters was performed through
the semivariogram.
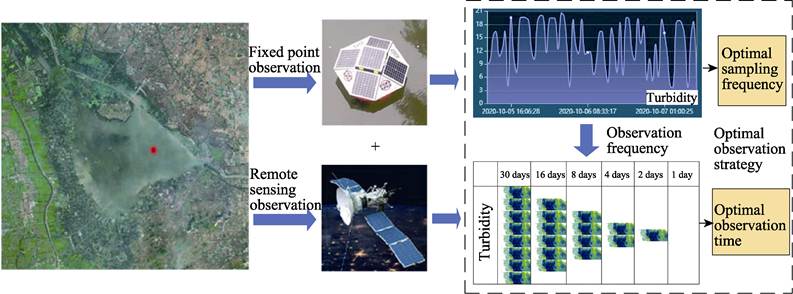
Figure 12 Chart of intelligent matching of
time scale
|
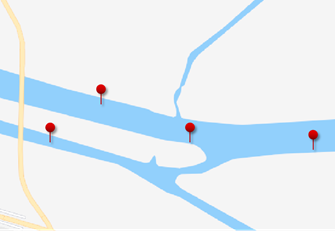
Figure 13 Schematic diagram of optimal
locations of fixed water quality spectrometers
|
3.2.3 Optimization of Spatial
Scale
Water quality monitoring data on the ground are point data, and the water qualities of lakes and rivers vary
among locations. The inversion results cannot represent the water quality of
the entire region if the layout of sampling points is not representative, and
thus an optimal layout strategy of fixed, intelligent,
water quality spectrometers must be designed. When the devices are
deployed at a large scale, the layout points should be arranged reasonably
according to the water types, geographical
spatial correlations, and shape characteristics of different lakes and rivers
(Figure 13).
4
Discussion and Conclusion
The
online monitoring system of water quality spectra can rapidly obtain water
quality parameters in real time, but cannot monitor the water quality in a
large area. Satellite remote sensing, which can be used to obtain a large range
of water quality data in a rapid and timely manner, counterbalances the
shortage of point observation data. Based on the demand for inland water
quality monitoring in China, this study combined online monitoring data with
remote sensing data to carry out research regarding the online monitoring
system and the application of water quality data. The research method was able
to be used to capitalize on the advantages of ground data and remote sensing
data at both temporal and spatial scales, effectively improving the accuracy
and stability of large-scale water quality monitoring.
The method of
coordinating the acquisition of the ground water quality monitoring data with
the hyperspectral satellite data is one of the key problems. Future research
should focus on the following aspects: First, a classification model of inland water
should be studied; at present, there is no high-precision inversion model
suitable for all waters in China and abroad. The spectra of water differ among
spatial and temporal distributions. Therefore, water must be classified and
different inversion models must be established to improve accuracy. Second,
research should be performed to determine the optimal observation frequency for
water quality of typical inland waters in China. The inversion model could be
evaluated, verified, and corrected through online monitoring data of water
quality and satellite transit time to improve the accuracy and stability of the
water quality inversion model and provide a basis for transit time design of
hyperspectral water-color satellites. Third, research should be performed to
establish the fixed-point layout strategy. The spatial scale of typical inland
water monitoring in China could be analyzed to develop an optimal network
layout strategy of observation points according to the geospatial correlation
of observation points, water classification results, and water quality
parameter monitoring results.
Author Contributions
Zhang,
L. F. designed the research and wrote the original draft; Zhang, L. S collected and
processed data, wrote the original draft; Sun, X. J. organized experiments and designed models; Chen, J. did data verification and participated in writing original draft; Wang, S. collected
relevant materials; Zhang, H. M. supplemented
relevant contents; Tong, Q. X. reviewed and revised the
paper.
Conflicts of Interest
The authors
declare no conflicts of interest.
References
[1]
Chen, G., Luo, J., Zhang, C., et al. Characteristics and influencing
factors of spatial differentiation of urban black and odorous waters in China [J].
Sustainability, 2018, 10(12): 4747.
[2]
Wang, Q., Gao, H. J. Current situation, problems and future direction for
governance of black and odorous water bodies in Chinese cities [J]. Chinese
Journal of Environmental Engineering, 2019, 13(3): 507?C510.
[3]
Shen, Q., Zhu, L., Cao, H. Y. Remote
sensing monitoring and screening for urban black and odorous water body: a
review [J]. Chinese Journal of Applied Ecology, 2017, 28(10): 3433?C3439.
[4]
Hou, D. B., Zhang, J., Chen,
L., et al. Water quality analysis by
UV-Vis spectroscopy: a review of methodology and application [J]. Spectroscopy and Spectral Analysis, 2013, 33(7): 1839?C1844.
[5]
Shi, K., Zhang, Y., Zhu, G., et al. Long-term remote monitoring of
total suspended matter concentration in Lake Taihu using 250m MODIS-Aqua data [J].
Remote Sensing of Environment, 2015, 164: 43?C56.
[6]
Song, K., Li, L., Tedesco, L. P.,
et al. Remote estimation of
chlorophyll-a in turbid inland waters: Three-band model versus GA-PLS model [J]. Remote
Sensing of Environment, 2013, 136: 342?C357.
[7]
Jiang, T. L., Zhang, S. Y.,
Ding, C. C., et al. Analyzing trends
of chlorophyll-a concentration in Dongping Lake based on Landsat image from
1985 to 2015[J]. Environmental Monitoring in China, 2018, 34(2): 137?C144.
[8]
Wei, A. N., Tian, L. Q., Chen,
X. L., et al. Retrieval and
application of chlorophyII-a concentration in the Poyang Lake based on
exhaustion method: a case study of Chinese Gaofen-5 Satellite AHSI data [J]. Journal
of Central China Normal University
(Natural Sciences), 2020, 54(3): 447?C453.
[9]
Li, A. M., Xia, G. P., Qi, X., et al. The retrieval method for water
quality CDOM parameter of Tiande Lake in Zhengzhou based on hyperspectral
remote sensing of Zhuhai-1 [J]. Journal of Geomatics Science and Technology,
2020, 37(4): 388?C391, 397.
[10]
Wang, G. Q., Lee, Z. P., Mouw,
C. Multi-spectral remote sensing of phytoplankton pigment absorption properties
in cyanobacteria bloom waters: a regional example in the western basin of Lake
Erie [J]. Remote Sensing, 2018, 10(2): 302?C302.
[11]
Zou, K., Sun Y. H., Li, X. J., et
al. Summary of water quality monitoring based on remote sensing of unmanned
aerial vehicle [J]. Environmental Science & Technology, 2019, 42(S2): 69?C75.
[12]
Cen, Y., Zhang, L. F., Zhang,
X., et al. Aerial hyperspectral
remote sensing classification dataset of Xiongan New Area (Matiwan Village) [J].
Journal of Remote Sensing, 2020, 24(11): 1299?C1306.
[13]
Yu, X. Y., Lu, Q. P., Gao, H.
Z., et al. Current status and
prospects of portable NIR spectrometer [J]. Spectroscopy
and Spectral Analysis, 2013, 33(11): 2983?C2988.
[14]
Tang, J. W., Tian, G. L., Wang,
X. Y., et al. The methods of water spectra measurement and analysis ??: above-water
method [J]. Journal of Remote Sensing, 2004, 8(1): 37?C44.
[15] Chen, Y. A portable spectrometer system for water quality online
detection: design and key parameters optimization [D]. Beijing: Institute of
Remote Sensing and Digital Earth, Chinese Academy of Sciences, 2019.