Dataset Development of the Hotan Oasis,
Water System, Watershed, and Elevation
Lin, J. W.1,2,3
Gui, D. W.1,2,3*
Zhang, S. Y.1,3
Liu, C.4
1. Xinjiang Institute of Ecology and Geography, Chinese Academy of
Sciences, Urumqi 830011, China;
2. University of Chinese Academy of Sciences, Beijing 100049,
China;
3. Cele National Station of Observation and Research for
Desert?CGrassland Ecosystems, Cele 848300, China;
4. Institute of Geographic Sciences and Natural Resources
Research, Chinese Academy of Sciences, Beijing 100101, China
Abstract: The oasis, as a nonzonal
geographical unit in arid regions, sustains the production and livelihoods of
residents, playing an irreplaceable role in regional socioeconomic development.
In this study, remote sensing imagery from Google Earth Pro was utilized as the
main data source. Through visual interpretation, we generated data for the
Hotan Oasis and water systems in 2015. Simultaneously, we employed digital
elevation models (DEMs) and ArcGIS hydrological analysis tools to obtain both
extent and elevation classification data for the mountainous regions in the
Hotan River watershed. The research findings revealed that the total area of
the Hotan Oasis is 4,820.94 km2, with the mountainous region of the
watershed covering 40,812.80 km2. With the use of the hexagonal grid
method for verifying the data accuracy, an accuracy of 96.58% was achieved. The
dataset comprises the following components: (1) boundary data of the oasis; (2)
boundary data of the mountainous part of the catchment; (3) data of the river
system in the catchment; and (4) elevation classification data of the
mountainous part of the catchment. This dataset encompasses 49 files stored in
.kmz, .shp, and .tif formats, with a total data size of 91.40 MB (compressed into
5 files, totaling 45.80 MB).
Keywords: oasis; Hotan; water
systems; watershed; elevation
DOI: https://doi.org/10.3974/geodp.2023.03.10
CSTR: https://cstr.escience.org.cn/CSTR:20146.14.2023.03.10
Dataset Availability Statement:
The dataset
supporting this paper was published and is accessible through the Digital Journal of Global Change Data
Repository at: https://doi.org/10.3974/geodb.2020.09.13.V1
or https://cstr.escience.org.cn/CSTR:20146.11.2020.09.13.V1.
https://doi.org/10.3974/geodb.2022.07.02.V1
or https://cstr.escience.org.cn/CSTR:20146.11.2022.07.02.V1.
1 Introduction
Arid regions constitute a vital aspect of the earth??s
geographical composition, accounting for approximately 45% of the global land
area[1]. These areas experience sparse precipitation and high
evaporation rates, rendering the ecological environment highly fragile and
exceptionally sensitive to climate change and human activities[2].
Oases represent a distinctive landscape where natural and human elements
converge in arid regions. In these landscapes, deserts form the matrix, and
oases serve as embedded jewels. China hosts the largest oasis area globally[3],
characterized by an extensive coverage and diverse types. Oases, which are characterized by abundant
water sources, fertile soil, and lush vegetation, sharply differ from the arid
and barren surroundings and play a
crucial role in the arid regions of Northwest China. Oases not only serve
as significant production bases for crops such
as arid grains and cotton but also serve as processing
centers for natural resources[4]. Simultaneously, oases, which
function as focal points for human settlement
and activities, are preferred locations for urban development. They accommodate
more than 95% of the population in arid
regions, contributing more than 90% to
the output for the creation of social wealth[5].
Therefore, oases have become a focal point of research
and attention in arid regions. However, due to the late development of the
oasis discipline and relatively unique characteristics, the oasis concept has not been fully
elucidated, and different researchers have
proposed different definitions of the oasis for
different research purposes and needs[6?C8]; as a result, the precise distribution of oases has been plagued by unclear basic records and large
discrepancies in data, which has impeded
the development of the oasis discipline. Through a comprehensive comparison of
various viewpoints and combining characteristics observed in remote sensing
images and on-site survey data, in this paper, oases are ultimately defined as
exhibiting three essential features: 1) existing in arid and semiarid regions; 2) situated in a desert matrix; and 3) providing a stable water supply, forming a
heterogeneous landscape unit with a certain vegetation cover or economic
productivity.
The precise definition of an oasis is crucial for determining its spatial extent and
distinguishing it from the background desert area. This approach serves as the basis for extracting oasis boundaries.
After clarifying the definition of an oasis, the Hotan Oasis is used as an
example in this paper, and high-precision
remote sensing imagery, terrain data, and other multisource data are employed to accurately locate and delineate
the spatial extent of the Hotan Oasis and Hotan River watershed, leading to the
development of the Hotan Oasis, river system, watershed, and elevation
classification dataset. This dataset provides data support for the development
and planning of the Hotan region and lays
the foundation for and establishes a clear
direction for the creation and publication of oasis datasets for other regions
of China in the future.
2 Metadata of the Dataset
The metadata of the Hotan Oasis,
river system, watershed, and elevation classification dataset[9,10] are summarized in Table 1.
3 Methods
3.1 Study Area
The Hotan region is one of the
five major regions in the Xinjiang Uygur autonomous region. This region boasts a rich history and is renowned for producing high-quality Hotan jade. It holds an important
position in Xinjiang??s economy. The Hotan region is a multiethnic settlement area where the cultures of various ethnic groups, including the
Uighur and Han
Table 1 Metadata
summary of the Hotan Oasis, river system, watershed, and elevation
classification dataset
|
Item
|
Description
|
|
|
Dataset full name
|
Hotan Oasis/Water system,
watershed and elevation classification dataset in the upper reaches of Hotan
River, China
|
|
Dataset short name
|
HotanOasis/HotanUpperRiverBasinElvc
|
|
Authors
|
Lin, J. W., Xinjiang Institute of
Ecology and Geography, Chinese Academy of Sciences, 971628566@qq.com
|
|
Gui, D. W., Xinjiang Institute of
Ecology and Geography, Chinese Academy of Sciences, guidwei@ms.xjb.ac.cn
|
|
Zhang, S. Y., Xinjiang Institute of
Ecology and Geography, Chinese Academy of Sciences, zhangsy@ms.xjb.ac.cn
Liu, C., Institute of Geographic
Sciences and Natural Resources Research, Chinese Academy of Sciences,
lchuang@igsnrr.ac.cn
|
|
Geographical region
|
Hotan of Xinjiang
|
|
Year
|
2015
|
|
Data format
|
.kmz, .shp, .tif
|
|
Data size
|
91.40 MB??45.80 MB after compression??
|
|
Data files
|
(1) Boundary data of the oasis; (2)
boundary data of the mountainous part of the catchment; (3) data of the river
system in the catchment; (4) elevation classification data of the mountainous
part of the catchment
|
|
Foundations
|
National Natural Science
Foundation of China (42361144792, 42171042)
|
|
Computing environment
|
ArcGIS
|
|
Data publisher
|
Global Change Research
Data Publishing and Repository, http://www.geodoi.ac.cn
|
|
Address
|
No. 11A, Datun Road,
Chaoyang District, Beijing 100101, China
|
|
Data sharing policy
|
(1) Data
are openly available and can be free downloaded via the Internet; (2) End
users are encouraged to use Data subject to citation; (3)
Users, who are by definition also value-added service providers, are welcome
to redistribute Data subject to written permission from the GCdataPR Editorial
Office and the issuance of a Data redistribution license; and (4)
If Data
are used to compile new datasets, the ??ten per cent principal?? should be
followed such that Data records utilized should not
surpass 10% of the new dataset contents, while sources should be clearly
noted in suitable places in the new datase[11]
|
|
Communication and
searchable system
|
DOI, CSTR, Crossref, DCI,
CSCD, CNKI, SciEngine, WDS/ISC, GEOSS
|
people, are
blended. Positioned as a crucial hub along the ancient Silk Road, Hotan plays a
pivotal role in the historical and cultural heritage of Xinjiang. The region
experiences extremely arid conditions, with hot and rain-scarce summers and
dry, cold winters[12]. Also referred to as the Ho-Mo-Luo Oasis, the
Hotan Oasis is the largest oasis on the northern slope of the Kunlun Mountains.
As shown in Figure 1, the Hotan Oasis is situated at the southern edge of the
Tarim Basin and is surrounded by the
Tianshan Mountains and Pamir Plateau, facing the vast Taklamakan Desert. Due to
prolonged human activity and development, much of the area in the Hotan Oasis
has transitioned from a natural oasis to an artificial oasis. The Hotan Oasis serves as the primary support for
the social and economic activities of the residents in the Hotan region,
serving as a foundational base for both agricultural production and industrial
development.
3.2
Data Sources and Methods
The data for this study primarily included Hotan Oasis data, Hotan water system data, range data for the
mountainous areas in the Hotan River watershed, and elevation classification
data. The oasis and Hotan water system data are sourced from Google Earth Pro
remote
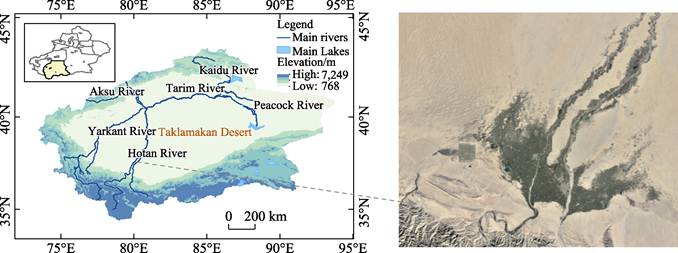
Figure 1 Geo-location of the Hotan area and remote sensing image of the Hotan Oasis
sensing imagery. This
dataset is compiled from various commercial image providers,
such as DigitalGlobe, EarthSat, SPOT, and
government agencies, to
construct multiple sets of satellite map data. These datasets exhibit different
zoom levels, extensive geographical coverage, and high spatial resolution from
optical sensors (achieving submeter
levels). This approach is advantageous
for obtaining high-quality, detailed geographical information data for the
Hotan region, facilitating further analysis and extraction.
While there are several automated[13] or semiautomated[14]
methods available for feature extraction, the spatial heterogeneity of
vegetation types within oases and the diversity of oasis boundary patterns
often lead to a suboptimal extraction accuracy. Therefore, we employed a
visual interpretation method to extract oasis and water system data, ensuring
data high accuracy and high quality. First,
we selected remote sensing images of the summer of 2015 for oasis boundary
extraction. In summer, when the vegetation in oases is mostly lush and there is
no snow cover, the contrast between the oasis
and desert is highest, facilitating the use of image features to distinguish
different land cover types. Second, we
zoomed the images to the maximum level on Google Earth, with the minimum
requirement a view height less than
1.5 km and a spatial resolution less than 1 m. Subsequently, based on the
actual ground conditions, we identified different land cover types, used
mapping functions to set control points, and saved the generated oasis boundary
and water system data as a .kmz file. Next, we imported the .kmz file into
ArcGIS and converted it into a shp-format
vector file for subsequent geographical information analysis and processing. In
ArcGIS, we conducted thorough spatial topology checks, including addressing
issues such as connecting floating points, eliminating redundant line segments,
and correcting polygon geometric deformations, ensuring data consistency and
accuracy. Finally, we converted the oasis data polyline file into a polygon file, added information such as names in both Chinese and English,
area, and length to the attribute table and removed patches with an area less
than 0.01 km2 to better represent the oasis spatial extent and geographical features.
The range data for the
mountainous areas in the Hotan River watershed and elevation classification
data were developed using the ASTER GDEM 30 m product sourced from the Geospatial Data Cloud website. The watershed extraction process relies on hydrological
analysis tools in ArcGIS software. The specific steps are as follows: firstly,
the DEM surface of the Hotan region is filled to prevent unrealistic or
erroneous flow directions during analysis caused by the presence of depressions.
Then, the flow direction of each pixel in the raster is computed, generating
the flow accumulation amount. With the use of the raster calculator, the
expression was defined as Con(DEM_Flow>1000,1) to create river
network raster data. Subsequently, the generated raster river network is
converted into vector format, outlets are defined, and a preliminary Hotan
River watershed range is obtained. Finally, this approximate watershed range is
imported into Google Earth as a
baseline. Based on the topography of the mountainous areas in the images,
high-precision boundary data for the mountainous regions in the Hotan River
watershed are obtained. The production of
elevation classification data involves using the obtained range for the
mountainous areas in the Hotan River watershed as a mask to extract DEM data.
Then, by overlaying river data and correcting abnormal pixel values based on
the natural principle of water flowing downhill, elevation classification is conducted in ArcGIS using the raster
reclassification tool with intervals of 500 m for the mountainous regions in the Hotan River watershed.
4 Data Results and Validation
4.1 Data Composition
The dataset comprises a
total of 49 data files, archived in .kmz, .shp, and .tif data formats, with a total data size of 91.40 MB. These files
have been compressed into 5 files, totaling 45.80 MB.
4.2 Data Results
|
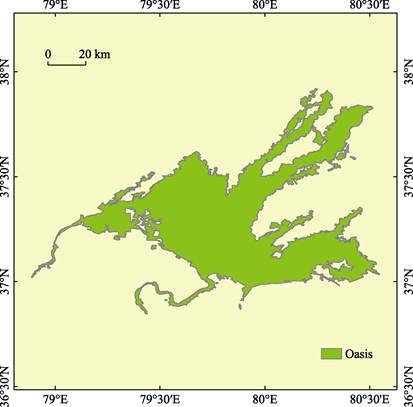
Figure 2
Map of the Hotan Oasis
|
As shown in Figure 2, the
specific geographic coordinates of the Hotan Oasis are 36??55ʹ45ʺN?C37??55ʹ11ʺN and 78??03ʹ11ʺE?C 80??32ʹ52ʺE. In
2015, the total area of the Hotan Oasis,
calculated based on the Albers
projection, was 4,820.94 km2, and the total perimeter, based
on the Lambert projection, was 2,358.08 km. Among the various counties in
the Hotan region, the Hotan Oasis is
predominantly located in Moyu county
(34.32%), followed by Hotan county
(28.46%) and Luopu county (20.71%). Hotan city (8.40%), Kunyu city (5.08%), and Pishan county
(3.03%) exhibit smaller areas.
The existence of water defines an oasis, while the absence of water
characterizes a desert. The survival and development of the Hotan Oasis
primarily depend on surface runoff from melting snow and ice in the Kunlun
Mountains and a small amount of atmospheric precipitation, which forms the Hotan River. The
spatial variations in the Hotan River and
its tributaries are critical drivers of
the formation of the Hotan Oasis, significantly influencing its spatial
distribution. The Hotan River system comprises two main branches, i.e., the eastern Yulong Kashgar River
(referred to as the Yuhe River), which
originates from the northern foothills of the
Kunlun Mountains and extends for 554.84
km, and the western Karakash River
(referred to as the Kahe), which originates
from the northern foothills of the Karakoram Mountains and extends for 797.21 km. The Hotan Oasis was formed by irrigating
the alluvial plains of the Kunlun Mountains with the source of the two rivers
as the centerline and secondary rivers and irrigation canals as links. As shown
in Figure 3, the geographic coordinates of the mountainous part of the Hotan
River basin are 34??50ʹ40ʺN?C37??11ʹ37ʺN and 77??23ʹ55ʺE?C81??40ʹ52ʺE. The area
of the mountainous region in the Hotan River watershed is 40,812.80 km2,
with a boundary length of 1,829.46 km. The elevation of the mountainous region
in the Hotan River watershed is classified into 12 categories, ranging from
<1,500 m at the lowest point to >6,500
m at the highest point.

Figure 3 Extent and elevation classification of
the mountainous part of the Hotan River basin
4.3 Data Validation
We validated the accuracy of the Wada Oasis dataset
using a method typically used to validate the accuracy of remote sensing
classification. First, a 500 m ?? 500 m hexagonal grid was constructed to cover all the Wada oasis areas. Subsequently, different numbers of
validation points were randomly generated based on the proportion of the oasis
coverage area in each hexagonal grid cell: 5 points were generated for areas
with a proportion of 0%?C 20% of the coverage area, 10 points were
generated for areas with a proportion of 20%?C40%
of the coverage area, 15 points were generated for areas with a proportion of 41%?C60% of the coverage area, 20 points were
generated for areas with a proportion of 61%?C80%
of the coverage area, and 25 points were generated for areas with a proportion of 80%?C100% of the
coverage area. Next, after extracting the latitudinal and longitudinal coordinates of each validation point and determining
whether they were located in the oasis region specified in the dataset, we
imported these points into Google Earth Pro to visually determine whether they
were indeed oasis points. As shown in Figure 5, this process resulted in the
generation of 332 grids, the evaluation of 5,549 points, and a total of 5,359
points correctly categorized as oasis points, with an accuracy rate of 96.58%.
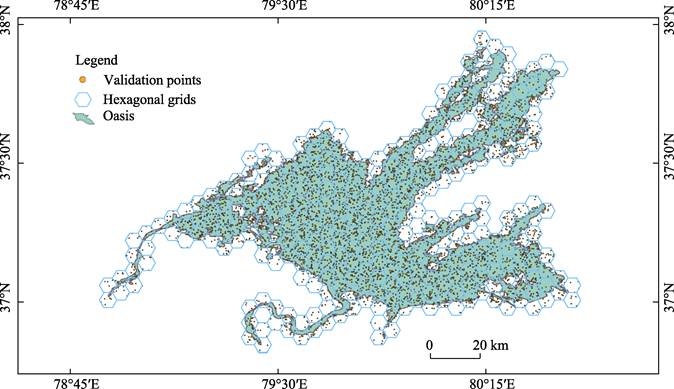
Figure 4 Distribution map of the hexagonal grids
and validation points
5 Discussion and Conclusion
In this study, we constructed a Hotan Oasis, water system, mountainous part of the watershed and elevation
classification dataset based on Google Earth Pro images and DEM data. This
dataset is the first high-precision dataset of an oasis in China. It finely captures the spatial distribution of the Hotan Oasis in 2015 and promotes the development of oasis
research from qualitative to quantitative. In this paper, the area of the Hotan
River oasis in 2015 was 4,820.94 km2, and the area of the
mountainous part of the Hotan River basin was 40,812.80 km2.
It should be noted that this dataset is based on Google Earth Pro time-specific
imagery, and it may be necessary to adjust the time of the imagery when using
it in order to avoid updating the imagery so that it does not correspond to the
dataset.
Author
Contributions
Gui, D. W. and Liu C. developed the overall design for dataset development. Lin, J. W. collected and
processed the data. Zhang, S. Y. validated the data. Lin, J. W. wrote the
paper.
Conflicts of
Interest
The
authors declare no conflicts of interest.
References
[1]
Prăvălie, R. J. E-S R. Drylands extent and
environmental issues [J]. A global
approach, 2016, 161: 259?C278.
[2]
Chen, F. H., Huang, W., Jin, L. Y., et al. Characteristics of precipitation
changes and their spatial differences in the arid zones of Central Asia in the
context of global warming [J]. Science
China: Earth Sciences, 2011,
41(11): 11?C27.
[3]
Liu, X., Wang, Y., Xin, L., et al.
China??s oases have expanded by nearly 40% over the past 20 years [J]. Land Degradation and Development, 2022,
33(18): 3817?C3828.
[4]
Han, D. L. Xinjiang Artificial Oasis [M]. Beijing: China
Environmental Science Press, 2001.
[5] Gui,
D. W., Zeng, F. J., Lei, J. Q., et al.
Suggestions for Sustainable Development of the Oases in the South Rim of Tarim
Basin [J]. Journal of Desert Research,
2016, 36(1): 6?C11.
[6]
Jia, B. Q. Exploration of some
theoretical issues in oasis landscapes [J]. Arid
Land Geography, 1996, 19(3): 8?C15.
[7]
Shen, Y. C., Wang, J. W., Wu, G.
H., et al. China Oasis [M]. Zhengzhou:
Henan University Press, 2001.
[8]
Chen, X., Luo, G. P. Research
on oasis ecology in arid zones and its progress [J]. Arid Land Geography, 2008, 26(4): 7?C15.
[9]
Gui, D. W., Xue, J., Liu, Y., et al. Hotan Oasis [J/DB/OL]. Digital Journal of Global Change Data
Repository, 2020. https://doi.org/10.3974/geodb.2020.09.13.V1.
https://cstr.escience.org.cn/CSTR:20146. 11.2020.09.13.V1.
[10]
Gui, D. W., Li, B. F., Zhang,
S. Y., et al. Water System, watershed
and elevation classification dataset in the upper reaches of Hotan River, China
[J/DB/OL]. Digital Journal of Global
Change Data Repository, 2022. https://doi.org/10.3974/geodb.2022.07.02.V1.
https://cstr.escience.org.cn/CSTR:20146.11.2022. 07.02.V1.
[11]
GCdataPR Editorial Office.
GCdataPR data sharing policy [OL]. https://doi.org/10.3974/dp.policy.2014.05
(Updated 2017).
[12]
Dong, D. W. Analysis of spatial
and temporal evolution of Hotan oasis in the context of urbanization [D]:
Urumqi: Xinjiang University, 2019.
[13] Yao,
J., Wu, J., Xiao, C., et al. The
classification method study of crops remote sensing with deep learning, machine
learning, and Google Earth engine [J]. Remote
Sensing, 2022, 14(12): 2758.
[14] Cheng,
Y., Wang, W., Ren, Z., et al.
Multi-scale Feature Fusion and Transformer Network for urban green space
segmentation from high-resolution remote sensing images [J]. International Journal of Applied Earth
Observation and Geoinformation, 2023, 124: 103514.