2015: How Many Islands (Isles, Rocks), How Large Land Areas, and How Long of Shorelines in the World?—Vector Data Based on Google Earth Images
Liu, C.1* Shi, R. X.1 Zhang, Y. H.1 Shen, Y.1 Ma, J. H.1 Wu, L. Z.2 Chen, W. B.3,4 Tomoko Doko3,4 Chen, L. J.5 Lv, T. T.6 Tao, Z.6 Zhu, Y. Q.1
1. Institute of Geographic Sciences and Natural Resources Research, Chinese Academy of Sciences, Beijing 100101, China;
2. China Polar Research Center, Shanghai 200136, China;
3. Keio Research Institute at SFC, Keio University, Fujisawa 2520882, Japan;
4. Nature & Science Consulting Co., Ltd., Yokohama 2310032, Japan;
5. National Geomatics Center of China, Beijing 100830, China;
6. Aerospace Information Research Institute, Chinese Academy of Sciences, Beijing 100101, China
Abstract: The Intergovernmental Panel on Climate Change (IPCC) report indicated that by the end of the current century, sea level has the potential to rise by 40-63 cm. If this occurs, the impact on coastal zones and small islands will be very obvious. The Sustainable Development Goals of the United Nations also place special emphasis on promoting capacity-building mechanisms of small island developing states. The global vector shoreline dataset with meters resolution in 2015 has become a useful dataset for obtaining additional detail on the world’s shorelines and islands, especially the small islands. The global multiple scale shorelines dataset in 2015 is based on Google Earth remote sensing images and the global vector shoreline data with meters resolution is part of the dataset. It was obtained through human-computer interaction based on Google Earth images (2015±2 years). The data result in 2015 showed the following: the total area of the world including continental mainland and islands (isles, rocks) is 147,493,462.77 km2, in which the area of the global continental mainland is 137,126,029.55 km2, the total area of global islands (isles, rocks) is 10,367,433.22 km2, the global continental mainland shorelines are 734,739.56 km, and that of islands is 1766,013.29 km. The largest continent among the seven continents is Asia. Its area is 44,127,508.85 km2, at 29.91% of the total area of the world. The area of Africa is 29,834,614.26 km2 (20.23%), North America is 24,243,886.75 km2 (16.44%), South America is 17,741,013.97 km2 (12.03%), Antarctica is 12,610,490.93 km2 (8.55%), Europe is 9,996,090.89 km2 (6.78%), and Oceania is 8,939,857.13 km2(6.06%). There are a total of 656,850 islands (isles, rocks) whose area is larger than 6 m2, in which, 95.69% of them are smaller than 1 km2; there are only 28,263 islands with an area larger than 1 km2 (4.3%), while, their area occupies 99.76% of the total area of the global islands (isles, rocks). Specifically, there are nine islands with an area larger than 2×10⁵ km2. The total area of the nine largest islands is 55.83% of the total area of the global islands (isles, rocks). The largest island of the world is Greenland with an area of 2,112,450.44 km2. North America has the largest number of islands (isles, rocks) of any continent (271,128, 41.27% of the global islands), and it also has the largest area, at 4,185,970.55 km2, accounting for 40.38% of the total area of the world’s islands (isles, rocks).The total length of the global shoreline is 2,500,752.85 km, among which the north American shoreline is the longest, at 875,242.66 km, which is 34.99% of the total length of the global shoreline. Followings are Asia (587,803.99 km, 23.51%), Europe (382,001.76 km, 15.28%), South America (250,230.74 km, 10.01%), Oceania (201,622.08 km, 8.06%), Africa (121,545.74 km, 4.86%), and Antarctica (82,305.88 km, 3.29%). The dataset is archived in .kmz, .shp.rar, and .xlsx formats.
Keywords:global shorelines; islands; vector data; meters resolution; Google Earth; 2015
1 Introduction
The Sustainable Development Goals of the United Nations were initiated in 2015[1], to be completed by the target year of 2030. There is an urgent need to take action to address climate change and its planetary impacts. The Intergovernmental Panel on Climate Change (IPCC) indicates in a recent report that the oceans will warm and sea ice will continue to melt, with an estimated increase in sea level of 24−30 cm by 2065 and 40−63 cm by 2100. Even if emissions were stopped now, the manifold effects of warming would last for centuries.
In response measures, it is clear that small island developing states should be encouraged to devise capacity-building mechanisms for effective planning and management related to climate change[2]. During the implementation of above sustainable development goals of the United Nations, there is a fundamental question to be answered in the field of scientific research data on global change: how many islands (isles, rocks) did the world have in 2015? What continent’s shoreline was most directly affected by climate change? What was the spatial distribution of the islands and shorelines? All these questions require detailed and reliable geographic information system data to be answered.
The earliest that vector data for global shoreline and islands can be traced back is 1990[3], and in 1992, the United States, Canada, Australia, and the British navy collaborated to issue a 1:1,000,000 scale digital map of the world (Digital Chart of the World, DCW)[4]. The US Geological Survey converted it into online ArcInfo vector data in 1994[5]. The Environmental Systems Research Institute, Inc. of the United States (ESRI) also published the ESRI version of global shoreline and island data[6]. In order to understand global changes, US National Oceanic and Atmospheric Administration (NOAA) and several other research institutes obtained openly accessible global shoreline data[7]. Professor Wessel of the University of Hawaii and Dr. Smith of NOAA published high-resolution global shoreline data[8] in 1996. These data have been continuously updated during the past two decades. The most updated version, 2.3.7[9] has been online since June 15, 2017. The smallest island (isle, rock) in this dataset covers an area of 177 m2, and the statistical result based on this dataset is that there are 179,831 islands (isles, rocks) in the world (Antarctica data are exclusive), the total length of shorelines of the world is 2,259,617.64 km (Antarctica data are exclusive), and the total area is 134,916,700.69 km2[9] (Antarctica data are exclusive). Since the advent of Google Earth, the academic community has put forward an agenda to improve the spatial resolution of global island and shoreline data from remote sensing satellite images with meters resolution. The data of Wessel et al. (version 2017)[9] roughly match those of Google Earth remote sensing satellite images, but there are also prominent differences, as shown in Figure 1. In this case, the development of high-resolution global shoreline and island (isle, rock) datasets with a background in 2015 based on open Google Earth images is not only urgently needed by the academic community, but also is possible. Based on Google Earth images, the global multiple scale shorelines dataset (2015) (GMSSD_2015) was developed[10].
2 Metadata of Dataset
|
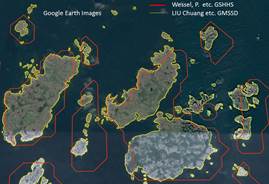
Figure 1 Comparison between GSHHG data of Wessel et al.[9] and GMSSD data of Liu et al.[10] under Google Earth images (Oran Islands in Europe)
|
The “Global multiple scale shorelines dataset based on Google Earth images (2015)”[10] consists of a series of data with spatial resolution of meters (less than 10 m), 30 m, 250 m, 1 km, 10 km, and 20 km. The current study only discusses the data with resolution in meters. The summary of the metadata is shown in Table 1.
Table 1 Metadata summary of the “Global multiple scale shorelines dataset based on Google Earth images (2015)” (meters resolution)
|
Items
|
Description
|
|
Dataset full name
|
Global multiple scale shorelines dataset based on Google Earth images (2015) (meters resolution)
|
|
Dataset short name
|
GMSSD_2015
|
|
Authors
|
Liu, C. L-3684-2016, Institute of Geographic Sciences and Natural Resources Research, Chinese Academy of Sciences, lchuang@igsnrr.ac.cn
Shi, R. X. L-4389-2016, Institute of Geographic Sciences and Natural Resources Research, Chinese Academy of Sciences, shirx@igsnrr.ac.cn
Zhang, Y. H. A-3436-2019, Institute of Geographic Sciences and Natural Resources Research, Chinese Academy of Sciences, zhangyinghua@igsnrr.ac.cn
Shen, Y. C-6558-2019, Institute of Geographic Sciences and Natural Resources Research, Chinese Academy of Sciences, shenyan@igsnrr.ac.cn
Ma, J. H. S-9830-2017, Institute of Geographic Sciences and Natural Resources Research, Chinese Academy of Sciences, majh@igsnrr.ac.cn
Wu, L. Z. AAA-3615-2019, China Polar Research Center, wulizong@pric.org.cn
Chen, W. B. L-5715-2016, Keio Research Institute at SFC, Keio University; Nature & Science Consulting Co., Ltd., chenwb3@gmail.com
Tomoko, D. L-6494-2016, Keio Research Institute at SFC, Keio University; Nature & Science Consulting Co., Ltd., dokochan@sfc.keio.ac.jp
Chen, L. J. L-4546-2016, National Geomatics Center of China, chenlj@ngcc.cn
Lv, T. T. R-8978-2016, Aerospace Information Research Institute, Chinese Academy of Sciences, lvtt@radi.ac.cn
Tao, Z. L-4530-2016, Aerospace Information Research Institute, Chinese Academy of Sciences, taozui@radi.ac.cn
Zhu, Y. Q. L-6116-2016, Institute of Geographic Sciences and Natural Resources Research, Chinese Academy of Sciences, zhuyq@igsnrr.ac.cn
|
|
Geographical region
|
Global Year 2015
|
|
Data format
|
.shp.rar, .kmz, .xlsx Data size 4.97 GB
|
|
Data files
|
The dataset consists of 61 files. Detailed information is shown in Table 6.
|
|
Foundations
|
Ministry of Science and Technology of P. R. China (2017YFA0604701); Chinese Academy of Sciences (XDA19090110)
|
|
Data publisher
|
Global Change Research Data Publishing & Repository, http://www.geodoi.ac.cn
|
|
Address
|
No. 11A, Datun Road, Chaoyang District, Beijing 100101, China
|
|
Data sharing policy
|
Data from the Global Change Research Data Publishing & Repository includes metadata, datasets (data products), and publications (in this case, in the Journal ofGlobal Change Data & Discovery). Data sharing policy includes: (1) Data are openly available and can be free downloaded via the Internet; (2) End users are encouraged to use Data subject to citation; (3) Users, who are by definition also value-added service providers, are welcome to redistribute Data subject to written permission from the GCdataPR Editorial Office and the issuance of a Data redistribution license, and; (4) If Data are used to compile new datasets, the ‘ten percent principal’ should be followed such that Data records utilized should not surpass 10% of the new dataset contents, while sources should be clearly noted in suitable places in the new dataset[11]
|
3 Procedures for Dataset Development
The GMSSD_2015 was developed based on Google Earth images. The procedure of the dataset development is shown in Figure 2.
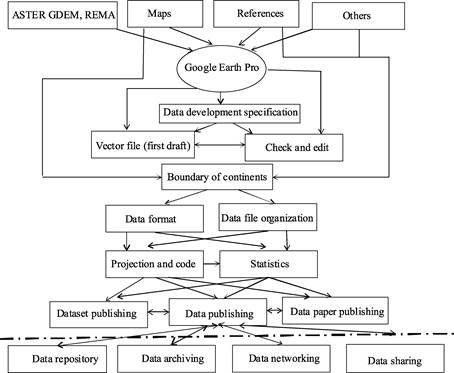
Figure 2 Development procedure of the “Global multiple scale shorelines dataset based on Google Earth images (2015)” (meters resolution)
In addition to the Google Earth images, which are the most important information sources for this dataset, DEM[12–13] data were adopted for supplement. Different scale maps and publications were also used for the dataset development. By human-computer interaction methods with support from the Google Earth computing environment, the shoreline data development specification, data file organization methods, parameters, and data formats had been identified. For the convenience of data inspection, the first draft of the spatial data consisted of more than 100 data files. Then, the spatial data were edited, and after seven rounds of confirming, modifying, re-editing, re-confirming and re-modifying, the final draft of the spatial data was completed.
In order to facilitate worldwide reuse, the dataset is archived in .kmz and .shp formats. Due to the large amount of data, for the convenience of downloading and sharing, and considering the accessibility of the current computer network in developing countries and the capacity limitation of personal computers, each data file was limited to 300 MB according to the range of continents and the maximum data volume required to organize the data file. According to the basic principles of equal area and equal length projections, the areas of mainland and islands (isles, rocks) for each continent were calculated. Finally, the dataset and the data article were published.
4 Data Development Specification
4.1 Definition of a Continental Shoreline
The continental shoreline is the boundary between land and sea. Due to the tidal action of the ocean, the boundary between the ocean and the land is a zone with dynamic change. The area between the high-water line of the ocean and the low-water line of the ocean spring tide is the intertidal zone[14]. The width of the intertidal zone varies according to different areas and times. Different from the definition of the high-water line of the ocean spring tide as the shoreline[15], the shoreline determined in this dataset refers to the sea and land boundary recorded by Google Earth satellite remote sensing images in 2015 (including 1-2 years before or after). Because the times of the remote sensing images recorded by Google Earth satellite in different regions are different, it is impossible to confirm whether the maritime and land boundaries recorded by these remote sensing images are at high-water line or at low-water line. However, it is certain that the boundary between land and sea recorded by Google Earth satellite remote sensing images at any time must be located in the intertidal zone. The width of the intertidal zone varies from region to region (Figures 3-5), and its width is usually closely related to the slope of the terrain. When the terrain slope is relatively gradual, the intertidal zone is very wide, and when the slope is very steep, the intertidal zone is very narrow. On the steep, vertical rocky coast, the intertidal zone fluctuates near a line in very small amplitude. Thus, the difference between the continental shoreline defined in this dataset and the standard shoreline (high-water line of spring tide) is less than or equal to the width of the intertidal zone in the region.
|
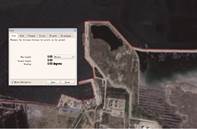
Figure 5 Difference between sea-land boundary of Google Earth image and the high-water line in artificial shoreline of Wei-hai city, Shandong province, China (0 m)
|
|
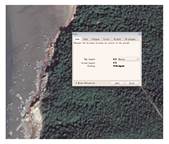
Figure 4 Difference between sea-land boundary of Google Earth image and the high-water line in rock shoreline of P. R. Korea (8 m)
|
|
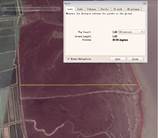
Figure 3 Difference between sea-land boundary in Google Earth image and the high-water line in Northern Jiangsu, China (1.63 km)
|
4.2 Definition of an Estuarine Shoreline (Excluding Deltas)

Figure 7 Lena River Delta, consisting of 1,564 sand islands
An estuary shoreline is a unique coast type[16–17] that is formed under the dual action of a river and ocean tides. The location of the shoreline of different types of estuaries varies greatly. It is indistinguishable while under the satellite remote sensing image, with rivers and the sea tide as the leading factors. However, as the estuarine topography and geomorphology is impacted greatly by rivers and ocean tides, this dataset defines the shoreline estuary area (not including deltas) as the area ceiling that is impacted obviously by ocean tides according to the estuarine topography and landform characteristics (Figure 6).
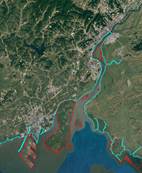
Figure 6 Definition of Yalu River estuary shoreline
4.3 Definition of Delta Shoreline
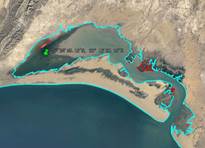
Figure 8 Lagoon coast in the Pakistani coastal zone, South Asia
In general, large rivers form deltas at their estuaries. Most deltas are fan-shaped landforms with multiple channels and islands. It is clear that deltas are formed by a long period of interaction between rivers and oceans. In general, the closer the distance to the ocean, the greater the ocean effect is, and the later the island is formed; on the contrary, the closer the distance to the delta estuary, the more important the river’s effect is and the earlier the island is formed. Therefore, it can be concluded that the dominant boundary of the ocean must lie within the delta. However, in order to ensure the integrity of the delta, the delta shoreline defined in this dataset is located at the fan vertex of the delta estuary. An example of this is the Lena River Delta[18] (Figure 7).
4.4 Definition of a Lagoon Shoreline
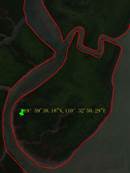
Figure 9 Mangrove coast, Hainan Island, China
Lagoon shoreline is a unique coast type[19] that is mainly under the action of land and sea. The water body originally belonging to the marine part is surrounded by land and becomes a water body with seawater channels. This part of the water body originally belongs to the ocean, and then becomes a semi-independent water body, or is affected by land-water inflow. Another type is the lagoon in the coral island, and this part of the shoreline is included in the lagoon shoreline type in this dataset and is included in the definition specification of shoreline division (Figure 8).
4.5 Definition of a Mangrove Shoreline
A mangrove shoreline is unique[20], and is defined by an outer boundary of mangroves that can be identified by Google Earth satellite remote sensing images. An excellent example of a mangrove shoreline can be seen at Hainan Island, China[21–22] (Figure 9).
4.6 Definition of a Glacial Shoreline
|
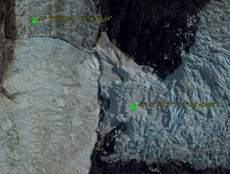 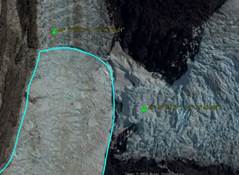
Figure 10 Definition of the glacier shoreline in the western Patagonia ice sheet, south of South America
|
A glacier shoreline is determined as the position where a solid glacier meets the ocean[23]. For example, the glacier shoreline in the Patagonia ice sheet in the south of South America is defined as the area where the tail of the glacier meets the ocean (Figure 10).
4.7 Definition of an Island (Isle, Rock)
According to international practice, Greenland is the largest island in the world[24–25]. Greenland and any independent land with an area that is smaller than Greenland are defined as an island. This definition is different from that of United States Convention on the Law of Sea (briefed as Convention hereafter) (land area that is higher than the water surface, natural, and can sustain human habitation or economic life itself)[15]. This dataset defines an island (isle, rock) as: can be identified in Google Earth images, and have above-ocean surface area greater than 6 m2 for natural or artificial islands, isles, rocks, and beaches. The definition of islands (isles, rocks) in this dataset is obviously broader than that of the Convention. There are four main differences between the two definitions, as described below:
First, the definition of higher than the ocean surface is different: according to the Convention[15], the part that is higher than the ocean surface at high tide is the island boundary, while in this dataset, the part the is higher than the ocean surface shown by the satellite remote sensing image displayed in the Google Earth system is the island boundary. Second, the cause of formation is different: the Convention[15] stipulates that the land should be formed naturally, while this dataset defines that the land can be formed naturally or artificially. Third, human conditions are different: the Convention[15] stipulates that human habitation or economic life should be maintained, which is not a special condition in this dataset. Fourth, the minimum area is different: the Convention[15] does not provide the definition of the island area, while the minimum island (isles, rocks) area given in this dataset is 6 m2.
4.8 Classification of Islands (Isles, Rocks)
Table 2 Island classification by area and code
|
Code
|
Area range
(km2)
|
Code
|
Area range
(km2)
|
|
A
|
A≥200,000
|
F
|
1,000>F≥100
|
|
B
|
200,000>B≥100,000
|
G
|
100>G≥50
|
|
C
|
100,000>C≥10,000
|
H
|
50>H≥10
|
|
D
|
10,000>D≥5,000
|
I
|
10>I≥1
|
|
E
|
5,000>E≥1,000
|
J
|
1>J
|
The area of the global islands greatly varies, with the largest area of Greenland reaching 2,112,450.44 km2[25], and the smallest area of rocks remaining 6 m2. According to the area, this dataset divides the islands into 10 types, i.e., 200,000, 100,000, 10,000, 5,000, 1,000, 100, 50, 10, and 1 km2, assigning A-J codes to each type, respectively. Their definitions are shown in Table 2.
4.9 Data File Naming
Table 3 Continent abbreviation in the data file
|
Continent
|
Abbreviation
|
|
Africa
|
AF
|
|
Antarctic
|
AN
|
|
Asia
|
AS
|
|
Europe
|
EU
|
|
North America
|
NA
|
|
Oceania
|
OA
|
|
South America
|
SA
|
The name of the data file briefly describes the main attributes of the data. The file was named in a six-segment way, i.e., continent_mainland/island_shoreline_spatial resolution_ projection_year. There are two types for the second segment: C is for the mainland and I is for island. The meters resolution is expressed as m, the geographic coordinate system is expressed as gg, and the year is 2015. For example, SA_C_shoreline_m_ gg_2015 is the shoreline data in 2015 with meters resolution and geographic coordinate system for the mainland of South America, and SA_I_shoreline_ m_gg_2015 is the shoreline data in 2015 with meters resolution and geographic coordinate system for the islands (isles, rocks) of South America. The corresponding abbreviations are AF for Africa, OA for Oceania, NA for North America, EU for Europe, AS for Asia, and AN for Antarctica (Table 3).
4.10 The Data Files OrganizedAccording to the Geographical Scope of Seven Continents
Due to the large amount of global data, its organization was performed according to network conditions and the size of the data files. Generally, global data files are organized according to three conditions: first, according to the longitude and latitude; second, by region or country; and third, by continent. The data in the current study was organized for seven continents, separately[26].
4.10.1 Asian Data Files
The Asian boundary[27] in this dataset is as follows: it is separated from Europe[28] in the Arctic Kara River estuary in Russia (69°15′45.21″N, 65°1′58.37″E) (Figure 11); and separated from North America[29] at the Bering Strait, with the boundary line between the Big Diomede Island located in Russia and Little Diomede Island in the United States (Figure 12). It passes through the Aleutian Islands[30–31] (boundary line between the Medny Island in Russia and the Attu Island in the United States) and the oceanic trench in the eastern Japan (the boundary line between the Nantoku Island at east of Ogasawara Islands and the Wake Island in the United States), and then bends southwest at the south of Ogasawara Islands.
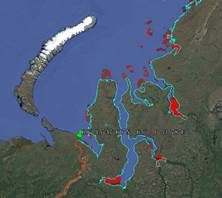
Figure 11 Europe-Asia boundary in the Russian Kara River estuary (69°15′45.21″N, 65°1′58.37″E)
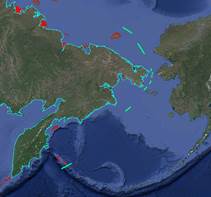
Figure 12 Asia and North America boundary separated by Big Diomede Island (Russia) and Little Diomede Island (America) in the Bering Strait
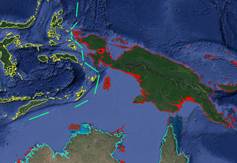
Figure 13 Boundary between Asia and Oceania
The boundary between Asia and Oceania is found on the east of Pulau Sajang and Pulau Gag in Indonesia, and the west of Aru Islands[33], and runs across the Alafra Sea and the Timor Sea
(Figure 13). The boundary between Asia and Africa is the New Suez Canal. The boundary between Asia and Europe is the Turkey’s Dardanelles and the Bosporus Strait. On the north of the Black Sea, the Asia shoreline meets the European coast near the city of Gyachrypsh at the border between Russia and Georgia. On land, Eurasia is bounded by the Ural Mountains, the Ural River, the Caspian Sea and the Greater Caucasus Mountains[6].
The shoreline data of the Asian mainland and the corresponding island data are archived in two different data files, namely the shoreline data of northern and northeastern Asia and the corresponding islands (isles, rocks)[34–58] data are AS_C1_shoreline_m_gg_2015.kmz and AS_I1_shoreline_m_gg_2015.kmz, respectively. The east, south and west coast of Asia are contained in a data file named as_C2_shoreline_m_gg_2015.kmz, and the corresponding island[59–77] data is AS_I2_shoreline_m_gg_2015.kmz. Southeast Asia consists entirely of island data[78–86] with the file name AS_I3_shoreline_m_gg_2015.kmz. The compressed Asian shoreline shp format data file is AS_C_shoreline_m_gg_2015.shp.rar, and the island data file is AS_I_shoreline_m_gg_2015.shp.rar.
4.10.2 European Data Files
Europe is divided from Africa by the Strait of Gibraltar in southern Spain. The southern most of the Europe is the Canary Islands in Spain. The northern most includes Iceland, the Svalbard Archiepelago, and Franz Josef Land. The European mainland shoreline is archived in two data files, EU_C1_shoreline_m_gg_2015, and EU_C2_shoreline_m_gg_2015.
Due to the large number of small European islands, these islands are stored in six data files from south to north. Islands on the eastern, southern, and western sides of the European continent (the mouth and south of the Seine River in France)[87–95] are stored in the EU_I1_shoreline_m_gg_2015 data file, covering the Black Sea, the Sea of Azov, the Mediterranean, and the Atlantic coast. The EU_I2_shoreline_m_gg_2015 data file covers the area from the Seine estuary eastward to the islands off the Szczecin Lagoon between Germany and Poland, the United Kingdom, Ireland, and Iceland[96–105]. The EU_I3_shoreline_m_ gg_2015 data covered areas from the Shcheching Lagoon eastward along the mainland to the islands near Bori, Finland[106]. The data is stored in the EU_I4_shoreline_m_gg_2015 data file from the islands[107–108] that run north from Bori Finland to the southernmost coast of Sweden. EU_I5_shoreline_m_gg_2015 data file contains information for the coastal islands from the southernmost part of Sweden westward and northward along the continent to the Horn Skinn off the west coast of Norway. The EU_I6_shoreline_m_gg_2015 data file covers the area from the coast of the mainland north near Horn Skinn to the islands along the mouth of the Kara River in Russia, including Svalbard, Yucey, Severne, and Georges Di in the Arctic Ocean.
4.10.3 African Data Files
The data organization for Africa is relatively simple. Both the continental shoreline data and the island shoreline data[111–115] are archived in a single data file. They are: AF_C_shoreline_
Figure 15 Saint Helena, Tristan da Cunha islands is archived in the Africa data files
m_ gg_2015.kmz, AF_I_shoreline_m_ gg_2015.kmz, AF_I_shoreline_m_gg_2015shp.rar, and AF_C_shoreline_m_gg_2015shp.rar. The boundary between Africa and Asia is at the new Suez Canal[116], and the boundary with Europe is at the Mediterranean Sea and the Strait of Gibraltar (Figure 14). It should be noted that the data from the Tristan da Cunha islands in the south Atlantic, located in Saint Helena[117–118], a British territory, 2,600 km from the west coast of Africa and 3,400 km from the east coast of South America, are archived in the African data file (Figure 15).
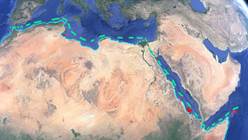
Figure 14 Boundary between Africa and Europe and Asia in data organization
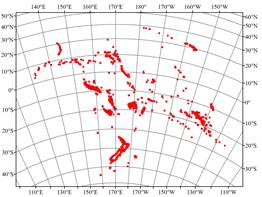
Figure 16 Covered islands in the data file of OA_I2_shoreline_m_gg_2015 (16,000 km in west-east direction, 13,000 km in north-south direction)
4.10.4 Oceania Data Files
Oceania spans relatively large geographical latitude, and includes all islands located in most of the north and south Pacific[119–122]. The islands of the continent include all the northernmost Hawaiian Islands, the Mariana Islands to the northwest, the Palau Islands to the west, and the Antarctic Islands to the south at latitude 60°S and the South American Islands to the east at longitude 120°W (Figure 16). The continental shoreline data if archived in one file OA_C_shoreline_m_gg_2015. Oceania is archived in two files: OA_I1_shoreline_m_gg_2015, and OA_I2_shoreline_m_gg_2015.
4.10.5 North AmericanData Files
North America, the continent with the most island data in the world[123–125], is bounded by the Panama Canal, separated from the South America (Figure 17). The shoreline of North America is archived in eight data files. In addition to the corresponding islands, Baffin Island and its adjacent islands and Greenland and its adjacent islands are archived in the ninth and tenth data files respectively.
The areas covered by the data files for the North American continental shoreline and islands are: NA_C1_shoreline_m_gg_2015, and NA_I1_shoreline_m_gg_2015, which include the data-covered area starting from the mouth of the Nartash Kun River in northeast North America, and proceeding southbound along the continental shoreline, all the way to the Shark River estuary. For NA_C2_shoreline_m_gg_2015 and NA_I2_shoreline_m_gg_2015, the data covered areas are from the mouth of the Shark River, south along the coast to Rose Bay on the east coast of Florida. NA_C3_shoreline_m_gg_2015, and
NA_I3_shoreline_ m_gg_2015 are from Rose Bay southbound along the coast to near New Orleans on the northern side of the Gulf of Mexico. The NA_C4_shoreline_m_gg_2015, and
NA_I4_shoreline_m_gg_2015 data covered areas are from the coast near New Orleans westward to an estuary near EL Tordo on Mexico’s east coast.

Figure 17 Panama Canal as the North and South America boundary
The NA_C5_shoreline_m_gg_2015, and NA_I5_shoreline_m_gg_2015 data covers the area from near El Tordo southbound along the continental shoreline to the northern end of the Panama Canal. For NA_C6_shoreline_ m_gg_2015, and NA_I6_shoreline_m_ gg_2015, the data covers areas from the northern end of the Panama Canal southbound along the main shoreline to Iniskin Bay on the northwest coast of Canada. The NA_C7_shoreline_m_gg_ 2015 and NA_I7_shoreline_m_gg_2015 data covers areas from Iniskin Bay westward along the continental shoreline to the northern end of the Melville Peninsula in Canada. The NA_C8_shoreline_m_gg_2015 and NA_I8_shoreline_m_gg_ 2015 data covers areas from the northern end of the Melville Peninsula eastward along the continental shoreline to the mouth of the Natashekum River.
4.10.6 South American Data Files
The data for the continental shoreline and islands of South America[126–129] are divided into eastern, western and southern data, which are stored in three data files. The SA_C1_shoreline_ m_gg_2015 and SA_I1_shoreline_m_gg_2015 data covers areas from the northern end of the Panama Canal eastward along the continental shoreline, up to approximately 47°S of the east coast of the continent. The data coverage area of SA_C2_shoreline_m_gg_2015 and SA_I2_shoreline_m_gg_2015 is from the region of 47°S on the east coast of the mainland to the region of 47°S on the west coast of the mainland. The SA_C3_shoreline_m_gg_2015, SA_I3_shoreline_m_gg_2015 data coverage area is from the western coast of the mainland near 47°S, all the way to the northern end of the Panama Canal.
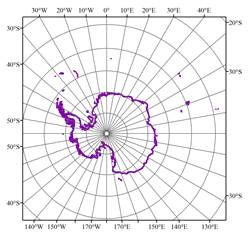
Figure 18 Covered area of Antarctica data files
4.10.7 Antarctic Data Files
The Antarctic data are stored in the AN_C_shoreline_m_gg_2015 and AN_I_ shoreline_m_gg_2015 data files. It should be noted that the Antarctic data not only cover areas south of latitude 60°S, they also include South Georgia and the South Sandwich Islands[130], French southern and Antarctic lands[131], Heard Island and McDonald Islands[132], Bouvet Island, Norwegian Antarctic territory)[133] and other islands (Figure 18).
4.11 Codes for Each Island (Isle, Rock)
The codes for islands (isles, rocks) are divided into three groups as follows: The first code for islands (isles, rocks) in each data file is coded in sequence from south to north. The second code is performed for each continent, in the sequence of data files. The third code is the order in the global island (isles, rocks), in the sequence of continents according to the alphabetical order of their abbreviation name, with Antarctica being assigned to the last.
4.12 Projection and Parameters
The statistics of the “Global multiple scale shorelines dataset based on Google Earth images (2015)” (meters resolution) were performed according to the spatial data. The main statistical parameters are the shoreline length and area for each continental mainland and island (isle, rock). The shoreline length is calculated under the lambert_Conformal_Conic projection, while the area is calculated under the Albers_Equal_Area_Conic projection. The projection parameters for each continent are shown in Table 4. The area of Antarctica is calculated using the Lambert_Azimuthal_Equal_Area projection and the shoreline length is calculated using the Lambert_Conformal_Conic projection[134].
Table 4 Projection parameters for calculating areas and shoreline length of each continent
|
Continent
|
Shoreline length calculation
|
|
Area calculation
|
|
Projection
|
Central meridian
|
Double standard parallel
|
|
Projection
|
Central meridian
|
Double standard parallel
|
|
Asia
|
Lambert_
Conformal_Conic
|
85ºE
|
23ºN/53ºN
|
|
Albers_ Equal_Area_Conic
|
85ºE
|
23ºN/53ºN
|
|
Europe
|
Lambert_
Conformal_Conic
|
20ºE
|
48ºN/62ºN
|
|
Albers_ Equal_Area_Conic
|
20ºE
|
48ºN/62ºN
|
|
Africa
|
Lambert_
Conformal_Conic
|
19.5ºE
|
7ºS/20ºN
|
|
Albers_ Equal_Area_Conic
|
19.5ºE
|
7ºS/20ºN
|
|
North America
|
Lambert_
Conformal_Conic
|
101ºW
|
35ºN/56ºN
|
|
Albers_ Equal_Area_Conic
|
101ºW
|
35ºN/56ºN
|
|
South America
|
Lambert_
Conformal_Conic
|
60ºW
|
3ºS/23.5ºS
|
|
Albers_ Equal_Area_Conic
|
60ºW
|
3ºS/23.5ºS
|
|
Oceania
|
Lambert_
Conformal_Conic
|
170ºE
|
17ºS/34ºS
|
|
Albers_ Equal_Area_Conic
|
170ºE
|
17ºS/34ºS
|
|
Antarctica
|
Lambert_
Conformal_Conic
|
80ºE
|
75ºS/82ºS
|
|
Lambert_ Azimuthal_ Equal_Area
|
0º
|
–
|
4.13 Total Data Files
The “Global multiple scale shorelines dataset based on Google Earth images (2015)” (meters resolution) is composed of three data formats. The .kmz data consists of linear spatial data and attribute data for continental mainland and islands (isles, rocks); while .shp.rar includes the linear and planar spatial data and corresponding attribute data in the ArcGIS software. The dataset also includes a statistical table in the format of .xlsx, totaling 61 documents. The name, size, and affiliation for each data file are shown in Table 5.
4.14 Attribute Data
In addition to the spatial data with meters resolution for continental mainland and islands (isles, rocks), the data also include the corresponding attribute data (Table 6). The attribute data include the codes for each island (isle, rock) including the code in each data file, the code in each continent, and the code in the global islands (isles, rocks), the shoreline length in the Lambert projection, and the area in the Albers projection. Using the Hawaiian Island of the United States as an example (Figure 19), data of the Island are archived in the data file of OA_I2_shoreline_m_gg_2015 in the .kmz and .shp formats. The attributes of the Island include the code of the Island in the data file of OA_I2_shoreline_m_ gg_2015 as 7,998, the area as 10,432,046,089 m2, the shoreline length as 821,973 m, its affiliation as in Oceania, the code in Oceania as 24,882, the code in the world as 604,138, and its classification as class C as its area being between10,000 and 100,000 km2 (Table 2).
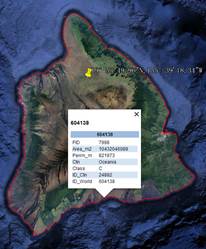
Figure 19 Visual map of Hawaii Island
Table 5 Data files of the “Global multiple scale shorelines dataset based on Google
Earth images (2015)” (meters resolution)
|
No.
|
File name
|
Data size
(MB)
|
Continent
|
No.
|
File name
|
Data size
(MB)
|
Continent
|
|
1
|
AF_C_shoreline_m_gg_2015.kmz
|
51.60
|
Africa
|
32
|
NA_C5_shoreline_m_gg_2015.kmz
|
54.39
|
North America
|
|
2
|
AF_C_shoreline_m_gg_2015shp.rar
|
45.40
|
Africa
|
33
|
NA_C6_shoreline_m_gg_2015.kmz
|
68.40
|
North America
|
|
3
|
AF_I_shoreline_m_gg_2015.kmz
|
84.00
|
Africa
|
34
|
NA_C7_shoreline_m_gg_2015.kmz
|
320.00
|
North America
|
|
4
|
AF_I_shoreline_m_gg_2015shp.rar
|
102.00
|
Africa
|
35
|
NA_C8_shoreline_m_gg_2015.kmz
|
358.48
|
North America
|
|
5
|
AN_C_shoreline_m_gg_2015.kmz
|
5.30
|
Antarctica
|
36
|
NA_I_shoreline_m_gg_2015shp_1.rar
|
54.80
|
North America
|
|
6
|
AN_C_shoreline_m_gg_2015shp.rar
|
3.60
|
Antarctica
|
37
|
NA_I_shoreline_m_gg_2015shp_2.rar
|
71.92
|
North America
|
|
7
|
AN_I_shoreline_m_gg_2015.kmz
|
29.90
|
Antarctica
|
38
|
NA_I1_shoreline_m_gg_2015.kmz
|
74.50
|
North America
|
|
8
|
AN_I_shoreline_m_gg_2015shp.rar
|
51.10
|
Antarctica
|
39
|
NA_I2_shoreline_m_gg_2015.kmz
|
76.48
|
North America
|
|
9
|
AS_C_shoreline_m_gg_2015shp.rar
|
60.35
|
Asia
|
40
|
NA_I3_shoreline_m_gg_2015.kmz
|
60.22
|
North America
|
|
10
|
AS_C1_shoreline_m_gg_2015.kmz
|
32.86
|
Asia
|
41
|
NA_I4_shoreline_m_gg_2015.kmz
|
151.00
|
North America
|
|
11
|
AS_C2_shoreline_m_gg_2015.kmz
|
35.10
|
Asia
|
42
|
NA_I5_shoreline_m_gg_2015.kmz
|
23.40
|
North America
|
|
12
|
AS_I_shoreline_m_gg_2015shp.rar
|
395.00
|
Asia
|
43
|
NA_I6_shoreline_m_gg_2015.kmz
|
18.10
|
North America
|
|
13
|
AS_I1_shoreline_m_gg_2015.kmz
|
66.80
|
Asia
|
44
|
NA_I7_shoreline_m_gg_2015.kmz
|
18.10
|
North America
|
|
14
|
AS_I2_shoreline_m_gg_2015.kmz
|
78.90
|
Asia
|
45
|
NA_I8_shoreline_m_gg_2015.kmz
|
8.08
|
North America
|
|
15
|
AS_I3_shoreline_m_gg_2015.kmz
|
77.10
|
Asia
|
46
|
NA_I9_shoreline_m_gg_2015.kmz
|
46.10
|
North America
|
|
16
|
EU_C_shoreline_m_gg_2015shp.rar
|
107.00
|
Europe
|
47
|
NA_IA_shoreline_m_gg_2015.kmz
|
63.60
|
North America
|
|
17
|
EU_C1_shoreline_m_gg_2015.kmz
|
54.39
|
Europe
|
48
|
OA_C_shoreline_m_gg_2015.kmz
|
28.90
|
Oceania
|
|
18
|
EU_C2_shoreline_m_gg_2015.kmz
|
68.40
|
Europe
|
49
|
OA_C_shoreline_m_gg_2015shp.rar
|
25.00
|
Oceania
|
|
19
|
EU_I_shoreline_m_gg_2015shp_1.rar
|
320.00
|
Europe
|
50
|
OA_I_shoreline_m_gg_2015shp.rar
|
211.00
|
Oceania
|
|
20
|
EU_I_shoreline_m_gg_2015shp_2.rar
|
358.48
|
Europe
|
51
|
OA_I1_shoreline_m_gg_2015.kmz
|
61.70
|
Oceania
|
|
21
|
EU_I1_shoreline_m_gg_2015.kmz
|
54.80
|
Europe
|
52
|
OA_I2_shoreline_m_gg_2015.kmz
|
65.30
|
Oceania
|
|
23
|
EU_I3_shoreline_m_gg_2015.kmz
|
71.92
|
Europe
|
54
|
SA_C1_shoreline_m_gg_2015.kmz
|
34.00
|
South America
|
|
24
|
EU_I4_shoreline_m_gg_2015.kmz
|
74.50
|
Europe
|
55
|
SA_C2_shoreline_m_gg_2015.kmz
|
8.38
|
South America
|
|
25
|
EU_I5_shoreline_m_gg_2015.kmz
|
76.48
|
Europe
|
56
|
SA_C3_shoreline_m_gg_2015.kmz
|
17.23
|
South America
|
|
26
|
EU_I6_shoreline_m_gg_2015.kmz
|
60.22
|
Europe
|
57
|
SA_I_shoreline_m_gg_2015shp.rar
|
161.00
|
South America
|
|
27
|
NA_C_shoreline_m_gg_2015shp.rar
|
151.00
|
North America
|
58
|
SA_I1_shoreline_m_gg_2015.kmz
|
29.33
|
South America
|
|
28
|
NA_C1_shoreline_m_gg_2015.kmz
|
23.40
|
North America
|
59
|
SA_I2_shoreline_m_gg_2015.kmz
|
44.10
|
South America
|
|
29
|
NA_C2_shoreline_m_gg_2015.kmz
|
18.10
|
North America
|
60
|
SA_I3_shoreline_m_gg_2015.kmz
|
25.10
|
South America
|
|
30
|
NA_C3_shoreline_m_gg_2015.kmz
|
18.10
|
North America
|
61
|
Global_Shoreline_m_2015.xlsx
|
0.04
|
Global
|
|
31
|
NA_C4_shoreline_m_gg_2015.kmz
|
8.08
|
North America
|
Total
|
4.97 GB
|
Table 6 Data attributes of the islands (isles, rocks) in Oceania
|
FID
|
Shape
|
Area_m2
|
Perim_m
|
Ctn
|
Class
|
ID_Ctn
|
ID_World
|
|
0
|
Polygon
|
193,335
|
2,351
|
Oceania
|
J
|
1
|
579,257
|
|
1
|
Polygon
|
3,1123
|
789
|
Oceania
|
J
|
2
|
579,258
|
|
2
|
Polygon
|
1,858
|
172
|
Oceania
|
J
|
3
|
579,259
|
|
3
|
Polygon
|
36,187
|
833
|
Oceania
|
J
|
4
|
579,260
|
|
4
|
Polygon
|
5,921
|
329
|
Oceania
|
J
|
5
|
579,261
|
|
…
|
…
|
…
|
…
|
…
|
…
|
…
|
…
|
5 Results
Based on Google Earth images, the vector data of global shorelines in 2015 were obtained. The data quality in spatial resolution is controlled within meters (less than 10 m), that is, the error of most data is controlled within 10 m (Figure 20).
5.1 The Total Area and Shoreline Length of Continents (Including Continental Mainland and Islands/Isles/Rocks) in 2015
In 2015, the global land area (including continental mainland and islands/isles/rocks) was 147,493,462.77 km2. Among the seven continents, Asia was the largest, with an area of 44,127,508.86 km2, accounting for 29.91% of the global continental area; Asia is followed by Africa, North America, South America, Antarctica, Europe, and Oceania (Table 7). The total length of the global shoreline in 2015 is 2,500,752.85 km.
|
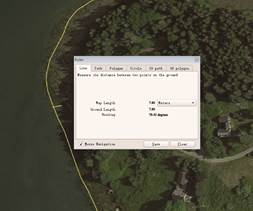
Figure 20 Data quality check based on Google Earth remote sensing image
|
Among the continents, the longest shoreline is found in North America, with a length of 875,242.66 km, accounting for 34.99% of the total length of the global shorelines, followed by Asia, Europe, South America, Oceania, Africa, and Antarctica. In terms of shoreline length per unit area, Europe and North America have the most advantages. The shoreline length per square kilometer of Europe is 38.22 m, which is 9.39 times that of Africa, and that of North America is 36.10 m, which is 8.89 times that of Africa (Table 7).
Table 7 Total area and shoreline length of each continent (including mainland and islands/isles/rocks) in 2015 (meters resolution)
|
Continent
|
Area
(km2)
|
Percentage in global land (%)
|
Shoreline length (km)
|
Percentage in global shoreline (%)
|
Shoreline length of 1 km2 of land (m)
|
|
Asia
|
44,127,508.85
|
29.91
|
587,803.99
|
23.51
|
13.32
|
|
Africa
|
29,834,614.26
|
20.23
|
121,545.74
|
4.86
|
4.07
|
|
North America
|
24,243,886.75
|
16.44
|
875,242.66
|
34.99
|
36.10
|
|
South America
|
17,741,013.97
|
12.03
|
250,230.74
|
10.01
|
14.10
|
|
Antarctica
|
12,610,490.93
|
8.55
|
82,305.88
|
3.29
|
6.53
|
|
Europe
|
9,996,090.89
|
6.78
|
382,001.76
|
15.28
|
38.22
|
|
Oceania
|
8,939,857.13
|
6.06
|
201,622.08
|
8.06
|
22.55
|
|
Total
|
147,493,462.77
|
100
|
2,500,752.85
|
100
|
16.96
|
5.2 Area and ShorelineLength of Continental Mainland in 2015
The total area of the global continental mainland in 2015 is 137,126,029.55 km2. Among the seven continents, Asia is the largest, with an area of 41,234,168.60 km2, accounting for 30.06% of the continental mainland in the world. Asia is followed by Africa (29,189,942.52 km2), North America (20,057,916.19 km2), South America (17,493,885.42 km2), Antarctica (12,390,426.79 km2), Europe (9,170,674.02 km2) and Oceania (7,589,016.01 km2) (Table 8).
The total shoreline length of global continental mainland in 2015 is 734,739.56 km. Among the continents, the longest shoreline is found in North America, which is 219,833.47 km, accounting for 29.92% of the total continental shoreline, followed by Asia (165,098.66 km), Europe (109,658.76 km), South America (89,606.69 km), Africa (59,665.53 km), Oceania (47,408.52 km), and Antarctica (43,467.93 km) (Table 8).
In terms of shoreline length per unit area, Europe and North America have the most advantages. The shoreline length of Europe per square kilometer is 11.96 m, which is 5.86 times that of Africa and 2.99 times that of Asia. North America followed, with a shoreline of 10.96 m per square kilometer. The smallest is Africa, with a shoreline of only 2.04 m per square kilometer (Table 8).
Table 8 Area and shoreline length for each mainland of seven continents in 2015 (meters resolution)
|
Continent
|
Area
(km2)
|
Percentage in global land (%)
|
Shoreline length (km)
|
Percentage in global shoreline (%)
|
Shoreline length of 1 km2 of land (m)
|
|
Asia
|
41,234,168.60
|
30.06
|
165,098.66
|
22.47
|
4.00
|
|
Africa
|
29,189,942.52
|
21.29
|
59,665.53
|
8.12
|
2.04
|
|
North America
|
20,057,916.19
|
14.63
|
219,833.47
|
29.92
|
10.96
|
|
South America
|
17,493,885.42
|
12.76
|
89,606.69
|
12.20
|
5.12
|
|
Antarctica
|
12,390,426.79
|
9.04
|
43,467.93
|
5.92
|
3.51
|
|
Europe
|
9,170,674.02
|
6.69
|
109,658.76
|
14.92
|
11.96
|
|
Oceania
|
7,589,016.01
|
5.53
|
47,408.52
|
6.45
|
6.25
|
|
Total
|
137,126,029.55
|
100
|
734,739.56
|
100
|
5.36
|
5.3 Statistics on Global Islands (Isles, Rocks) in 2015
In 2015, there were 656,850 islands (isles,rocks) with area larger than 6 m2 in the world, among which 28,263were larger than 1 km2 (Table 10), accounting for only 4.30% of the total number of islands (isles,rocks) in the world. Among all continents, North America has the largest number of islands (isles, rocks), 271,128, accounting for 41.27% of the total number of islands (isles, rocks) in the world. It also has the largest area, at 4,185,970.55 km2, which accounts for 40.38% of the total area of the world’s islands (isles, rocks).
The total shoreline length of the global islands (isles,rocks) is 1,766,013.29 km, among which the North American shoreline is the longest, at 655,409.19 km, accounting for 37.11% of the total shoreline length of the global islands (isles,rocks). North America is followed by Asia, Europe, South America, Oceania, Africa, and Antarctica. In terms of the shoreline length of unit island (isles, rocks) area, South America is the most prominent, with a shoreline length of 649.96m per square kilometer, which is 1.97 times that of the second largest one, Europe, 4.15 times that of North America, and 4.45 times that of Asia (Table 9). These data are in good agreement with the rather tortuous geography of the island shoreline of southwest South America, which is unique not only for the coastal geography of Chile but also for the geographic distribution of the world’s islands(isles, rocks).
5.4 Statistics on Different Size ofGlobal Islands (Isles, Rocks) in 2015
|

Figure 21 Area percentage of nine islands with area larger than 2×10⁵ km2 in the total area of global islands(isles, rocks) in 2015
|
A total of 95.69% of the world’s islands (isles, rocks) has an area less than 1 km2, while only 28,263 islands have an area greater than 1 km2, accounting for 4.3% of the total number of islands (isles, rocks) in the world (Table 10). However, their area accounts for 99.76% of the total area of the world’s islands (isles, rocks), especially the nine largest islands with an area of more than 200,000 km2, which accounts for more than half of the total area of the world’s islands (isles, rocks) (55.83%, Figure 21). The area of the nine largest islands is as follows: Greenland (2,112,450.44 km2), New Guinea (767,344.84 km2), Kalimantan (718,952.47 km2), Madagascar (589,008.75 km2), Baffin (509,509.23 km2), Sumatra (424,668.94 km2), Honshu (227,283.45 km2), Victoria (220,659.87 km2), and Great Britain (219,126.19 km2), The area of each island accounts for 20.38%, 7.40%, 6.93%, 5.68%, 4.91%, 4.10%, 2.19%, 2.13%, and 2.11% of the total area of global islands (isles, rocks), respectively,.
Table 9 Number, area, and shoreline length of islands (isles, rocks) in each continent in 2015
(meters resolution)
|
Continent
|
Number of islands
|
Percentage in global islands (%)
|
Area
of islands
(km2)
|
Percentage in global island area (%)
|
Shoreline length
(km)
|
Percentage in global islands shoreline (%)
|
Shoreline length of 1 km2 of island area (m)
|
|
North America
|
271,128
|
41.27
|
4,185,970.55
|
40.38
|
655,409.19
|
37.11
|
156.57
|
|
Europe
|
239,440
|
36.45
|
825,416.87
|
7.96
|
272,343.00
|
15.42
|
329.95
|
|
Asia
|
55,427
|
8.44
|
2,893,340.25
|
27.91
|
422,705.33
|
23.94
|
146.10
|
|
South America
|
45,387
|
6.91
|
247,128.55
|
2.38
|
160,624.05
|
9.10
|
649.96
|
|
Oceania
|
24,999
|
3.81
|
1,350,841.12
|
13.03
|
154,213.56
|
8.73
|
114.16
|
|
Africa
|
11,287
|
1.72
|
644,671.74
|
6.22
|
61,880.21
|
3.50
|
95.99
|
|
Antarctica
|
9,182
|
1.40
|
220,064.14
|
2.12
|
38,837.95
|
2.20
|
176.48
|
|
Total
|
656,850
|
100
|
10,367,433.22
|
100
|
1,766,013.29
|
100
|
170.34
|
Table 10 Number, shoreline length, and area of global islands (isles, rocks) by area classification in 2015 (meters resolution)
|
Island
classification
|
Number
of islands
|
Percentage in global islands (%)
|
Shoreline length
(km)
|
Percentage in global islands shoreline (%)
|
Area
of islands
(km2)
|
Percentage in global islands area (%)
|
|
A
|
9
|
0.00
|
185,469.53
|
10.50
|
5,789,004.17
|
55.83
|
|
B
|
9
|
0.00
|
78,547.61
|
4.45
|
1,179,693.91
|
11.38
|
|
C
|
59
|
0.01
|
148,801.48
|
8.43
|
1,817,482.92
|
17.53
|
|
D
|
43
|
0.01
|
47,608.11
|
2.70
|
302,594.58
|
2.92
|
|
E
|
237
|
0.04
|
123,812.27
|
7.01
|
522,343.47
|
5.04
|
|
F
|
1,601
|
0.24
|
247,113.91
|
13.99
|
457,496.27
|
4.41
|
|
G
|
1,219
|
0.19
|
86,864.41
|
4.92
|
86,628.57
|
0.84
|
|
H
|
5,553
|
0.85
|
201,255.22
|
11.40
|
124,343.74
|
1.20
|
|
I
|
19,533
|
2.97
|
237,303.92
|
13.44
|
62,788.85
|
0.61
|
|
J
|
628,587
|
95.69
|
409,236.84
|
23.16
|
25,056.75
|
0.24
|
|
Total
|
656,850
|
100
|
1,766,013.29
|
100
|
10,367,433.22
|
100
|
Note: A≥200,000; 200,000>B≥100,000; 100,000>C≥10,000; 10,000>D≥5,000; 5,000>E≥1,000; 1,000>F≥100; 100>G≥50; 50>H≥10; 10>I≥1; 1>J (km2).
5.5 Statistics on Different Size of Islands (Isles, Rocks) for Each Continent
5.5.1 Number, Shoreline Length,and Area for Different Size of Islands (Isles, Rocks) in Africa
Statistics on the number, shoreline length, and area for different size of African islands (isles, rocks) are shown in Table 11. Except for Madagascar, which is the fourth largest island in the world (area >200,000 km2) and is classified as a class A island, there is no island with an area of more than 5,000 km2 in Africa. Among them, 9,649 islands (isles, rocks), accounting for 85.49% of the total number of African islands (isles, rocks), have an individual area of less than 1 km2. However, from the perspective of the total length of shoreline, the difference between different types of islands (isles, rocks) is not significant.
5.5.2 Number, Shoreline Length,and Area forDifferent Size of Islands (Isles, Rocks) in Asia
Statistics on the number, shoreline length, and area for different size of islands (isles, rocks) in Asia are shown in Table 12. There are three islands with an area of more than 200,000 km2 in Asia, 29 islands with an area of more than 10,000 km2, and 8,125 islands with an area of more than 1 km2, accounting for 27.87% of the total area of islands (isles, rocks) in the world. Asia has the largest number of greatest islands among seven continents. There is little difference in the proportion of shorelines among different size of Asian islands (isles, rocks).
Table 11 Number, shoreline length, and area of islands in Africa by area classification in 2015
|
Island
classification
|
Number
of islands
|
Percentage in total islands (%)
|
Shoreline
length
(km)
|
Percentage in total islands shoreline (%)
|
Area
of islands
(km2)
|
Percentage in total islands area (%)
|
|
A
|
1
|
0.008,9
|
11,621.21
|
18.78
|
589,008.75
|
91.36
|
|
B
|
0
|
0.000,0
|
0.00
|
0.00
|
0.00
|
0.00
|
|
C
|
0
|
0.000,0
|
0.00
|
0.00
|
0.00
|
0.00
|
|
D
|
0
|
0.000,0
|
0.00
|
0.00
|
0.00
|
0.00
|
|
E
|
8
|
0.070,9
|
2,442.09
|
3.95
|
15,061.32
|
2.34
|
|
F
|
83
|
0.735,4
|
10,097.03
|
16.32
|
21,465.18
|
3.33
|
|
G
|
81
|
0.717,6
|
4,826.28
|
7.80
|
5,797.37
|
0.90
|
|
H
|
383
|
3.393,3
|
11,602.47
|
18.75
|
8,693.17
|
1.35
|
|
I
|
1,082
|
9.586,2
|
11,598.97
|
18.74
|
3,859.20
|
0.60
|
|
J
|
9,649
|
85.487,7
|
9,692.16
|
15.66
|
786.75
|
0.12
|
|
Total
|
11,287
|
100
|
61,880.21
|
100
|
644,671.74
|
100
|
Note: A≥200,000; 200,000>B≥100,000; 100,000>C≥10,000; 10,000>D≥5,000; 5,000>E≥1,000; 1,000>F≥100; 100>G≥50; 50>H≥10; 10>I≥1; 1>J (km2).
Table 12Number, shoreline length, and area of islands in Asia by area classification in 2015
|
Island
classification
|
Number
of islands
|
Percentage in total islands (%)
|
Shoreline
length
(km)
|
Percentage in total islands shoreline (%)
|
Area
of islands
(km2)
|
Percentage in total islands area (%)
|
|
A
|
3
|
0.005,4
|
40,735.67
|
9.64
|
1,370,904.86
|
47.39
|
|
B
|
3
|
0.005,4
|
21,035.94
|
4.98
|
400,233.26
|
13.83
|
|
C
|
23
|
0.041,5
|
50,873.93
|
12.04
|
660,580.94
|
22.83
|
|
D
|
11
|
0.019,8
|
9,722.95
|
2.30
|
81,292.40
|
2.81
|
|
E
|
70
|
0.126,3
|
29,123.11
|
6.89
|
150,419.46
|
5.20
|
|
F
|
478
|
0.862,4
|
66,015.73
|
15.62
|
133,202.37
|
4.60
|
|
G
|
426
|
0.768,6
|
27,926.58
|
6.61
|
30,252.90
|
1.05
|
|
H
|
1,954
|
3.525,4
|
66,365.59
|
15.68
|
44,625.45
|
1.54
|
|
I
|
5,157
|
9.304,1
|
59,143.91
|
13.99
|
17,774.72
|
0.61
|
|
J
|
47,302
|
85.341,1
|
51,761.92
|
12.25
|
4,053.90
|
0.14
|
|
Total
|
55,427
|
100
|
422,705.33
|
100
|
2,893,340.25
|
100
|
Note: A≥200,000; 200,000>B≥100,000; 100,000>C≥10,000; 10,000>D≥5,000; 5,000>E≥1,000; 1,000>F≥100; 100>G≥50; 50>H≥10; 10>I≥1; 1>J (km2).
5.5.3 Number, Shoreline Length,and Area for Different Size of Islands (Isles, Rocks) in Oceania
Statistics on the number, shoreline length, and area for different size of islands (isles, rocks) in Oceania are shown in Table 13. In addition to one island with an area of more than 200,000 km2, there are eight islands with an area of more than 10,000 km2, and 2,641 islands with an area of more than 1 km2, accounting for 10.56% of the total number of islands (isles, rocks) in Oceania. There is little difference in shoreline length among different island groups.
5.5.4 Number, Shoreline Length,and Area for Different Size of Islands (Isles, Rocks) in Europe
Statistics on the number, area, and shorelines length for various types of European islands (isles, rocks) are shown in Table 14. In addition to one island with an area of more than 200,000 km2, there are 10 islands with an area of more than 10,000 km2 and 3,384 islands with an area of more than 1km2, accounting for 1.41% of the total number of European islands(isles, rocks). Europe is one of the continents with the largest distribution of small islands(isles, rocks). The numerous small islands (isles, rocks)near the mainland shoreline constitute a unique islands landscape (Figure 22).
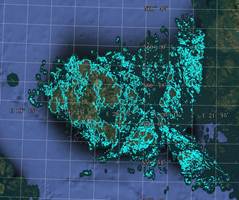
Figure 22 Oran Islands, located in the southwestern corner of Finland, consisting of 13,161 islands (isles, rocks) with an area greater than 7 m2, of which 6,450 islands (isles, rocks) with an area larger than 2,500 m2 and 104 islands with an area larger than 1 km2.
5.5.5 Number, Shoreline Length,and Area for Different Size of Islands (Isles, Rocks) in North American
Statistics on the number, shoreline length, and area of various types of islands (isles, rocks) in North America are shown in Table 15. In addition to the three islands with an area of more than 200,000 km2 listed as class A, there are 19 islands with an area of more than 10,000 km2. North America has the largest number of islands with an area of more than 10,000 km2 in the world. There are 9,150 islands in North America with an area of more than 1 km2, accounting for only 3.37% of the total number of islands in North America.
5.5.6 Number, Shoreline Length,and Area for Different Size of Islands (Isles, Rocks) in South America
Statistics on the number, shoreline length, and area of various types of islands (isles, rocks) in South America are shown in Table 16. As can be seen from the table, there is no island classified as class A or class B in South America. Only two islands have an area of more than 10,000 km2, and 2,799 islands have an area of more than 1 km2, accounting for 6.17% of the total number of islands (isles, rocks) in South America. There is little difference in shoreline length between different island groups.
5.5.7 Number, Shoreline Length,and Area forDifferent Size of Islands (Isles, Rocks) in Antarctic
Statistics on the number, shoreline length, and area of Antarctica’s various types of islands (isles, rocks) are shown in Table 17. There is no island classified as class A or class B in Antarctica. Only three islands have an area of more than 10,000 km2, and 526 islands have an area of more than 1 km2, accounting for 5.73% of the total number of islands (isles, rocks) in Antarctica.
Table 13 Number, shoreline length, and area of islands in Oceania by area classification in 2015
|
Island
classification
|
Number
of islands
|
Percentage in total islands (%)
|
Shoreline
length
(km)
|
Percentage in total islands shoreline (%)
|
Area
of islands
(km2)
|
Percentage in total islands area (%)
|
|
A
|
1
|
0.004,0
|
19,140.19
|
12.41
|
767,344.84
|
56.79
|
|
B
|
2
|
0.008,0
|
14,380.32
|
9.32
|
264,449.20
|
19.58
|
|
C
|
6
|
0.024,0
|
10,737.40
|
6.96
|
148,738.34
|
11.01
|
|
D
|
4
|
0.016,0
|
3,377.91
|
2.19
|
26,819.82
|
1.99
|
|
E
|
34
|
0.136,0
|
16,405.24
|
10.64
|
72,491.72
|
5.37
|
|
F
|
146
|
0.584,0
|
20,695.01
|
13.42
|
43,907.61
|
3.25
|
|
G
|
110
|
0.440,0
|
6,915.08
|
4.48
|
7,919.87
|
0.59
|
|
H
|
503
|
2.012,1
|
16,218.83
|
10.52
|
11,177.82
|
0.83
|
|
I
|
1,835
|
7.340,3
|
21492.81
|
13.94
|
5,986.31
|
0.44
|
|
J
|
22,358
|
89.435,6
|
24,850.78
|
16.12
|
2,005.59
|
0.15
|
|
Total
|
24,999
|
100
|
154,213.56
|
100
|
1,350,841.12
|
100
|
Note: A≥200,000; 200,000>B≥100,000; 100,000>C≥10,000; 10,000>D≥5,000; 5,000>E≥1,000; 1,000>F≥100; 100>G≥50; 50>H≥10; 10>I≥1; 1>J (km2).
Table 14 Number, shoreline length, and area of islands in Europeby area classification in 2015
|
Island
classification
|
Number
of islands
|
Percentage in total islands (%)
|
Shoreline
length
(km)
|
Percentage in total islands shoreline (%)
|
Area
of islands
(km2)
|
Percentage in total islands area (%)
|
|
A
|
1
|
0.000,4
|
13,197.56
|
4.85
|
219,126.19
|
26.55
|
|
B
|
1
|
0.000,4
|
7,465.90
|
2.74
|
102,474.84
|
12.41
|
|
C
|
9
|
0.003,8
|
29,639.00
|
10.88
|
313,164.24
|
37.94
|
|
D
|
4
|
0.001,7
|
4,190.06
|
1.54
|
29,208.37
|
3.54
|
|
E
|
29
|
0.012,1
|
15,234.77
|
5.59
|
63,804.01
|
7.73
|
|
F
|
206
|
0.086,0
|
37,056.69
|
13.61
|
63,873.15
|
7.74
|
|
G
|
133
|
0.055,5
|
11,044.91
|
4.06
|
9,687.38
|
1.17
|
|
H
|
545
|
0.227,6
|
21,249.07
|
7.80
|
11,640.24
|
1.41
|
|
I
|
2,456
|
1.025,7
|
31,372.93
|
11.52
|
7,491.00
|
0.91
|
|
J
|
236,056
|
98.586,8
|
101,892.11
|
37.41
|
4,947.45
|
0.60
|
|
Total
|
239,440
|
100
|
272,343.00
|
100
|
825,416.87
|
100
|
Note: A≥200,000; 200,000>B≥100,000; 100,000>C≥10,000; 10,000>D≥5,000; 5,000>E≥1,000; 1,000>F≥100; 100>G≥50; 50>H≥10; 10>I≥1; 1>J (km2).
Table 15 Number, shoreline length, and area of islands in North America by area classification in 2015
|
Island
classification
|
Number
of islands
|
Percentage in total islands (%)
|
Shoreline
length
(km)
|
Percentage in total islands shoreline (%)
|
Area
of islands
(km2)
|
Percentage in total islands area (%)
|
|
A
|
3
|
0.001,1
|
100,774.91
|
15.38
|
2,842,619.53
|
67.90
|
|
B
|
3
|
0.001,1
|
35,665.45
|
5.44
|
412,536.61
|
9.86
|
|
C
|
16
|
0.005,9
|
44,948.29
|
6.86
|
511,259.28
|
12.21
|
|
D
|
14
|
0.005,2
|
16,202.34
|
2.47
|
99,210.57
|
2.37
|
|
E
|
57
|
0.021,0
|
34,400.56
|
5.25
|
125,956.65
|
3.01
|
|
F
|
406
|
0.149,7
|
66,919.16
|
10.21
|
110,383.17
|
2.64
|
|
G
|
295
|
0.108,8
|
24,309.10
|
3.71
|
20,656.65
|
0.49
|
|
H
|
1,456
|
0.537,0
|
61,023.75
|
9.31
|
31,762.93
|
0.76
|
|
I
|
6,900
|
2.544,9
|
89,361.03
|
13.63
|
20,778.63
|
0.50
|
|
J
|
261,978
|
96.625,3
|
181,804.60
|
27.74
|
10,806.53
|
0.26
|
|
Total
|
271,128
|
100
|
655,409.19
|
100
|
4,185,970.55
|
100
|
Note: A≥200,000; 200,000>B≥100,000; 100,000>C≥10,000; 10,000>D≥5,000; 5,000>E≥1,000; 1,000>F≥100; 100>G≥50; 50>H≥10; 10>I≥1; 1>J (km2).
Table 16 Number, shoreline length, and area of islands in South Americaby area classification in 2015
|
Island
classification
|
Number
of islands
|
Percentage in total islands (%)
|
Shoreline
length
(km)
|
Percentage in total islands shoreline (%)
|
Area
of islands
(km2)
|
Percentage in total islands area (%)
|
|
A
|
0
|
0.000,0
|
0.00
|
0.00
|
0.00
|
0.00
|
|
B
|
0
|
0.000,0
|
0.00
|
0.00
|
0.00
|
0.00
|
|
C
|
2
|
0.004,4
|
7,381.97
|
4.60
|
78,843.90
|
31.90
|
|
D
|
4
|
0.008,8
|
9,356.73
|
5.83
|
26,441.63
|
10.70
|
|
E
|
20
|
0.044,1
|
18,966.59
|
11.81
|
50,379.68
|
20.39
|
|
F
|
199
|
0.438,5
|
38,120.58
|
23.72
|
58,493.23
|
23.67
|
|
G
|
150
|
0.330,5
|
10,557.04
|
6.57
|
10,586.12
|
4.28
|
|
H
|
628
|
1.383,7
|
22,225.76
|
13.84
|
14,421.56
|
5.84
|
|
I
|
1,796
|
3.957,1
|
21,222.83
|
13.21
|
5,928.07
|
2.40
|
|
J
|
42,588
|
93.832,9
|
32,792.54
|
20.42
|
2,034.35
|
0.82
|
|
Total
|
45,387
|
100
|
160,624.10
|
100
|
247,128.55
|
100
|
Note: A≥200,000; 200,000>B≥100,000; 100,000>C≥10,000; 10,000>D≥5,000; 5,000>E≥1,000; 1,000>F≥100; 100>G≥50; 50>H≥10; 10>I≥1; 1>J (km2).
Table 17 Number, shoreline length, and area of islands in Antarcticaby area classification in 2015
|
Island
classification
|
Number
of islands
|
Percentage in total islands (%)
|
Shoreline
length
(km)
|
Percentage in total islands shoreline (%)
|
Area
of islands
(km2)
|
Percentage in total islands area (%)
|
|
A
|
0
|
0.000,0
|
0.00
|
0.00
|
0.00
|
0.00
|
|
B
|
0
|
0.000,0
|
0.00
|
0.00
|
0.00
|
0.00
|
|
C
|
3
|
0.032,7
|
5,220.88
|
13.44
|
104,896.23
|
47.67
|
|
D
|
6
|
0.065,3
|
4,758.12
|
12.25
|
39,621.80
|
18.00
|
|
E
|
19
|
0.206,9
|
7,239.91
|
18.64
|
44,230.63
|
20.10
|
|
F
|
83
|
0.903,9
|
8,209.71
|
21.14
|
26,171.56
|
11.89
|
|
G
|
24
|
0.261,4
|
1,285.41
|
3.31
|
1,728.27
|
0.79
|
|
H
|
84
|
0.914,8
|
2,569.74
|
6.62
|
2,022.57
|
0.92
|
|
I
|
307
|
3.343,5
|
3,111.45
|
8.01
|
970.91
|
0.44
|
|
J
|
8,656
|
94.271,5
|
6,442.73
|
16.59
|
422.17
|
0.19
|
|
Total
|
9,182
|
100
|
38,837.95
|
100
|
220,064.14
|
100
|
Note: A≥200,000; 200,000>B≥100,000; 100,000>C≥10,000; 10,000>D≥5,000; 5,000>E≥1,000; 1,000>F≥100; 100>G≥50; 50>H≥10; 10>I≥1; 1>J (km2).
6 Discussion
6.1 Suitability of Google Earth Images Application in 2015
Up to now, the global satellite remote sensing data in 2015 with the highest spatial resolution and open availability is the data carried by the Google Earth system. Although the images in some regions such as the Arctic and Antarctic are less than meters, and some regions are lack of data in 2015, in general, the remote sensing images of Google Earth satellite as the basis for data research and development of shorelines and islands of all continents are sufficient to meet the needs. Only the following two cases need to do some pre-application data preprocessing:
(1) Missing data in 2015
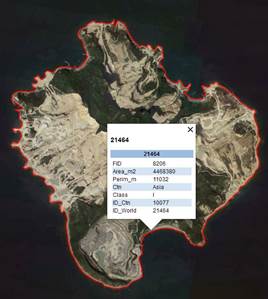
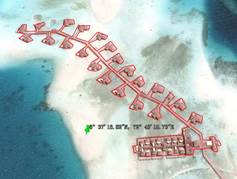
Figure 23 Shoreline definition of Suspension Resort in Maldives (Google Earth image)
In the Google Earth system, data in 2015 is missing in some regions. During the development of this dataset, data of two years before or after 2015 were adopted to supplement. In very few regions, there is a big difference in years, and in some regions there is only one year of data, with the maximum time difference of ten years. The data amount of this part is very small, which can be regarded as the individual data phenomenon.
(2) The spatial resolution below the meters level
Although the image data of Google Earth remote sensing satellite is in the meter-level resolution, the most detailed image data for a small part of regions is from Landsat (15 m, 30 m resolution), which is also used in this dataset.
6.2 Floating Settlements and Floating Bridges
In some coastal areas, residential sites (including tourist resorts) are built above sea level, as docks and pontoon Bridges. Since this part of buildings has a great impact on the rise and fall of sea level and on human activities, the area larger than 6 m2 in this part is also included in the shoreline. Of course, this part is different from the geographic definition of land (Figure 23).
6.3 More Issues
Other issues, which are worthy of discussion, such as shoreline definition, estuary shoreline definition, delta shoreline definition, and mangrove shoreline definition, have been defined in the dataset development specification. As for whether it is necessary to modify the data research and development specification, the authors will discuss it in another article.
Author Contributions
Liu, C. led the data development, established the developing procedure and standards, completed the preliminary dataset, instructed and examined the data quality, provided the main references, and wrote the data paper. Shi, R. X. improved the data development standards, led the data editing and auditing, completed the data coding, data statistics, and wrote part of the data paper, including making figures and tables. Shen, Y. led corporately the data editing and auditing, led the organization of data files, verified the data statistics, and completed part of the data paper. Zhang, Y. H. assisted leading data editing and auditing, corporately led the organization of data files, and completed the data scale conversion experiments. Ma, J. H. assisted in the data statistics and data paper review. Wu, L. Z. completed the editing and auditing of Antarctica data. Chen, W. B. and Tomoko, D. completed part of the data editing and auditing, and provided some references. Chen, L. J. completed part of data auditing and data statistics. Lv, T. T., Tao, Z., and Zhu, Y. Q. completed part of the data editing, proofreading, and auditing.
References
[1] United Nations Sustainable Development Goals [OL]. https://sustainabledevelopment.un.org/?menu=1300.
[2] IPCC Reports [OL]. ttps://www.ipcc.ch/reports/.
[3] Soluri, E. A., Woodson, V. A. World vector shoreline [J]. International Hydrographic Review, 1990, LXVII(1): 27–35.
[4] Digital chart of the world [OL]. https://worldmap.harvard.edu/data/geonode: Digital_Chart_of_the_World.
[5] Retrieval Interface for Digital Chart of the World (DCW), Conterminous US. USGS [OL]. https://water.usgs.gov/dcwindex.html.1994.
[6] ESRI. Digital map of the world [OL]. https://www.esri.com.
[7] NOAA Shoreline Data Explorer [OL]. https://www.ngs.noaa.gov/RSD/shoredata/NGS_Shoreline_ Products.htm.
[8] Wessel, P., Smith, W. H. F. A global, self-consistent, hierarchical, high-resolution shoreline database [J]. Journal of Geophysical Research, 1996, 101(B4): 8741–8743.
[9] Wessel, P., Smith, W. H. F. A Global Self-consistent, Hierarchical, High-resolution Geography Database [OL]. Version 2.3.7 Released June 15, 2017. http://www.soest.hawaii.edu/pwessel/gshhg/.
[10] Liu, C., Shi, R. X., Zhang, Y. H., et al. Global multiple scale shorelines dataset based on Google Earth images (2015) [DB/OL]. Global Change Research Data Publishing & Repository, 2019. DOI: 10.3974/geodb.2019.04.13.V1.
[11] GCdataPR Editorial Office. GCdataPR data sharing policy [OL]. DOI: 10.3974/dp.policy.2014.05 (Updated 2017).
[12] ASTER GDEM 2 [OL]. Advanced Spaceborne Thermal Emission and Reflection Radiometer (ASTER), October 2011, Digital Elevation Database, Earth Remote Sensing Data Analysis Center, Japan, ASTER GDS User Service, http://www.gds.aster.ersdac.or.jp/gds_www2002/service_e/inq.c_e/set_inq.c_e.html, LP DAAC User Services, https://lpdaac.usgs.gov/customer_service.
[13] Howat, I. M., Porter, C., Smith, B. E., et al. The reference elevation model of Antarctica [J]. The Cryosphere, 2019, 13: 665–674. https://doi.org/10.5194/tc-13-665-2019.
[14] What is the intertidal zone? [OL]. https://oceanservice.noaa.gov/facts/intertidal-zone.html.
[15] United Nations Convention on the Law of the Sea [OL]. https://www.un.org/zh/documents/treaty/files/ UNCLOS-1982.shtml.1982.
[16] Yu, J., Wu, S. Y., Li, P. Study on the method for delimiting sea-land demarcation line in Chinese river estuary area [J]. Coastal Engineering, 2003, 22(2): 51–59.
[17] Ji, X. R., Ren, Y. S., Pu, J. S. The research on sea land demarcation lines in Shuangtaizi estuary [J]. Journal of Changchun Institute of Technology (Natural Science Edition), 2016, 17(1): 75–79.
[18] Liu, C., Chen, L. J., Shi, R. X., et al. Lena River Delta [DB/OL]. Global Change Research Data Publishing & Repository, 2016. DOI: 10.3974/geodb.2016.09.06.V1.
[19] Mariam, M. S.,Hélène, R. V., Monique, S., et al. Identifying consensus on coastal lagoons ecosystem services and conservation priorities for an effective decision making: a Q approach. Ecological Economics, 2018, 154: 1–13. https://doi.org/10.1016/j.ecolecon.2018.07.018.
[20] Trisurat, Y. Y. Trisurat mangrove forest photos in Thailand [DB/OL]. Global Change Research Data Publishing & Repository, 2016. DOI: 10.3974/geodb.2016.05.21.V1.
[21] Lv, T. T., Zhou, X., Liu, C., et al. Dataset of mangroves in Southeast Asia [DB/OL]. Global Change Research Data Publishing & Repository, 2015. DOI: 10.3974/geodb.2015.01.08.V1.
[22] Chen, B. Q., Xiao, X. M., Li, X. P., et al. Mangrove forest dataset of China (2015) [DB/OL]. Global Change Research Data Publishing & Repository, 2017. DOI: 10.3974/geodb.2017.03.06.V1.
[23] Wang, X. W., Holland, D. M., Gudmundsson, G. H. Accurate coastal DEM generation by merging ASTER GDEM and ICESat/GLAS data over Mertz Glacier, Antarctica [J]. Remote Sensing of Environment. 2018, 206: 218–230. DOI: 10.1016/j.rse.2017.12.041.
[24] SinoMaps Press. Canada Greenland [M]. Beijing: SinoMaps Press, 2012.
[25] Liu, C., Zhang, Y. H., Shen, Y., et al.Greenland [DB/OL]. Global Change Research Data Publishing & Repository, 2019. DOI: 10.3974/geodb.2019.03.03.V1.
[26] Ma, Z. L., Zhang, J. Q. Thinking on the range and boundary of seven continents [J]. World Geography Research, 1997(1): 110–112.
[27] SinoMaps Press. Asia Atlas [M]. Beijing: SinoMaps Press, 2006.
[28] SinoMaps Press. Europe [M]. Beijing: SinoMaps Press, 2004.
[29] SinoMaps Press. American [M]. Beijing: SinoMaps Press, 2012.
[30] Liu, C., Yang, A. Q., Hu, W. Y., et al. Aleutian Islands [DB/OL]. Global Change Research Data Publishing & Repository, 2016. DOI: 10.3974/geodb.2016.08.12.V1.
[31] Liu, C., Yang, A. Q., Hu, W. Y., et al. Komandor Islands [DB/OL]. Global Change Research Data Publishing & Repository, 2016. DOI: 10.3974/geodb.2016.08.11.V1.
[32] Liu, C., Chen, W. B., Shi, R. X. Ogasawara Archipelago [DB/OL]. Global Change Research Data Publishing & Repository, 2016. DOI: 10.3974/geodb.2016.09.18.V1.
[33] Li, X. P. Several questions on the scope and composition of Oceania [J]. Journal of Northwest Normal University (Natural Science Edition), 1985(2): 61–67.
[34] SinoMaps Press. Russia Atlas [M]. Beijing: SinoMaps Press, 2014.
[35] SinoMaps Press. Atlas of Zhejiang Province, China [M]. Beijing: SinoMaps Press, 1999.
[36] General Station of Xi’an Surveying and Mapping Information Technology, StarMap Press. Atlas of Guangxi Zhuang Autonomous Region [M]. Beijing: StarMap Press, 2000.
[37] General Station of Xi’an Surveying and Mapping Information Technology, StarMap Press. Atlas of Liaoning Province, China [M]. Beijing: StarMap Press, 2000.
[38] General Station of Xi’an Surveying and Mapping Information Technology, StarMap Press. Atlas of Guangdong Province, China [M]. Beijing: StarMap Press, 2000.
[39] General Station of Xi’an Surveying and Mapping Information Technology, StarMap Press. Atlas of Tianjin City, China [M]. Beijing: StarMap Press, 2000.
[40] General Station of Xi’an Surveying and Mapping Information Technology, StarMap Press. Atlas of Hebei Province, China [M]. Beijing: StarMap Press, 2001.
[41] General Station of Xi’an Surveying and Mapping Information Technology, StarMap Press. Atlas of Hongkong Macao Special Administrative Region [M]. Beijing: StarMap Press, 2001.
[42] General Station of Xi’an Surveying and Mapping Information Technology, StarMap Press. Atlas of Taiwan Province, China [M]. Beijing: StarMap Press, 2001.
[43] General Station of Xi’an Surveying and Mapping Information Technology, StarMap Press. Atlas of Shanghai City, China [M]. Beijing: StarMap Press, 2001.
[44] General Station of Xi’an Surveying and Mapping Information Technology, StarMap Press. Atlas of Jiangsu Province, China [M]. Beijing: StarMap Press, 2001.
[45] General Station of Xi’an Surveying and Mapping Information Technology, StarMap Press. Ma of Hainan Province [M]. Beijing: StarMap Press, 2001.
[46] Guangdong Map Press. Traffic Map of Guangdong Province [M]. Guangzhou: Guangdong Map Press, 2013.
[47] StarMap Press. Atlas of Fujian Province [M]. Beijing: SinoMaps Press, 2019.
[48] Shandong Map Press. Traffic Map of Shandong Province [M]. Jinan: Shandong Map Press, 2002.
[49] SinoMaps Press. Japan [M]. Beijing: SinoMaps Press, 2013.
[50] Liu, C., Shi, R. X., Zhu, Y. Q. Boundary data of Kuril Islands [DB/OL]. Global Change Research Data Publishing & Repository, 2016. DOI: 10.3974/geodb.2016.04.08.V1.
[51] SinoMaps Press. North Korea Republic of Korea [M]. Beijing: SinoMaps Press, 2012.
[52] SinoMaps Press. Atlas of Republic of Korea [M]. Beijing: SinoMaps Press, 2015.
[53] Lv, T. T., Liu, C., Shi, R. X. Coastline data of Jeju Island [DB/OL]. Global Change Research Data Publishing & Repository, 2016. DOI: 10.3974/geodb.2016.01.16.V1.
[54] Sung Ji Mun Hwa Co., Ltd. Korea [M]. Sung Ji Mun Hwa Co., Ltd., 2006.
[55] Sung Ji Mun Hwa Co., Ltd. Tourist Guide Map, Seoul, Busan, Gyeongju, Gongju, Byyeo, Jeju [M]. Sung Ji Mun Hwa Co., Ltd., 2006.
[56] Dae-Kyoung Kim. Monthly Tour Guide Map Seoul [J]. Unicom Korea Incorporated, 2007, 10(112): J-8.
[57] SinoMaps Press. The Philippine [M]. Beijing: SinoMaps Press, 2014.
[58] Liu, C., Chen, W. B., Shi, R. X. Izu Islands [DB/OL]. Global Change Research Data Publishing & Repository, 2016. DOI: 10.3974/geodb.2016.09.11.V1.
[59] TTK Healthcare Limited. A Road Guide to Sri Lanka [M]. Chennai: TTK Healthcare Limited, 2001.
[60] SinoMaps Press. Malyysia Singapore Brunei [M]. Beijing: SinoMaps Press, 2002.
[61] SinoMaps Press. Atlas of West Asia [M]. Beijing: SinoMaps Press, 2002.
[62] SinoMaps Press. Vietnam Laos Kingdom of Cambodia [M]. Beijing: SinoMaps Press, 2006.
[63] PN Map Center. Map of Southeast Asia [M]. Bangkok: PN Map Center.
[64] Rough Guides. Vietnam, Cambodia & Laos [M]. Rough Guides, 1982.
[65] SinoMaps Press. Burma [M]. Beijing: SinoMaps Press, 2008.
[66] Chinese Map Publishing House. Singapore [M]. Beijing: Chinese Map Publishing House, 2004.
[67] SinoMaps Press. Vietnam Laos Kingdom of Cambodia [M]. Beijing: SinoMaps Press, 2012.
[68] Citymap Publishing. Peninsular Malaysia [M]. KualaLumpur: Citymap Publishing.
[69] World Express Mapping. Detail Street Map of Singapore [M]. Singapore: World Express Mapping.
[70] PN Map. Map of Thailand [M]. PN Map.
[71] ThinkNet Co., Ltd. Islands in Thailand [M]. Bangkok: ThinkNet Co., Ltd., 2009.
[72] Groovy Map Co., Ltd. Islands & Beaches Thailand [M]. Bangkok: Groovy Map Co., Ltd., 2007.
[73] Asia Book Co., Ltd. Thailand [M]. Bangkok: Asia Book Co., Ltd., 2007.
[74] SinoMaps Press. Nepal Bhutan Sri Lanka Maldives [M]. Beijing: SinoMaps Press, 2010.
[75] Zhang, H. Y., Niu, Z. G., Liu, C., et al. Sundarbans Wetland in 2015 (Bangladesh) [DB/OL]. Global Change Research Data Publishing & Repository, 2015. DOI: 10.3974/geodb.2015.01.14.V1.
[76] Liu, C., Shi, R. X., Zhu, Y. Q. Coastline data of Sri Lanka [DB/OL]. Global Change Research Data Publishing & Repository, 2015. DOI: 10.3974/geodb.2015.02.06.V1.
[77] SinoMaps Press. India [M]. Beijing: SinoMaps Press, 2011.
[78] Ma, L., Liu, C., Shi, R. X. Coastline data of Kalimantan Island [DB/OL]. Global Change Research Data Publishing & Repository, 2016. DOI: 10.3974/geodb.2016.01.15.V1.
[79] SinoMaps Press. Malaysia Indonesia [M]. Beijing: SinoMaps Press, 2014.
[80] Ma, L., Tao, Z., Lv, T. T., et al. Coastline data of Sumatera Island [DB/OL]. Global Change Research Data Publishing & Repository, 2016. DOI: 10.3974/geodb.2016.01.17.V1.
[81] Zhou, X., Lv, T. T., Tao, Z., et al. Coastline data of Java Island [DB/OL].Global Change Research Data Publishing & Repository, 2016. DOI: 10.3974/geodb.2016.01.18.V1.
[82] Liu, C., Shi, R. X., Yang, A. Q., et al. Maldives Islands [DB/OL]. Global Change Research Data Publishing & Repository, 2016. DOI: 10.3974/geodb.2016.08.19.V1.
[83] Liu, C., Shi, R. X., Chen, L. J., et al. Little Andaman Group [DB/OL]. Global Change Research Data Publishing & Repository, 2019. DOI: 10.3974/geodb.2019.02.47.V1.
[84] Liu, C., Shi, R. X., Chen, L. J., et al. Andaman Islands [DB/OL]. Global Change Research Data Publishing & Repository, 2019. DOI: 10.3974/geodb.2019.02.50.V1.
[85] Liu, C., Shi, R. X. Cayman Islands [DB/OL]. Global Change Research Data Publishing & Repository, 2017. DOI: 10.3974/geodb.2017.01.15.V1.
[86] Liu, C., Shi, R. X., Chen, L. J., et al. West Reef Islets [DB/OL]. Global Change Research Data Publishing & Repository, 2019. DOI: 10.3974/geodb.2019.02.58.V1.
[87] Liu, C., Shi, R. X., Zhu, Y. Q. Boundary data of Malt Archipelago [DB/OL].Global Change Research Data Publishing & Repository, 2016. DOI: 10.3974/geodb.2016.04.12.V1.
[88] Michelin. Europe [M]. Proprietaires-editeurs: Michelin, 2009.
[89] SinoMaps Press. Atlas of England [M]. Beijing: SinoMaps Press, 2007.
[90] SinoMaps Press. France Monaco [M]. Beijing: SinoMaps Press, 2002.
[91] SinoMaps Press. Italy San Marino Vatican Malta [M]. Beijing: SinoMaps Press, 2002.
[92] SinoMaps Press. Atlas of Italy [M]. Beijing: SinoMaps Press, 2008.
[93] SinoMaps Press. Atlas of Greece [M]. Beijing: SinoMaps Press, 2010.
[94] SinoMaps Press. Atlas of Spain Portugal [M]. Beijing: SinoMaps Press, 2009.
[95] Institute Gerographique National. Pirineos [M]. IBOS: Institute Gerographique National, 1993.
[96] SinoMaps Press. Germany [M]. Beijing: SinoMaps Press, 2004.
[97] Institute Gerographique National. Néouvielle [M]. Paris: Institute Gerographique National, 2004.
[98] SinoMaps Press. Atlas of Netherlands, Belgium, and Luxembourg [M]. Beijing: SinoMaps Press, 2010.
[99] SinoMaps Press. Ireland [M]. Beijing: SinoMaps Press, 2013.
[100] Liu, C., Shi, R. X. Monach Islands [DB/OL]. Global Change Research Data Publishing & Repository, 2017. DOI: 10.3974/geodb.2017.01.13.V1.
[101] Liu, C., Shi, R. X. Shiant Isles [DB/OL]. Global Change Research Data Publishing & Repository, 2017. DOI: 10.3974/geodb.2017.01.04.V1.
[102] Liu, C., Shi, R. X. Shetland Islands [DB/OL]. Global Change Research Data Publishing & Repository, 2017. DOI: 10.3974/geodb.2017.01.05.V1.
[103] Liu, C., Shi, R. X. Orkney Islands [DB/OL].Global Change Research Data Publishing & Repository, 2017. DOI: 10.3974/geodb.2017.01.11.V1.
[104] Liu, C., Shi, R. X. Pentland Skerries [DB/OL]. Global Change Research Data Publishing & Repository, 2017. DOI: 10.3974/geodb.2017.01.12.V1.
[105] Liu, C., Shi, R. X., Zhu, Y. Q. Boundary data of Aland Islands [DB/OL]. Global Change Research Data Publishing & Repository, 2015. DOI: 10.3974/geodb.2015.02.11.V1.
[106] Cito-plan bv-Fietsersbond-Gemeente Amsterdam. Amsterdam [M]. Uitgave: Cito-plan bv.
[107] SinoMaps Press. Norway Sweden Finland [M]. Beijing: SinoMaps Press, 2014.
[108] Liu, C., Shi, R. X. Russebuholmane Islets [DB/OL]. Global Change Research Data Publishing & Repository, 2017. DOI: 10.3974/geodb.2017.01.17.V1.
[109] Liu, C., Shi, R. X. King Ludwig Islands [DB/OL]. Global Change Research Data Publishing & Repository, 2017. DOI: 10.3974/geodb.2017.01.18.V1.
[110] Liu, C., Shi, R. X. Menke Islands [DB/OL]. Global Change Research Data Publishing & Repository, 2017. DOI: 10.3974/geodb.2017.01.20.V1.
[111] Tiba. The Nile from Alexandria to Aswan [M]. Egypt: Tiba.
[112] SinoMaps Press. Atlas of Egypt [M]. Beijing: SinoMaps Press, 2011.
[113] Bartholomew. Egypt [M]. Edinburgh: Bartholomew, 1996.
[114] New Holland Publisher (UK) Ltd. Southern Africa [M]. London: New Holland Publisher (UK) Ltd., 2003.
[115] Liu, C., Ambinintsoa, N., Zha, F. L., et al. Boundary data of the Madagascar Island [DB/OL]. Global Change Research Data Publishing & Repository, 2016. DOI: 10.3974/geodb.2016.02.07.V1.
[116] New Suez Canal officially opened in Egypt [J]. Geography Teaching, 2015(21): 59.
[117] Saint Helena [OL]. https://en.wikipedia.org/wiki/Saint_Helena.
[118] Tristan da Cunha [OL]. https://en.wikipedia.org/wiki/Tristan_da_Cunha.
[119] SinoMaps Press. Oceania [M]. Beijing: SinoMaps Press, 2013.
[120] SinoMaps Press. Papua New Guinea and main islands in the Pacific [M]. Beijing: SinoMaps Press, 2015.
[121] SinoMaps Press. Atlas of New Zealand [M]. Beijing: SinoMaps Press, 2007.
[122] Liu, C., Shi, R. X., Zhu, Y. Q. Boundary data of the Babuyan Islands [DB/OL]. Global Change Research Data Publishing & Repository, 2016. DOI: 10.3974/geodb.2016.04.02.V1.
[123] National Geographic Society. Ontario [M]. Washington D.C.: National Geographic Society, 1996.
[124] SinoMaps Press. Cuba Bahamas Caribbean Islands [M]. Beijing: SinoMaps Press, 2014.
[125] SinoMaps Press. Guatemala Belize Honduras Nicaragua Costa Rica Panama [M]. Beijing: SinoMaps Press, 2014.
[126] AutoMAPA. Buenos Aires [M]. Argentina: AutoMAPA.
[127] SinoMaps Press. Chile Argentina Uruguay [M]. Beijing: SinoMaps Press, 2014.
[128] Liu, C., Lv, T. T., Shi, R. X. Falkland Islands (Islas Malvinas) in the South Atlantic Ocean [DB/OL]. Global Change Research Data Publishing & Repository, 2018. DOI: 10.3974/geodb.2018.07.12.V1.
[129] Liu, C., Lv, T. T., Shi, R. X. Jason Islands in the South Atlantic Ocean [DB/OL]. Global Change Research Data Publishing & Repository, 2018. DOI: 10.3974/geodb.2018.07.11.V1.
[130] South Georgia and the South Sandwich Islands [OL]. https://en.wikipedia.org/wiki/South_Georgia_and_ the_South_Sandwich_Islands.
[131] French southern and Antarctic lands [OL]. https://en.wikipedia.org/wiki/French_Southern_and_Antarctic_ Lands.
[132] Heard Island and McDonald Islands [OL]. https://en.wikipedia.org/wiki/Heard_Island_and_McDonald_Islands.
[133] Bouvet Island [OL]. https://en.wikipedia.org/wiki/Bouvet_Island.
[134] Wang, Q. H., E, D. C., Chen, C. M., et al. Popular map projections in Antarctica and their application [J]. Chinese Journal of Polar Research, 2002, 14(3): 226–233.