Dataset of Land Reclamation in the Continental United States from the
10th to 18th Centuries
Zhao, C. S. 1, 2 He, F. N. 1*
Yang, F. 3 Wang,
Y. F. 1, 2
1. Key
Laboratory of Land Surface Pattern and Simulation, Institute of Geographic
Sciences and Natural Resources Research, Chinese Academy of Sciences, Beijing
100101, China;
2.
University of Chinese Academy of Sciences, Beijing 100049, China;
3. Key
Research Institute of Yellow River Civilization and Sustainable Development
& Collaborative Innovation Center on Yellow River Civilization jointly
built by Henan Province and Ministry of Education, Henan University, Kaifeng
475001, China
Abstract: Reconstruction of
historical land-use and land-cover change (LUCC) at
the regional level can provide not only the reliable basic data for studying
climate and ecological effects, but also a reference for enriching and
improving global datasets. The research area for this study is the modern
continental United States. The number of Indians dominated by agriculture, per
capita cropland area of Indians, number of non-Indians, and per capita cropland
area of each colony were calculated based on historical documents and prior
findings. The cropland amount for each region of the continental United States
from the 10th to 18th centuries has been reconstructed. The land suitability
for cultivation model and cropland allocation model were established. Finally,
the geographical distribution pattern of cropland in the continental United
States from the 10th to 18th centuries was reconstructed. The findings are as
follows: (1) the amount of cropland in the continental United States shows a
fluctuating growth trend, increasing from 1.71??103 km2 in
1000 to 4.74??104 km2 in 1780. It can be divided into
three periods: slow growth (1000–1500), slow decrease (1500–1700), and rapid
increase (1700–1780). (2) During the Indian period, the cropland was primarily
distributed in the southwest and the area of the eastern region adjacent to
Plain. The cropland was distributed in the eastern coastline area during the
colonial period.
Keywords: Historical land use; land reclamation; continental United States; 10th to
18th centuries
DOI: https://doi.org/10.3974/geodp.2022.02.17
CSTR: https://cstr.escience.org.cn/CSTR:20146.14.2022.02.17
Dataset Availability Statement:
The dataset supporting this paper
was published and is accessible through the Digital Journal of Global Change Data Repository
at: https://doi.org/10.3974/geodb.2022.02.04.V1 or
https://cstr.escience.org.cn/CSTR:20146.11.2022.02.04.V1.
1 Introduction
Human-caused
land-use and land-cover change (LUCC) not only has a direct influence on
surface landscape pattern, but it also has a substantial impact on climate and
environmental change via bio-geophysical and biogeochemical processes[1–4].
As a result, LUCC and its impact studies have been critical in global
environmental change. As an important part of LUCC study, historical LUCC
became one of the fundamental issues of global change research. Quantitative
reconstruction of historical LUCC is not only useful to better understand the
influence of human activities on the earth??s surface over time, but also
provides fundamental data for climate modeling and other studies[5,6].
The reconstruction
of historical LUCC has progressed considerably since the 1990s. The HYDE, SAGE,
PJ, and KK10 datasets should be used to obtain the representative research
data. In detail, Netherlands Environmental Assessment Agency established the
HYDE[7] global cropland and pasture dataset, with the coverage
period from 10000 B.C. to 2015. SAGE cropland dataset covered the period from
1700 to 2007, which was established by Center for Sustainability and the Global
Environment[8]. Pongratz[9] reconstructed the PJ dataset
based on HYDE and SAGE, with the reconstruction period from 800 to 1992. Kaplan[10]
reconstructed the KK10 land cover data from 8000 years ago to 1850 A.D.
Although the global datasets covered a long period of time and a wide range,
there are still a lot of uncertainties at the regional level[11–16].
As a result, it is critical to reconstruct the historical land use datasets at
the regional level.
The academic
community is concerned about the historical LUCC process of the United States,
because it is one of the world??s greatest countries with economies and agricultural
powers. The temporal and spatial variations of the cropland of the United
States have been studied. Waisanen et al.[17]
examined the change features of cropland and its driving mechanisms in the
United States from 1850 to 1997 using the statistical data. Based on the
statistics, potential vegetation spatial pattern, and soil data, Steyaert et al.[18] reconstructed the
gridding land cover products with a spatial resolution of 20 km in the eastern
United States in 1850, 1920, and 1992. Rhemtulla et al.[19] reconstructed the land use in Wisconsin
between the mid-nineteenth and the early-twentieth century. Based on remote
sensing and statistical data, Zumkehr et
al.[20] reconstructed the amount and spatial distribution of
cropland in the United States from 1850 to 2000. Yu et al.[21] reconstructed the spatial distribution of
cropland in the United States from 1850 to 2016. The findings show that the
period of the reconstruction of cropland in the United States mostly after the
United States was founded, especially after the middle of the nineteenth
century. However, Indians and European colonists had already farmed and lived
in the continental United States for a long time before the United States was
founded. Furthermore, Indian agriculture had developed throughout the last 1,000
years. However, there are few studies on the reconstruction of cropland in the
United States from the 10th to 18th centuries.
As a result, the
modern continental United States and the 10th to 18th centuries were selected
as the study region and the time period for this study, respectively. By
systematically combining the relevant previous research results, we extracted
the information about population and land reclamation in the continental United
States during the last millennium. Then, we reconstructed the amount of
cropland and gridding spatial pattern of cropland in the United States from the
10th to 18th centuries. The reconstruction findings show the regulation of land
reclamation change in the continental United States. The results not only
provide accurate fundamental data for in-depth studies of historical LUCC??s
climatic and ecological effects, but also help to analyze the regional cases
for improving the global dataset.
2 Metadata of the Dataset
The metadata of the Dataset[22] is
shown in Table 1.
Table
1 Metadata summary of the
Dataset of land reclamation of United States of America during 1000–1780
|
Items
|
Description
|
|
Dataset full name
|
Dataset of land
reclamation of United States of America during 1000–1780
|
|
Dataset short
name
|
LandReclaUSA_1000–1780
|
|
Authors
|
Zhao, C. S.,
Institute of Geographic Sciences and Natural Resources Research, University of
Chinese Academy of Sciences, zhaocs.19b@igsnrr.ac.cn
He, F. N.,
Institute of Geographic Sciences and Natural Resources Research,
hefn@igsnrr.ac.cn
Yang, F., Key
Research Institute of Yellow River Civilization and Sustainable Development
& Collaborative Innovation Center on Yellow River Civilization jointly
built by Henan Province and Ministry of Education, Henan University, yangfan@henu.edu.cn
Wang, Y. F.,
Institute of Geographic Sciences and Natural Resources Research, University of
Chinese Academy of Sciences
Wang, Y. F.,
Institute of Geographic Sciences and Natural Resources Research, University of
Chinese Academy of Sciences, wangyafei972x@igsnrr.ac.cn
|
|
Geographical area
|
the continental
United States
|
|
Year
|
1000, 1500, 1620,
1700, 1780
|
|
Spatial
resolution
|
10 km Data
format .xls, .shp, .tif
|
|
Data size
|
24.8 MB (10.3 MB
after compression)
|
|
Data files
|
1 file in .xls
format, 5 files in .shp format, 5 files in .tif format
|
|
Foundations
|
Ministry of Science and Technology of P.
R. China (2017YFA0603304); National Natural Science Foundation of China
(41671149)
|
|
Data computing environment
|
ArcMap, MATLAB,
Excel
|
|
Data publisher
|
Global Change
Scientific Research Data Publishing System, http://www.geodoi.ac.cn
|
|
Address
|
No. A11, Datun
Road, Chaoyang District, Beijing 100101, China
|
|
Data sharing
policy
|
Data from the Global Change Research Data
Publishing & Repository includes metadata, datasets (in the Digital Journal of Global
Change Data Repository), and publications (in the Journal of Global
Change Data & Discovery).
Data sharing
policy includes: (1) Data are openly available and can
be free downloaded via the Internet; (2) End users are encouraged to use Data
subject to citation; (3) Users, who are by definition also value-added
service providers, are welcome to redistribute Data subject to written
permission from the GCdataPR Editorial Office and the issuance of a Data
redistribution license; and (4) If Data are used to compile new
datasets, the ??ten per cent principal?? should be followed such that Data
records utilized should not surpass 10% of the new dataset contents, while
sources should be clearly noted in suitable places in the new dataset[23]
|
|
Communication and
searchable system
|
DOI, CSTR, Crossref, DCI, CSCD, CNKI, SciEngine, WDS/ISC, GEOSS
|
3 Data Development Method
3.1 Data Sources
There
are two types of basic data reported in this article. One is the historical
population data used to determine the amount of cropland. Another is the modern
base data used for spatially gridded reconstruction of cropland.
3.1.1 Sources of Historical Population Data
(1)
Indian period (1000–1620). The population data at 1000 A.D. were quoted from
the Historical Population Atlas of the World[24].
The population of
years 1500–1620 was quoted from the document ??North American Indian Population
Size, 1500 A.D. to 1985??[25]. In detail, records of Indian
population after year 1500 were already available, which was mainly obtained
from Mooney??s study[26]. By filtering and correcting early
explorers?? estimations of a mount of tribes, the study estimated the population
of North America around year 1500. Then, using Mooney??s work as a foundation,
Ubelaker[25] reconstructed the Indian population of the continental
United States from year 1500 to year 1970 by adding and correcting more tribes??
demographic data. amountThe findings show that most studies overestimated the
amount of Indian population. Ubelaker??s estimations are more similar to the
population estimates based on site locations. As a result, Ubelaker??s
reconstruction was used as the population of Indians after year 1500 in this
study.
(2) Colonial
period (1620–1780 A.D.). During this time, Europeans began colonizing the
American continent and bringing Africans as slaves. The population was divided
into Indians and non-Indians. The Indian data sources are the same as the
Indian period sources mentioned above. The population of non-Indians is quoted
from the United States Department of Commerce, Bureau of National Intelligence ??Historical
Statistics of the United States: Colonial Period to 1970?? Volume 2.
3.1.2 Modern Basic Data
(1)
Modern
cropland data. We used the land use data with a spatial resolution of 5 km for
a total of eight periods in 1982, 1985, 1990, 1995, 2000, 2005, 2010, and 2015.
They were obtained from the study by Gong et
al.[28].
The dataset, which is constructed based on the most recent version of GLASS (Global
Land Surface Satellite) CDRs (Climate Data Records) from 1982 to 2015, covered
cropland, woodland, grassland, scrubland, tundra, moorland, snow, and ice.
(2) Topographic
data. The data include the ground height and slope. The United States
Geological Survey (USGS) produced and published the Digital Elevation Model
(DEM) product (V4.1)
collected by the Shuttle Radar Topography Mission (SRTM). The slope data were
derived from the DEM data.
(3) Climate
data. Active cumulative temperature (1960–1990) data were directly obtained
from the Global Agro-ecological Zones (GAZ) product, which was published by the
Food and Agriculture Organization (FAO) of the United Nations.
(4) Soil data.
Soil-related data including coarse-grained matter content, sandy matter
content, chalky matter content, and clay matter content of the soil were
derived from SoilGrids.
3.2 Data Processing and Estimation
3.2.1 Population Data Processing
The
political districts have not been set in the continental United States during
the Indian and Colonial periods. The continental United States was split into
eight regions as described below, based on the regional division scheme used by
earlier researchers in historical population-related studies (Figure 1). The
eight regions are as follows: the Northwest Coastal region, California region, Plateaus region, Great Basin
region, Southwest region, Great Plains region, Northeast region, and Southeast
region[29].
Because the
population data for 1000 A.D. was only the total data, it is necessary to
divide them into regions. We divided the population data for 1000 A.D. by the
proportion of the population in each region in 1500 A.D., because of the less
change in the spatial distribution of the population between 1000 and 1500 A.D.
Furthermore, from 1620 to 1780 A.D., the amount of colonies continuously
expanded. However, it is difficult to obtain the population for each colony.
The Bureau of Statistics reported the total population for the colonial
district from 1620 to 1780 A.D., which is credible. As a result, the population
of the colonial district was divided into each colony in 1620, 1700, and 1780 A.D.,
based on the proportion of each colony from the Historical Population Atlas.
|
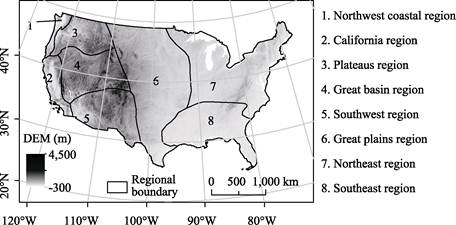
Figure 1 Eight regions of the
continental United States
|
3.2.2 Estimation of
Cropland Area
(1)
Indian period. It is important to estimate the amount of primarily agricultural
Indian population because not all the Indians rely on agriculture for their
livelihood.
Based on
historical documents and previous findings, we first determined the
distribution range of the Indians, mostly agriculturalists. Then, we calculated
the ratio of the area of agricultural distribution to the total area for each
region. The amount of people in each region with agriculture as the main mode
of production was calculated by multiplying the ratio and the population of
each region. Finally, the cropland area and reclamation rate were calculated by
multiplying the amount of per capita cropland with the population.
Because of the
lack of historical documents, it is difficult to obtain per capita cropland
throughout the Indian period directly from historical documents. It can be assumed that the
degree of farming at the time of the colonists?? first arrival in North America
was equivalent to that of the Indians, because the Indians originally taught
agricultural skills to the colonists[30]. ??A settler could generally
only farm 1 to 3 acres each year,?? according to the General History of the
United States[30]. Indians had to farm more land to satisfy their
own needs because of the poor farming
techniques and food production during the primitive agricultural age. The land
was sparsely inhabited and fertile, giving the Indians more per capita land to
farm than the colonists. Therefore, four acres was used as the per capita
cropland to calculate the cropland area and reclamation rate during the Indian period in this study.
(2) Colonial period.
The reclamation rate was individually estimated for each region based on the
Indian and colonial territories in this study. In detail, the reclamation in
Indian region was calculated using the same method as it was for Indian times.
Moreover, the cropland distribution was the same as it was in 1620 A.D. The
colonial reclamation rate calculation is shown below.
 (1)
(1)
where Rcropz(I,t), perland(i,t),
??(i,t), and ?? denote the reclamation rate, per capita cropland, population
density, and proportion of reclamation (constant) for colony i in year t, respectively.
Per capita land
area. Because the continental United States was mainly Indian throughout the early
colonial period, colonial land development was restricted. Then, to obtain
access to fertile land, the British administration began to evict and kill
Indians. Moreover, the government implemented a program of ??manumission,?? in
which huge swaths of land were granted to settlers, drawing a substantial
number of non-Indians.
In Virginia, for
example, a system of land grants was established in 1619, with each settler
receiving 50 acres of land. In Maryland, the ??manumission?? was 100 acres per
settler. In New Jersey, the ??manumission?? was 150 acres per settler. In
Georgia, the ??manumission?? was 500 acres per settler[31]. Therefore,
the land area per capita for the period should be equal to the area set for the
??manumission?? of each region. The acreage per capita in that period should
therefore be equal to the acreage set for the ??right of man?? in each region.
Reclamation
proportion. The colonial authority decreed that three acres should be farmed
for every 50 acres of land acquired by each immigrant. In actuality, although
certain immigrants?? reclamation proportion may be somewhat greater or lower, it
is difficult to obtain the necessary data. Therefore, we used 0.06 as the
colonial reclamation proportion, which was calculated by dividing three acres
by 50 acres.
3.2.3 Modern Base Data Resampling and Normalization
The
geographic resolution was united by resampling each modern data to 10 km??10 km,
because the gridded reconstruction of cropland has a resolution of 10 km??10 km.
In addition, when the data were dimensionless, two normalization methods were
used in this study to characterize the positive and negative connections
between the impact factors and geographical distribution of cropland. The
formulas are written below:
 (2)
(2)
where
Mnorm(i,j) and Nnorm(i,j) represent the normalized positive and
negative correlation factors for grid i in region j,
respectively, with the range from [0,1]. Mmax(i,j) and Nmax(i,j) are the maximum of impact factor values
in region i at 10 km??10 km grid size. M(i,j)
and N(i,j) are the original values of
influencing factors in j grid of region i.
3.3 Grid-based Reconstruction Methods
3.3.1 Determination of the Maximum Range
of Available Allocation of Cropland
This
study determined the maximum range of available allocation of cropland in the
eastern and western regions. The range of maximum available allocation cropland
should be included in the modern distribution of cropland in the east, where
the population of colonists rapidly increased. We used the 1982, 1985, 1990,
1995, 2000, 2005, 2010, and 2015 eastern United States cropland distribution
ranges to create a 10 km??10 km grid data as the maximum range of cropland
distribution of the eastern United States through time. The Western Region is
the rest of the United States except for the East. The maximum available
allocation of cropland was considerably different from that in modern times in
the West. Therefore, based on the distribution of agricultural Indians in the
West, we determined the maximum range of available allocation of cropland for
each time in the West.
3.3.2 Establishment of
Land Suitability Model
People??s
reclamation activities first occurred in areas that were suitable for crop
growth. After being reclaimed, cropland would eventually be expanded from
high-quality land to low-quality land as the population increased. Natural and
human factors both influenced the distribution
of cropland. It is difficult to identify the pattern of population distribution
on a grid size in the United States during the 10th to 18th centuries.
Moreover, the land regulations were not yet firmly implemented at that time. It
was difficult to access the human element. Thus, the main factor
influencing the distribution of cropland in this study was natural factors.
Human land use activities will be concentrated at lower elevations, on gentle
slopes, and in agriculturally appropriate climatic regions. Therefore, factors
including height, slope, and climate were selected and standardized in this
study. Based on the above calculations, the equivalent weights were utilized to
establish a grid-scale land suitability model.
 (3)
(3)
where
Landsuit(i,j) is the land suitability of grid j
in region i. Hnorm(i,j), Snorm(i,j),
and Cnorm(i,j) represent the
normalized values of altitude, ground slope, and climate in grid i of
region j, respectively.
3.3.3 Establishment of Gridding Allocation Methods of Cropland
Based
on the land suitability values calculated using the above model, the cropland
area in each region was allocated to the grid. The allocation model can be
described as follows.
 (4)
(4)
where Cropland(j,t) is the cropland area of grid j in time t; Landsuit(i,j) is the land suitability value of grid i in region j; Areacrop(i,t) is the cropland area of region i
in time t; ?? and ?? are
the index of maximum range of available allocation cropland and soil factors,
respectively. If the area of grid j exceeds the maximum range of available allocation
cropland or unsuitable for farming, it was given a value of 0 for ?? and ??. Otherwise, it was given a value of 1. The soil factor was
determined using a range of parameters for arable soils of Zhang??s work[32].
3.4 Technical Route
First, historical demographic data and Indian
distribution patterns were collected and compiled for eight regions, which were
divided from those of continental United States based on the Indian production
methods. We determined the amount of Indian agricultural population for each
region during the Indian period. Then, we used the population data above and per capita cropland based on
relevant data such as settlement history to calculate the amount of cropland
during the Indian period. The amount of colonies was estimated by
combining the amount of non-Indian people with the history of
non-Indian settlement and policies. In the Indian region, the amount of
cropland was calculated in the same manner as in the Indian period. A series of
cropland amount in each region of the continental United States from the 10th
to18th centuries was reconstructed by calculating and integrating the
aforementioned data.
Second, the maximum range of cropland
distribution was determined based on the remote sensing data and historical
documents. A land suitability model and gridding allocation methods for
cropland were established.
Finally, we reconstructed gridded cropland
data with a 10 km resolution during the 10th to 18th centuries, based on the
above methodology (Figure 2).
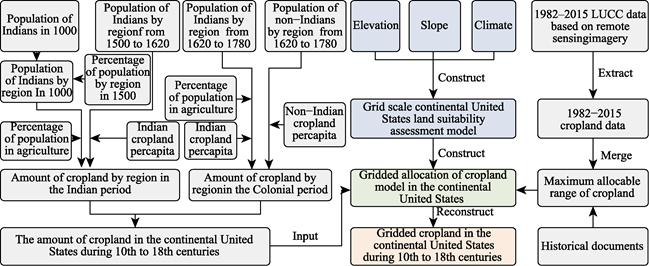
Figure 2 The technical route of this
study
4 Data Results
4.1 Data Composition
The
dataset of land reclamation in the continental United States from the 10th to
18th centuries consists
of a table file, five .shp files, and five raster data with a resolution of 10
km (Figure 3). Five shp data are shown for the distribution of reclamation
rates by district in the United States in the years 1000, 1500, 1620, 1700, and
1780 (Figure 4). The five raster data are shown for the spatial distribution of
10-km-resolution cropland in the continental United States for the years 1000,
1500, 1620, 1700, and 1780 (Figure 5).
4.2 Data Results
There is a general increasing trend in the
amount of cropland in the continental United
States during the 10th
to 18th centuries. In detail, the amount of cropland first increased and
then decreased during the Indian period. Between the years 1000 and 1500, the
continental United States was ethnically Indian-only. Partial Indians relied on
farming as the major mode of livelihood. The amount of cropland increased with
the increase in agricultural population, from 1.71??103 km2 in year 1000
to 8.53??103 km2
in year 1500. The Spanish did not colonize the continental United States
when Columbus found the continent in year 1492, but this resulted in the
invasion of European diseases and quick reduction in the Indian population,
leading to a decrease of cropland to 6.94??103 km2 in year 1620.
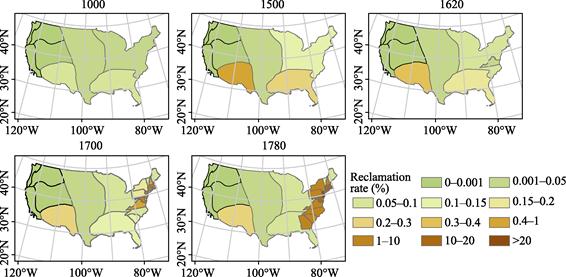
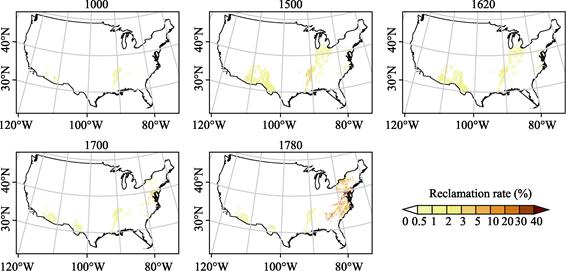
Figure 4 Reclamation rates by region in the
continental United States from 1000 to 1780 A.D.
|
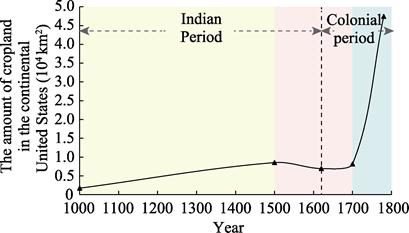
Figure 3 Amount of
cropland in the continental United States from year 1000 to year 1780
|
Figure 5 Spatial patterns of cropland in the
continental United States from 1000 to 1780 A.D. (10 km??10 km)
The amount of cropland increased during the colonial period, particularly
after year 1700. The British began to settle in the continental United States
after year 1620. Then, policies related to land settlement were enacted,
attracting large-scale immigration activities and expanding the colonies. There
were 13 colonies in 1780, including Virginia and Georgia. The amount of
cropland rapidly increased as a result, to 4.74??104
km2 in 1780, with the increase of 4.83 times between 1700 and
1780.
The northeast,
southeast, southwest, and middle Plain regions of the United States were the
primary locations of American Indian colonization in 1000 A.D., with the
greatest rate of reclamation in the southeast at only 0.07%. The reclamation
rate in the continental United States had
steady growth from 1000 to 1500 A.D. The reclamation rates increased by 0.45%,
0.24%, and 0.14% in the southwest, southeast, and northeast regions, respectively.
The reduction of Indians population resulted in the decrease of the reclamation
rate from 1500 to 1620 A.D. The southwest and southeast regions had the largest
decrease with 0.07%.
The amount of
colonists gradually increased from 1620. Unlike the Indians, who farmed for
their own survival, the colonists colonized the country to profit from the sale
of crops and tobacco. As a result of the ??right of man,?? the settler population
rapidly increased, as did the reclamation rate in the colonies. In 1780, the
reclamation rate increased in the eastern colonies. The reclamation rates of
New Jersey, Rhode Island, Maryland, Connecticut, and Massachusetts all exceeded
by 20%.
The spatial grid of
cropland during the 10th to 18th centuries reveals that cropland was primarily
located in the south-west and south-east parts with a small distribution and
reclamation rate. At year 1500, the cropland had expanded. The rate of
settlement in the south-eastern and southern parts of the plain decreased in
1620. In 1700, the amount of cropland in the southwest decreased. However, in
the northeast part, the amount of cropland near the shore expanded. In 1780,
the cropland area along the eastern coast quickly expanded.
5 Discussion
and Conclusion
5.1
Discussion
Because the PJ and HYDE datasets are the worldwide datasets that
provide cropland data in the continental United States from the 10th to 18th
centuries, the total cropland area in the continental United States of this
study was compared to that of the global dataset PJ and HYDE3.2 (Figure 6). The
trend of cropland area change during the 10th to 18th centuries in this study
is similar to that of the HYDE3.2 and PJ datasets, with an overall increasing
tendency. The PJ dataset, in detail, can be separated into two periods during
the 10th to 18th centuries, a period of relative stability from 1000 to 1600,
and a period of linear development from 1600 to 1780. In contrast, the cropland
data of both this study and HYDE 3.2 can be divided into three periods, which
are more consistent with the historical facts: a period of slow growth from
1000 to 1500, a period of decrease from year 1500 to 1700, and a period of
rapid growth from 1700 to 1780.
Quantitatively,
compared with HYDE3.2, the cropland area of this paper is smaller before 1700
and higher after 1700. The reasons for these distinctions are as follows:
(1) There is a slight difference in
the amount of per capita cropland between the two datasets. Because historical
documents were used to estimate the per capita cropland in this study, it has
not been used in HYDE3.2. The per capita cropland of HYDE3.2 was projected
based on modern per capita cropland. For example, 0.031 km2/person
and 0.025 km2/person were used as the per capita cropland area in
the years 1000 and 1600, respectively. In contrast, the per capita cropland
area was estimated in the Indian and non-Indian periods in this study,
respectively. Furthermore, the data for per capita cropland area were based on
historical documents.
(2) The method for measuring cropland was different
between the two datasets. In HYDE 3.2, the total cropland area was calculated
by directly multiplying the total population by the per capita cropland area.
Different methods for measuring the cropland amount for the Indian and
colonial periods were used in this study.
(3) To estimate
the amount and distribution of cropland during the Indian period, we considered
that agriculture, fishing, gathering, and hunting were all forms of livelihood
for the Indians. Thus, we used historical documents to determine the
distribution area of the agricultural population. Then, we calculated the
amount of agricultural population based on the population density of the area.
Finally, the cropland area and reclamation rate of each district were
calculated.
|
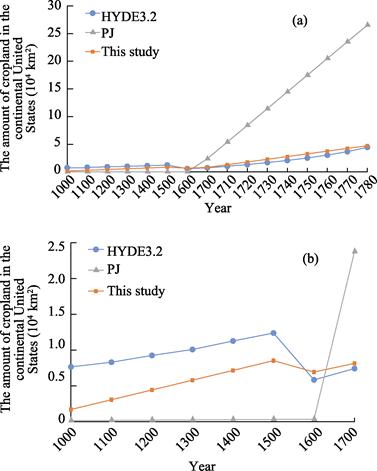
Figure 6 Cropland area in the continental United States from
1000 to 1780 in the dataset
|
(4) We accounted
for the difference in per capita cropland area between Indians and non- Indians
when calculating the cropland area during the colonial period. Therefore, we
calculated the cropland area in the Indian and non-Indian regions. The cropland
area in Indian regions were determined in the same manner as in Indian period.
The per capita cropland area in each colony was multiplied by the amount of
population in that region to obtain the amount of cropland in each colony.
5.2 Conclusion
The amount of cropland in the
continental United States during the 10th to 18th centuries was reconstructed
in this study based on the statistical data, historical documents, and archaeological
data. On this basis, the land reclamation suitability model and cropland allocation model were established. The gridded
cropland data in the continental United States during the 10th to 18th
centuries was reconstructed, with a spatial resolution of 10 km??10 km.
This data showed the characteristics of land reclamation in the continental
United States during the 10th to 18th centuries.
(1) The amount of cropland in the continental United
States increased steadily, rising from 1.71??103 km2 in year
1000 to 4.74??104 km2 in year 1780. It can be divided into
three phases: a slowly increasing period (years 1000–1500), a slowly decreasing
period (years 1500–1700), and a quickly increasing period (years 1700–1780).
(2) The cropland was primarily located in the
south-west and east parts, next to the plains, during Indian periods. The
cropland in Indian region was located in the southeast and southwest parts
during the colonial period with its area rapidly narrowing. In contrast, the cropland was expanded from the initial
north-eastern coastal area to the eastern coastal area in the colonial region
during the colonial period.
Author
Contributions
Zhao, C.
S. and He, F. N. made the overall design for the development of the dataset.
Zhao, C. S., Yang, F., and Wang, Y. F. collected and processed the data. Zhao,
C. S. and Yang, F. designed the model and algorithms. All the authors jointly
wrote and revised the paper.
Conflicts
of Interest
The
authors declare no conflicts of interest.
References
[1]
Turner, B. L., Meyer, W. B.,
Skole, D. L. Global land-use/land-cover change towards an integrated study [J].
Ambio, 1994, 23(1): 91–95.
[2]
Pielke, R. A., Marland, G.,
Betts, R. A., et al. The influence of
land-use change and landscape dynamics on the climate system relevance to
climate change policy beyond the radiative effect of greenhouse gases [J]. Philosophical Transactions of the Royal
Society A Mathematical Physical and Engineering Sciences, 2002, 360(1797):
1705–1719.
[3]
Foley, J. A., Defries, R.,
Asner, G. P., et al. Global
consequences of land use [J]. Science,
2005, 309(5734): 570–574. DOI: 10.1126/science. 1111772
[4]
Arneth, A., Sitch, S.,
Pongratz, J. Historical carbon dioxide emissions caused by land-use changes are
possibly larger than assumed [J]. Nature
Geoscience, 2017, 10 (2): 79–84.
[5]
Gaillard, M. J., Morrison, K.
D., Madella, M., et al. Past land-use
and land-cover change: the challenge of quanitification at the subcontinental
to global scales [J]. Past Land Use and
Land Cover, 2018, 26(1): 1–44.
[6]
Gaillard, M. J. LandCover6K:
global anthropogenic land-cover change and its role in past climate [J]. Past
Global Changes Magazine, 2015, 23(1): 38–39.
[7]
Klein Goldewijk, K., Beusen,
A., Doelman, J., et al. Anthropogenic
land use estimates for the holocene: HYDE3.2 [J]. Earth System Science Data, 2017, 9(2): 927–953.
[8]
Ramankutty,
N. Global Cropland and Pasture Data from 1700–2007 [D]. Montreal: McGill
University Press, 2012.
[9]
Pongratz, J., Reick, C.,
Raddatz, T., et al. A reconstruction
of global agricultural areas and land cover for the last millennium [J]. Global Biogeochemical Cycles, 2008,
22(3): 1–16.
[10] Kaplan, J. O., Krumhardt, K. M., Ellis, E. C., et al. Holocene carbon emissions as a result of anthropogenic land
cover change [J]. The Holocene, 2011,
21(5): 775–791.
[11] Fang, X. Q., Zhao, W. Y., Zhang, C. P., et al. Methodology for credibility assessment of historical global
LUCC datasets [J]. Science China Earth
Sciences, 2020, 50(7): 149–160.
[12] He, F. N., Li, S. C., Zhang, X.
Z., et al. Comparisons of cropland
area from multiple datasets over the past 300 years in the traditional
cultivated region of China [J]. Journal
of Geographical Sciences, 2013, 23(6): 978–990.
[13] He, F. N., Li, S. C., Yang, F., et
al. Evaluating the accuracy of Chinese pasture data in global historical
land use datasets [J]. Science China
Earth Sciences, 2018, 61(11): 1685–1696.
[14] Yang, F., He, F. N., Li, M. J., et
al. Evaluating the reliability of global historical land use scenarios for
forest data in China [J]. Journal of
Geographical Sciences, 2020, 30(17): 1083–1094.
[15]
Kaplan,
J. O., Krumhardt, K. M., Gaillard, M. J., et
al. Constraining the deforestation history of Europe: evaluation of
historical land use scenarios with pollen-based land cover reconstructions [J].
Land, 2017, 6(4): 1–20.
[16] Leite, C. C. , Costa, M. H., Soares-Filho, B. S., et al. Historical land use change and
associated carbon emissions in Brazil from 1940 to 1995 [J]. Global Biogeochemical Cycles, 2012,
26(2): 1–13.
[17] Waisanen, P. J., Bliss, N. B. Changes in population and agricultural
land in conterminous United States counties, 1790 to 1997 [J]. Global Biogeochemical Cycles, 2002, 16(4):
84-1–84-19. DOI: 10.1029/2001GB001843.
[18] Steyaert, L. T., Knox, R. G. Reconstructed historical land cover and
biophysical parameters for studies of land -atmosphere interactions within the
eastern United States [J]. Journal of
Geophysical Research Atmospheres, 2008, 113(D2): 194–204.
[19]
Rhemtulla,
J. M., Mladenoff, D. J., Clayton, M. K. Legacies of historical land use on
regional forest composition and structure in Wisconsin, USA
(mid-1800s-1930s-2000s) [J]. Ecological
Applications, 2009, 19(4): 1061–1078.
[20] Zumkehr, A., Campbell, J. E., et
al. Historical U.S. Cropland areas and the potential for bioenergy
production on abandoned croplands [J]. Environmental
Science and Technology, 2013, 47(8): 3840–3847.
[21] Yu, Z., Lu, C. Historical cropland expansion and abandonment in the
continental U.S. during 1850 to 2016 [J]. Global
Ecol Biogeogr, 2018, 27(3): 322–333.
[22] Zhao, C. S., He, F. N., Yang, F., et al. Dataset of land reclamation of United States of American
during 1000–1780 [J/DB/OL]. Digital
Journal of Global Change Data Repository, 2022. https://doi.org/10.3974/ geodb.2022.02.04.V1.
https://cstr.escience.org.cn/CSTR:20146.11.2022.02.04.V1.
[23] GCdataPR Editorial Office. GCdataPR data sharing policy [OL].
https://doi.org/10.3974/dp.policy.2014.05 (Updated 2017).
[24] McEvedy, C., Jones, R. Atlas of World Population History [M].
Penguin Books Ltd., London. 1978.
[25] Ubelaker, D. H. North American Indian Population Size, A.D. 1500 to
1985 [J]. American Journal of Physical
Anthropology, 1988, 77: 289–294.
[26] Mooney, J. Population [M]. In FW Hodge (ed.): Handbook of American
Indians North of Mexico. Bureau of American Ethnology, Bulletin 30, Part 2.
Washington DC, 1910.
[27] Snow, D. R. Microchronology and demographic evidence relating to the
size of pre-columbian north american Indian populations [J]. Science, 1995, 268(5217): 1601.
[28] Liu, H., Gong, P., Wang, J., et
al. Annual Dynamics of Global Land Cover and its Long-term Changes from
1982 to 2015 [J]. Earth System Science
Data, 2020, 12(2): 1217–1243.
[29] Alvin, M., Josephy, Jr. 1968. The Indian Heritage of America [M].
Jia, S. H. Trans. Taibei, China: The Commercial Press, Ltd.
[30] Li, J. M. A General History of the United States, VOL.1, Laying the
Foundation of the United States 1585–1775 [M]. Beijing, People??s Publishing
House of China, 2002.
[31] John, T. S. A History of American Farming, 1607–1972 [M]. Gao T,
Song P, Zhu R, Trans. Beijing: Agricultural Press of China, 1975.
[32]
Zhang,
C. P. Development of a gridded allocation algorithm of historical cropland
derived from the physiogeographic factors—A
case study of China (in Chinese) [D]. Beijing: Beijing Normal University, 2020.