A July–August Mean-Temperature Dataset Reconstructed based
on the Maximum Latewood Density of Hailar Pine in the North Greater Khingan
Mountains (1781–2013)
Li, M. Q.1* Lan, Y.2
1. Key Laboratory of Land Pattern and Simulation, Institute
of Geographic Sciences and Natural Resources Research, Chinese Academy of
Sciences, Beijing 100101, China;
2. Guangdong Meteorological
Observatory, Guangdong, Guangzhou 510640, China
Abstract: Tree-ring cores (10 mm) of Hailar pine
(Pinus sylvestris var. mongolica) were collected at the upper
tree lines (51.79??N, 123.08??E, 950 m a.s.l.) from the
Huzhong National Nature Reserve in the north Greater Khingan Mountains in
September 2013. The maximum latewood density (MXD) was obtained using a DENDRO
2003 densimeter and an MXD chronology
was developed. A correlation
analysis was carried out between the MXD chronology and climate variables from
the Mohe meteorological station, and the strongest correlation was found with
the July–August mean temperature. Therefore, the July–August mean temperature
was reconstructed back to 1781 A.D. for the north Greater Khingan Mountains.
The reconstruction explained 31.1%
of the variance in the instrumental period (1959–2013 A.D.). The dataset
includes: (1) the geolocation of the sampling site; (2) tree-ring MXD
standard chronology; (3) reconstructed July–August temperature series from
1781 to 2013 in the north Greater Khingan Mountains and 11-year smoothing-average
data; (4) statistics of 39 raw tree-ring MXD measurements. The dataset is
archived in .shp and .xlsx data formats, and it consists of nine data files
with a total size of 27.2 KB (this is compressed to one single file with a
size of 24 KB).
Keywords: tree rings; maximum latewood density; North
Greater Khingan Mountains; temperature reconstruction
DOI: https://doi.org/10.3974/geodp.2022.03.09
CSTR: https://cstr.escience.org.cn/CSTR:20146.14.2022.03.09
Dataset Availability Statement:
The dataset
supporting this paper was published and is accessible through the Digital Journal of
Global Change Data Repository at: https://doi.org/10.3974/geodb.2022.04.02.V1
or https://cstr.escience.org.cn/CSTR:20146.11.2022.04.02.V1.
1 Introduction
Tree-ring is an important proxy for studying paleoclimate
due to its accurate dating, high resolution, wide distribution, and good
replication[1]. It is playing an important role in reconstructing
temperature[2], precipitation, and dry/wet variations[3–5]
on centennial to millennial timescales. Among the tree-ring data used for
climate reconstruction, the maximum latewood density (MXD) is a well-known
proxy for summer or early-fall temperatures[6–9]. Northeast China is
one of the three major forest areas in China, and it has an area of more than
30 million hectares[10]. In addition, it is a major agricultural
region, and its production of grain was 20.26% of the national total in 2018[11].
Temperature is an important factor affecting agriculture and forest production.
Therefore, studying historical temperature variations and exploring the regular
pattern of climate change in Northeast China is of great significance for
guiding agricultural and forestry production.
MXD
data have been used for studying temperature variations in the Greater Khingan
Mountains[12]. However, there have been few MXD-based
reconstructions, and the reconstruction span in our study area is currently
less than 200 years. The purpose of this study was thus to reconstruct a
233-year temperature record based on MXD standard chronology from Pinus
sylvestris var. mongolica in the north Greater Khingan Mountains,
Northeast China (Figure 1 and Table 1). This will provide basic data
for predicting future climate-change scenarios and for guiding agriculture and
forest production.
Table 1 Location
of sampling site
|
Location
|
Longitude
|
Latitude
|
Altitude
|
|
Huzhong National Nature Reserve, Heilongjiang province
|
123.08??E
|
51.79??N
|
950 m
|
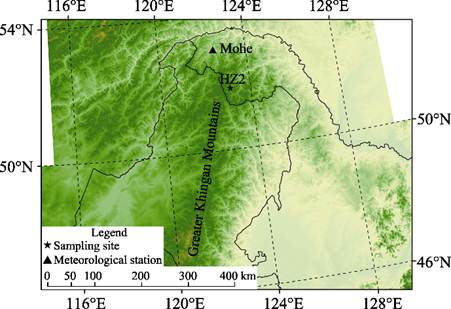
Figure 1 Map showing the locations of the sampling site and the
meteorological station
2 Metadata of
the Dataset
The metadata of the Reconstruction dataset of yearly
July-August mean temperature from tree-ring maximum latewood density of Pinus sylvestris var. mongolica at North Greater Khingan
Mountains (1781-2013) is summarized in Table 2[13]. It
includes the dataset full name, short name, authors, year of the dataset,
temporal resolution, data format, data size, data files, data publisher, and
data sharing policy, etc.
3 Methods
3.1 The
MXD Chronology Development and Temperature Reconstruction
The MXD standard chronology was developed using the ARSTAN
software package. Each MXD series of tree-ring measurements was fitted with an
80 cubic smoothing spline to remove the non-climatic trends[15].
Each detrended index series was calculated as the ratio of the tree-ring value
to the corresponding spline curve value of a given year, by which the
densitometry series were transformed to dimensionless time series. All index
series of tree-ring data from the site were then averaged to form a mean MXD
chronology using a bi-weight robust mean value function[16].
To investigate the tree-growth–climate relationship, we
calculated Pearson??s correlation coefficients between the MXD standard
chronology (x) and climatic variables (y) (monthly mean
temperature and monthly precipitation) from the Mohe meteorological station
during the instrumental period of 1959–2013. The results indicated that the July–August
mean temperature is the major factor limiting tree growth. The correlation
coefficients (r) were calculated using the equation:
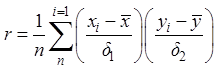 (1)
(1)
where ?? is the standard error.
Based on the tree-growth–climate relationship, a linear
regression produced a transfer function between the MXD standard chronology
(MXD) and the July–August mean temperature (Tmean7–8). We
then reconstructed the regional temperature series. The following equation was
used for this calculation:
Tmean7−8 = aMXD + b
(2)
where a and b are constants.
3.2 Data
Collection and Processing
We collected 61 tree-ring cores from 28 Pinus sylvestris
var. mongolica trees at the study site (51.79??N, 123.08??E, 950 m a.s.l.) in Huzhong National Nature
Reserve from the north Greater Khingan Mountains in September 2013. In the
tree-ring laboratory of the Institute of Geographic Sciences and Natural
Resources Research, Chinese Academy of Sciences, all cores were carefully
cross-dated after air drying and sanding; we selected 39 tree-ring cores from
22 trees for temperature reconstruction. The tree-ring widths were measured
using LinTab, and the tree-ring density data were measured using a DENDRO 2003
densimeter. We then developed the MXD chronology based on this tree-ring
density data. In addition, we also collected the instrumental data from the
Mohe meteorological station
and analyzed the correlations between these data and the MXD chronology to find
the major limiting factor for MXD in Pinus sylvestris var. mongolica.
Based on the tree-growth–climate relationship, we reconstructed the past
temperature series in our study area. A flowchart for this process is shown in
Figure 2.
4 Data Results and Validation
4.1 Data
Composition
The dataset comprises the following parts: (1) the
geolocation of the sampling site; (2) statistics
Table 2 Metadata
summary of the Reconstruction dataset of yearly July-August mean temperature
from tree-ring maximum latewood density of Pinus
sylvestris var. mongolica at
North Greater Khingan Mountains (1781-2013)
|
Items
|
Description
|
|
Dataset
full name
|
Reconstruction
dataset of yearly July-August mean temperature from tree-ring maximum latewood
density of Pinus sylvestris var. mongolica at North Greater Khingan
Mountains (1781-2013)
|
|
Dataset
short name
|
NGKM_MXD_Tem0708_1781-2013
|
|
Authors
|
Li,
M. Q. GLU-2022-9912, Institute of Geographic
Sciences and Natural Resources Research, Chinese Academy of Sciences, limq@igsnrr.ac.cn
Lan,
Y., Guangdong Meteorological Observatory, chinalanyu12@163.com
|
|
Geographical
region
|
North
Greater Khingan Mountains, China
|
|
Year
|
1781–2013
|
|
Temporal
resolution
|
Year
|
|
Data
format
|
.shp,
.xlsx
|
|
|
|
Data
size
|
27.2 KB
|
|
|
|
Data
files
|
(1) geolocation
of the sampling site; (2) tree-ring MXD standard chronology; (3)
reconstructed July–August temperatures from 1781 to 2013 in the North Greater
Khingan Mountains and 11-year smoothing-average data; (4) statistics of 39
raw tree-ring MXD measurements
|
|
Foundation
|
Ministry
of Science and Technology of P.R.China (2017YFA0603302)
|
|
Data
publisher
|
Global Change Research Data Publishing &
Repository, http://www.geodoi.ac.cn
|
|
Address
|
No.
11A, Datun Road, Chaoyang District, Beijing 100101, China
|
|
Data
sharing policy
|
Data from
the Global Change Research Data Publishing & Repository includes metadata, datasets
(in the Digital Journal of Global Change Data Repository), and
publications (in the Journal of Global Change Data & Discovery). Data sharing policy
includes: (1) Data are openly available and can be free downloaded via the
Internet; (2) End users are encouraged to use Data subject to
citation; (3) Users, who are by definition also value-added service providers,
are welcome to redistribute Data subject to written permission
from the GCdataPR Editorial Office and the issuance of a Data redistribution
license; and (4) If Data are used to compile new datasets,
the ??ten per cent principal?? should be followed such that Data
records utilized should not surpass 10% of the new dataset contents, while
sources should be clearly noted in suitable places in the new dataset[14]
|
|
Communication and searchable system
|
DOI, CSTR, Crossref, DCI,
CSCD, CNKI, SciEngine, WDS/ISC, GEOSS
|
|
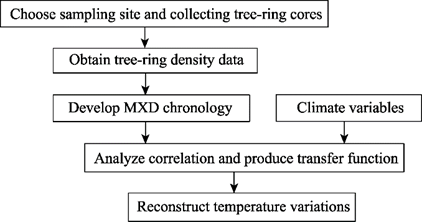
Figure 2 Flow
chart showing the procedure that was used to develop the dataset
|
of
39 raw tree-ring MXD measurements (Table 3); (3) tree-ring MXD standard
chronology (Figure 3); (4) reconstructed July–August
temperature from 1781 to 2013 in North Greater Khingan Mountains and 11-year smoothing-average data
(Figure 4).
4.2 Data
Products and Validation
The MXD standard
chronology covers the period 1722–2013 A.D. (Figure 3). The period
1901–2000 A.D., as common period, was analyzed when we developed the MXD
standard chronology. The mean inter-series correlation coefficient is 0.408,
the mean correlation coefficients within trees and between trees are 0.560 and
0.406, respectively. The signal-to-noise ratio is 22.09. In addition, the
expressed population signal is 0.957. These statistics are similar to those of
other tree-ring chronologies in our study area[12], and the results
indicate that the chronology can be used for
Table 3 Statistics
of 39 raw tree-ring MXD measurements
|
No.
|
Core code
|
Beginning year
|
Ending year
|
Span (year)
|
Average MXD (g/cm3)
|
Standard error (g/cm3)
|
|
1
|
HZ01A
|
1782
|
1892
|
111
|
8.15
|
0.96
|
|
2
|
HZ01B
|
1778
|
2013
|
236
|
6.77
|
1.49
|
|
3
|
HZ02A
|
1735
|
2013
|
279
|
5.98
|
1.40
|
|
4
|
HZ02B
|
1743
|
2013
|
271
|
7.58
|
1.29
|
|
5
|
HZ03A
|
1804
|
2013
|
210
|
8.23
|
2.13
|
|
6
|
HZ03B
|
1722
|
2013
|
292
|
5.60
|
1.27
|
|
7
|
HZ04A
|
1862
|
2013
|
152
|
9.07
|
1.78
|
|
8
|
HZ04B
|
1862
|
2013
|
152
|
7.74
|
2.59
|
|
9
|
HZ05A
|
1804
|
1854
|
51
|
9.69
|
0.97
|
|
10
|
HZ07A
|
1900
|
2013
|
114
|
9.39
|
1.13
|
|
11
|
HZ08A
|
1781
|
2013
|
233
|
6.94
|
2.10
|
|
12
|
HZ08B
|
1792
|
2013
|
222
|
6.31
|
1.40
|
|
13
|
HZ16A
|
1805
|
2000
|
196
|
7.29
|
1.50
|
|
14
|
HZ16B
|
1750
|
2013
|
264
|
7.56
|
1.75
|
|
15
|
HZ22A
|
1790
|
1998
|
209
|
7.97
|
1.40
|
|
16
|
HZ22B
|
1817
|
2013
|
197
|
7.65
|
1.44
|
|
17
|
HZ23B
|
1855
|
2005
|
151
|
8.70
|
1.40
|
|
18
|
HZ24A
|
1837
|
2013
|
177
|
7.27
|
1.64
|
|
19
|
HZ24B
|
1847
|
2013
|
167
|
6.90
|
2.10
|
|
20
|
HZ25A
|
1864
|
2013
|
150
|
7.96
|
1.28
|
|
21
|
HZ25B
|
1850
|
2013
|
164
|
7.34
|
1.12
|
|
22
|
HZ26A
|
1842
|
2005
|
164
|
7.81
|
0.89
|
|
23
|
HZ26B
|
1854
|
2013
|
160
|
7.28
|
1.15
|
|
24
|
HZ27A
|
1798
|
2013
|
216
|
6.28
|
1.53
|
|
25
|
HZ27B
|
1803
|
1996
|
194
|
6.30
|
1.37
|
|
26
|
HZ28A
|
1781
|
1930
|
150
|
5.78
|
1.43
|
|
27
|
HZ28B
|
1768
|
2013
|
246
|
5.88
|
1.97
|
|
28
|
HZ30A
|
1789
|
2013
|
225
|
7.91
|
1.22
|
|
29
|
HZ30B
|
1793
|
2013
|
221
|
7.29
|
1.36
|
|
30
|
HZ31A
|
1808
|
2013
|
206
|
7.04
|
1.81
|
|
31
|
HZ31B
|
1800
|
2013
|
214
|
6.82
|
1.52
|
|
32
|
HZ34A
|
1803
|
2008
|
206
|
8.80
|
0.90
|
|
33
|
HZ34B
|
1828
|
2013
|
186
|
8.60
|
1.16
|
|
34
|
HZ38A
|
1832
|
1944
|
113
|
9.22
|
1.19
|
|
35
|
HZ38B
|
1852
|
1977
|
126
|
8.69
|
1.40
|
|
36
|
HZ39A
|
1828
|
2013
|
186
|
8.22
|
1.37
|
|
37
|
HZ39B
|
1836
|
2011
|
176
|
7.96
|
1.56
|
|
38
|
HZ52A
|
1808
|
2012
|
205
|
7.24
|
1.62
|
|
39
|
HZ54B
|
1801
|
2012
|
212
|
7.64
|
1.40
|
paleoclimate
analysis. The subsample signal strength exceeded 0.85 in 1781 with seven cores.
Therefore, we considered 1781 as the beginning year for reconstruction.
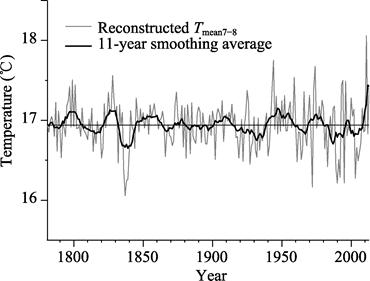
Based on the
relationships between the MXD chronology and climate variables, we reconstructed
the July–August mean temperature during the period 1781–2013 A.D. in the north
Greater Khingan mountains (Figure 4). The transfer function is Tmean7–8 =
3.46MXD + 13.5, and the model explained 31.1% of the variance in
July–August mean temperature with good ??leave-one-out?? cross-validation results
during the instrumental period 1959–2013. The sign test result was
statistically significant at the 0.01 level for the original data. The value of
the reduction of error (RE) and product mean t-test results were found
to be high, suggesting good estimation ability, with the correlation as 0.52
(n = 55, p < 0.01). Split-period validations were
also conducted. The calibration periods were set to be 1959–1988 and 1984–2013,
and the validation periods were 1989–2013 and 1959–1983, respectively. The
results showed that RE (0.279 and 0.319) and the coefficient of error (0.278
and 0.315) were above zero, although the sign-test result was just statistically
significant at the 0.01 level for the original data for the calibration period
1959–1988. Furthermore, the correlation coefficients between the reconstructed
series and the instrumental data were 0.59 and 0.58 for the validation periods
1989–2013 and 1959–1983. The validation results suggest that the model is
relatively robust with sufficient skills of estimation, and the MXD standard
chronology can thus be used for regional climate reconstruction.
|

|
|
|
Figure 3 the tree-ring maximum latewood
density chronology
|
Figure 4 Reconstructed
July–August mean
temperatures and 11-year smoothing average from the Huzhong National Nature
Reserve
|
5 Discussion and Conclusion
In
this study, we obtained tree-ring density data and developed an MXD chronology
based on incremental cores collected from Pinus sylvestris var. mongolica
on the Huzhong National Nature Reserve in the north Greater Khingan Mountains,
Northeast China. Based on the relationship between the MXD chronology and
climate variables, we reconstructed the July–August mean temperature for a
period of 233 years in our study area, covering 1781–2013 A.D. with a temporal
resolution of one year. This study increases the number and spatial
distribution of climate-reconstruction sites. It also provides base data for
understanding past climate change, exploring the regular pattern of climate
change, and predicting future climate-change scenarios.
Author Contributions
Li, M. Q.
designed the algorithms for the dataset. Li, M. Q. and Lan, Y. contributed to
the data processing and analysis. Li, M. Q. wrote the manuscript.
Conflicts of Interest
The
authors declare no conflicts of interest.
References
[1]
Fritts, H. C. Tree Rings and
Climate [M]. London: Academic Press, 1976.
[2]
Liang, E. Y., Shao, X. M., Qin,
N. S. Tree-ring based summer temperature reconstruction for the source region
of the Yangtze River on the Tibetan Plateau [J]. Global and Planetary Change,
2008, 61(3/4): 313-320.
[3]
Shao, X. M., Huang, L., Liu, H.
B., et al. Reconstruction of precipitation variation from tree rings in
recent 1000 years in Delingha, Qinghai [J]. Science in China Series D-Earth
Sciences, 2005, 48(7): 939-949.
[4]
Cook, E. R., Anchukaitis, K.
J., Buckley, B. M., et al. Asian Monsoon Failure and megadrought during
the last millennium [J]. Science, 2010, 328(5977): 486-489.
[5]
Yu, J., Shah, S., Zhou, G., et
al. Tree-ring-recorded drought variability in the Northern Daxing??anling
Mountains of Northeastern China [J]. Forests, 2018, 9(11): 674. DOI: 10.3390/f9110674.
[6]
Hughes, M. K., Schweingruber,
F. H., Cartwright, D., et al. July-August temperature at edinburgh
between 1721 and 1975 from tree-ring density and width data [J]. Nature,
1984, 308(5957): 341-344.
[7]
Jacoby, G. C., Ivanciu, I. S.,
Ulan, L. D. A 263-year record of summer temperature for Northern Quebec
reconstructed from tree-ring data and evidence of a major climatic shift in the
early 1800s [J]. Palaeogeography Palaeoclimatology Palaeoecology, 1988, 64(1/2): 69-78.
[8]
Briffa, K. R., Jones, P. D.,
Bartholin, T. S., et al. Fennoscandian summers from AD 500 temperature
changes on short and long timescales [J]. Climate Dynamics, 1992, 7: 111-119.
[9]
Li, M., Huang, L., Yin, Z. Y., et
al. Temperature reconstruction and volcanic eruption signal from tree-ring
width and maximum latewood density over the past 304 years in the southeastern
Tibetan Plateau [J]. International
Journal of Biometeorology, 2017, 61(11): 2021-2032.
[10]
Bai, W., Wang, Z. On
Sustainable forest management in forest areas of Northeast China [J]. Forest Resources Management, 2008(6): 1-7.
[11]
Tang, L., Wu, D., Miao, W., et al. Sustainable development of food
security in Northeast China [J]. Engineering
Sciences, 2019, 21(5): 19-27.
[12]
Sun, Y., Wang, L. L., Chen, J.,
et al. Reconstructing mean maximum temperatures of May-August from
tree-ring maximum density in North Da Hinggan Mountains, China [J]. Chinese
Science Bulletin, 2012, 57(16): 2007-2014.
[13] Li, M. Q., Lan, Y. Reconstruction dataset of yearly July-August mean
temperature from tree-ring maximum latewood density of Pinus sylvestris var. mongolica
at North Greater Khingan Mountains (1781-2013) [J/DB/OL]. Digital
Journal of Global Change Data Repository, 2022.
https://doi.org/10.3974/geodb.
2022.04.02.V1. https://cstr.escience.org.cn/CSTR:20146.11.2022.04.02.V1.
[14]
GCdataPR Editorial Office.
GCdataPR data sharing policy [OL]. https://doi.org/10.3974/dp.policy.2014.05
(Updated 2017).
[15]
Cook, E. R., Briffa, K. R.,
Meko, D. M., et al. The segment length curse in long tree-ring
chronology development for paleoclimatic studies [J]. Holocene, 1995,
5(2): 229-237.
[16]
Cook, E. R. A time series
analysis approach to tree ring standardization [D]. Tucson: The University of
Arizona, 1985.