Dechlorane Dataset in Polar Regions (2012-2014)
Na, G. S.1* Li, R. J.1 Lu, Z. H.1 Gao, H.1 Zhang, J.2 Wang, Z.1 Ge, L. K.1 Yao, Z. W.1
1. Key Laboratory for Ecological Environment in Coastal Areas, National Marine Environmental Monitoring Center, Dalian 116023, China;
2. Polar Research Institute of China, Shanghai 200136, China
Abstract: In recent years, dechloranes have been detected in natural environments around the world. However, public and scientific understanding and knowledge of dechloranes in remote regions such as the Arctic and Antarctic remains lacking. Thus, surface seawater, snow, lake water, soil, plant and air samples were collected from Ny-Ålesund in the Arctic and the Fildes Peninsula in the Antarctic in order to investigate the concentrations of five individual dechloranes. This investigation is expected to provide a publicly available database that details the distribution of dechlorane pollution in the Arctic and Antarctic. Dechlorane accumulation trends and distribution and composition characteristics throughout the Arctic and Antarctic can be assessed using this data base.
Keywords: dechloranes; medium; Arctic; Antarctic
1 Introduction
Dechloranes (Decs) are highly chlorinated flame retardants that are used extensively in industrial and consumer products, including electronic equipment, textiles, furniture, and automobiles[1]. Like most persistent organic pollutants (POPs), Dechlorane Plus (DP), for example, exhibits stability and degradation-resistance[2–3]. As a direct consequence, Decs can accumulate and be transferred extensively between multi-medium environments[4,5]. Because of this, Decs have become a ubiquitous contaminant and pose pre-eminent environmental challenges[6–9]. In recent years, Decs have been listed in the Oslo/Paris convention for the Protection of the Marine Environment of the North-East Atlantic (OSPAR) priority controlled chemicals list. Thus, a systematic investigation of Decs in the environment is needed.
Recent research has revealed that Decs appear in the air of polar regions, which suggests that they are a global pollutant[10]. However, relatively limited information is available regarding the occurrence and distribution of Decs in various media within polar regions. The present study investigated the Fildes Peninsula, which is located in the largest ice-free area in the southwest of King George Island in the Antarctic, and Ny-Ålesund in the Kongsfjorden Inlet on the west coast of Spitsbergen in the Arctic, where the natural ecology is well preserved and minimally disturbed. The aim of this investigation was to systematically assess Decs pollution levels and to provide publicly available data regarding their concentrations in various media in the Arctic and Antarctic.
2 Metadata of Dataset
Descriptions of the distribution of dechloranes in various media within typical Arctic and Antarctic areas (2012-2014) (Dechloranes Data_Arctic and Antarctic_2012-2014) were recorded[11]. The information includes the dataset name, geographical region, spatial and temporal resolutions, format and data size, data publisher and so on. Table 1 and Table 2 summarize the primary metadata elements of the Dechloranes Data_Arctic and Antarctic_2012-2014 datasets.
Table 1 Author information
|
|
Name of author
|
Researcher ID
|
Email
|
Organization
|
|
1
|
Na, G. S.
|
A-3185-2017
|
gsna@nmemc.org.cn
|
Key Laboratory for Ecological Environment in Coastal Areas, National Marine Environmental Monitoring Center
|
|
2
|
Li, R. J.
|
A-3183-2017
|
liruijing158@163.com
|
|
3
|
Lu, Z. H.
|
K-8964-2015
|
luzihao1990209@outlook.com
|
|
4
|
Gao, H.
|
A-3207-2017
|
hgao@nmemc.org.cn
|
|
5
|
Zhang, J.
|
L-4784-2016
|
zhangjie@pric.gov.cn
|
Polar Research Institute of China
|
|
6
|
Wang, Z.
|
A-3212-2017
|
zwang@nmemc.org.cn
|
Key Laboratory for Ecological Environment in Coastal Areas, National Marine Environmental Monitoring Center
|
|
7
|
Ge, L.K.
|
A-3228-2017
|
lkge@nmemc.org.cn
|
|
8
|
Yao, Z. W.
|
A-3238-2017
|
zwyao@nmemc.org.cn
|
3 Materials and Methods
3.1 Sampling and Preparation
In this study, 8 seawater, 12 soil, 8 plant, and 12 air samples were collected in the Arctic in 2012, and 10 seawater, 23 soil, 21 plant, 12 air, 8 snow, and 4 lake water samples were collected in the Antarctic in 2014. The sampling stations are shown in Figure 1 and Figure 2. Concurrent surface seawater and sediment sampling were conducted in the Fildes Peninsula and Ny-Ålesund. Surface soil (upper 5 cm) and plants were collected simultaneously. Gaseous phase atmospheric samples were collected using polyurethane foam. The average temperature during sampling was 5 °C. All samples were kept in aluminum foil and stored at -20 °C after sampling. Soil and plant samples were freeze-dried, ground, and sieved (80 mesh) prior to analysis.
3.2 Materials
Dec 602 (95%), Dec 603 (98%), and Dec 604 (95%) were purchased from Toronto Research Chemical Inc. (Ontario, Canada). A standard mixture of DP, which contained syn- and
Table 2 Metadata summary of the Dechlorane dataset in polar regions (2012-2014)
|
Items
|
Description
|
|
Dataset full name
|
Dechloranes in multi-medium dataset from sample areas in the Arctic and Antarctic
|
|
Dataset short name
|
Dechloranes_Arctic_Antarctic
|
|
Geographic region
|
78°53′22.31²N-78°59′17.40²N, 11°35′53.00²E-12°22′20.40²E in the Arctic and 62°10.435′S- 62°13.748′S, 58°54.613′W-59°00.879′W
|
|
Time
|
2012.07.07-2012.07.28 in the Arctic and 2014.1.13-2014.2.27 in the Antarctic
|
|
Spatial resolution
|
3 m
|
|
Data format
|
.zip
|
|
Data size
|
36 KB
|
|
Data publisher
|
Global Change Research Data Publishing & Repository, http://www.geodoi.ac.cn
|
|
Address
|
No.11A, Datun Road, Chaoyang District, Beijing 100101, China
|
|
Foundation(s)
|
National Natural Science Foundation of China (21377032); State Oceanic Administration of P. R. China (2014-02-01, 2014-03-04, 2014-04-01, 2014-04-03; 201105013); Ministry of
Science and Technology of P. R. China (KP201208)
|
|
Data sharing policy
|
Data from the Global Change Research Data Publishing & Repository includes metadata, datasets (data products), and publications (in this case, in the Journal of Global Change Data & Discovery). Data sharing policy includes: (1) Data are openly available and can be free downloaded via the Internet; (2) End users are encouraged to use Data subject to citation; (3) Users, who are by definition also value-added service providers, are welcome to redistribute Data subject to written permission from the GCdataPR Editorial Office and the issuance of a Data redistribution license; and (4) If Data are used to compile new datasets, the ‘ten per cent principal’ should be followed such that Data records utilized should not surpass 10% of the new dataset contents, while sources should be clearly noted in suitable places in the new dataset[12]
|
anti-DP, was obtained from AccuStandard, Inc. (Connecticut, USA). Polychlorinated biphenyl 209 (99%) was acquired from J&K Scientific Ltd. (Beijing, China) for use as an internal standard. All organic solvents used in the study (dichloromethane and n-hexane) were pesticide-grade. Water was purified using a Milli-Q system. Silica, neutral alumina, and anhydrous sodium sulfate were purchased from Merck (Darmstadt, Germany).
3.3 Extraction, Cleanup, and Analysis
Approximately 5 g of soil and plant samples mixed were extracted via accelerated solvent extraction using 50 mL of a hexane/dichloromethane (DCM) (1??1, V/V) mixture. Activated copper powder was added to the sediment and soil extracts to remove elemental sulfur. The seawater samples, C18 sample cartridge, and glass-fiber filter (GFF), were extracted and analyzed separately to obtain information on their respective water and particle phases. Approximately 8.0 L of surface seawater samples were collected at each station. These were got via C18s (water phase) and GFFs (particle phase). The C18 and GFF samples were soaked for 12 h in 50 mL of hexane/DCM (1??1, V/V), and then extracted in an ultrasonic bath for 30 min. The procedure was repeated twice.
Air samples were collected using a high-volume air sampler (HiVol) equipped with a GFF to capture particles and a polyurethane foam (PUF) plug. The HiVol operated at an average flow rate of 1.0 m3/min and the total air volume sampled averaged about 2,880 m3. These samples were Soxhlet-extracted for 24 h using hexane/DCM (1??1, V/V). The raw extracts of all samples were evaporated to 5 mL using a rotary evaporator and then transferred to a multi-layer column filled from the bottom with 2 g of activated silica gel, 4 g of neutral alumina, and 1 cm of anhydrous Na2SO4 (pre-soaked in hexane). The extracts were then eluted with 70 mL of a hexane/DCM (1??1, V/V) mixture and were further evaporated under a gentle N2 stream. The sample was solvent-exchanged to n-hexane media (500 μL).
|
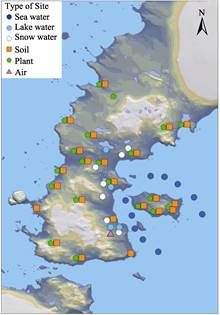
Figure 2 Sampling sites around Ny-Ålesund, Svalbard in the Antarctic used in 2014
|
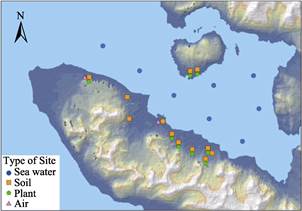
Figure 1 Sampling sites around Ny-Ålesund, Svalbard
in the Arctic in 2012
Decs were analyzed using an Agilent 6890N gas chromatograph coupled to a 59,73I mass spectro-
meter (MS, Agilent Technologies, Inc., California, USA) in negative chemical ionization mode with methane as the ionization gas. The system was fitted with a DB-5HT capillary column (0.25 mm i.d. × 30 m × 0.10 μm film thickness, J&W Scientific, Inc., California, USA). The injection volume was 1.0 μL in splitless mode. Helium was used as the carrier gas, at a flow rate of 1.0 mL/min. The gas chromatography oven was programmed as follows: hold an initial temperature of 80 °C for 2 min, ramp at 20 °C/min to 180 °C, then ramp at 5 °C/min to 250 °C and hold for 2 min, then ramp at 30 °C/min to 310 °C and hold for a final 5 min. The MS transfer line was held at 275 °C. The temperatures of the ion source and quadrupole were 150 °C. The instrument was operated in selected ion monitoring mode (m/z 606.0, 608.2, and 610.0 for Dec 602; m/z 628.0, 630.0, and 634.0 for Dec 603; m/z 569.0, 608.0, and 612.0 for Dec 604; and m/z 646.0, 645.0, and 649.0 for syn- and anti-DP).
4 Data Composition
4.1 Data Products
Two sets of data were collected during this investigation. The data shows the dechlorane distribution in various media within typical areas in the Arctic in 2012 and in the Antarctic in 2014. The 10 files contain information about the dechlorane concentrations in various media. For example, Table 3 shows air sample data, Table 4 and Table 5 are the data collection from the surface seawater in Arctic an Antarctic regions. The ranges and mean concentrations of individual dechloranes and the sum of all 5 dechloranes measured (∑Decs) in Arctic and Antarctic air are shown.
Table 3 Ranges and mean concentrations of total Decs (∑Decs) and individual Decs in air (pg/m3)
|
Decs
|
Matrices
|
Area
|
Mean±SD
|
Range
|
|
Dec 602
|
Air
|
Arctic
|
0.0094±0.0093
|
nd-0.035638
|
|
Antarctic
|
0.023±0.04
|
0.002-0.156
|
|
Dec 603
|
Arctic
|
0.240±0.323
|
0.026-0.940
|
|
Antarctic
|
0.074±0.10
|
0.022-0.352
|
|
Dec 604
|
Arctic
|
1.170±1.000
|
0.277-3.194
|
|
Antarctic
|
4.90±6.30
|
0.924-22.751
|
|
Syn DP
|
Arctic
|
4.569±2.766
|
nd-10.795
|
|
Antarctic
|
3.80±2.75
|
0.503-10.647
|
|
Anti DP
|
Arctic
|
4.932±2.686
|
1.508-11.449
|
|
Antarctic
|
4.00±3.01
|
1.181-11.015
|
|
∑Dechloranes
|
Arctic
|
10.920±5.431
|
3.638-24.692
|
|
Antarctic
|
12.80±8.10
|
3.722-28.061
|
Table 4 Decs (∑Decs) data in Arctic Region (Ny-Ålesund 2012) (media: surface seawater: pg/L)
|
Site
|
Latitude
|
Longitude
|
Dec 602
|
Dec 603
|
Dec 604
|
Syn DP
|
Anti DP
|
|
K1
|
78°59¢17.40"N
|
11°39¢36.00"E
|
nd
|
6.250,000
|
106.250,000
|
103.125,000
|
87.500,000
|
|
K2
|
78°58¢0.00"N
|
11°49¢41.40"E
|
nd
|
nd
|
65.625,000
|
53.125,000
|
28.125,000
|
|
K3
|
78°56¢42.60"N
|
11°59¢7.80"E
|
nd
|
3.125,000
|
43.750,000
|
40.625,000
|
25.000,000
|
|
K4
|
78°55¢28.20"N
|
12° 8¢45.00"E
|
nd
|
3.125,000
|
65.625,000
|
115.625,000
|
37.500,000
|
|
K5
|
78°54¢17.40"N
|
12°17¢48.00"E
|
nd
|
3.125,000
|
25.000,000
|
21.875,000
|
18.750,000
|
|
K6
|
78°56¢0.00"N
|
12°22¢20.40"E
|
nd
|
3.125,000
|
31.250,000
|
250.000,000
|
15.625,000
|
|
K7
|
78°57¢43.80"N
|
12°20¢54.00"E
|
nd
|
nd
|
46.875,000
|
103.125,000
|
34.375,000
|
|
K8
|
78°57¢13.80"N
|
12°10¢0.00"E
|
nd
|
nd
|
40.625,000
|
21.875,000
|
12.500,000
|
Note:“nd”means no Decs.
Table 5 Decs (∑Decs) data in Antarctic Region (Fildes Peninsula 2014) (media: surface seawater: pg/L)
|
site
|
Latitude
|
Longitude
|
Dec 602
|
Dec 603
|
Dec 604
|
Syn DP
|
Anti DP
|
|
G1
|
62°12.678¢S
|
58°57.222¢W
|
23.437,5
|
96.875
|
390.625
|
13.732,5
|
87.5
|
|
G2
|
62°12.969¢S
|
58°56.987¢W
|
54.967,5
|
253.125
|
390.625
|
496.875
|
743.75
|
|
G3
|
62°13.222¢S
|
58°56.878¢W
|
6.53
|
53.125
|
27.307,5
|
32.482,5
|
57.647,5
|
|
G4
|
62°13.436¢S
|
58°56.563¢W
|
8.092,5
|
18.477,5
|
22.62
|
137.5
|
240.46
|
|
G5
|
62°13.680¢S
|
58°55.949¢W
|
14.342,5
|
99.727,5
|
31.995
|
421.875
|
521.875
|
|
A1
|
62°12.226¢S
|
58°56.168¢W
|
9.375
|
47.227,5
|
61.682,5
|
200
|
145.312,5
|
|
A2
|
62°12.250¢S
|
58°55.599¢W
|
9.375
|
29.687,5
|
48.437,5
|
250
|
139.062,5
|
|
A3
|
62°12.397¢S
|
58°55.068¢W
|
9.375
|
59.375
|
118.75
|
1,123.75
|
524.531,25
|
|
A4
|
62°12.658¢S
|
58°54.420¢W
|
3.405
|
28.125
|
125
|
378.125
|
787.5
|
|
A5
|
62°12.985¢S
|
58°54.100¢W
|
0.56
|
15.352,5
|
25.745
|
88.732,5
|
112.335
|
4.2 Data Validation
Various measurements were performed to assess the accuracy and reliability of the data obtained. Field and laboratory blanks (method blanks) were extracted and analyzed in the same manner as field samples. The method detection limits (MDLs) were derived from mean blank values plus three times the standard deviation. For compounds with no blank, MDLs were derived from the instrumental detection limits at a signal-to-noise ratio of 3. The MDLs of Decs ranged from 0.19 to 24.04 pg/g in soil samples, from 0.56 to 13.99 pg/L in seawater samples, from 0.05 to 0.26 pg/g in plant samples, and from 0.002 to 0.171 pg/m3 in atmospheric samples. The mean recoveries of the surrogates ranged from 80% to 113%.
5 Conclusion
The distribution data for dechloranes in various media within typical Arctic and Antarctic areas is useful for evaluation of dechlorane pollution in polar regions. The dechlorane composition characteristics and accumulation trends can be used to analyze the sources and fates of dechloranes in the global cycle.
References
[1] Guerra, P., Fernie, K., Jiménez, B. Dechlorane plus and related compounds in peregrine falcon (Falco peregrinus) eggs from Canada and Spain [J]. Environmental Science & Technology, 2011, 45(4): 1284-1290.
[2] Hoh, E., Zhu, L. Y., Hites, R. A. Dechlorane plus, a chlorinated flame retardant, in the Great Lakes [J]. Environmental Science & Technology, 2006, 40(4): 1184-1189.
[3] Zhu, J. P., Peng, Y. L., Shoeib, M. Detection of dechlorane plus in residential indoor dust in the city of Ottawa, Canada [J]. Environmental Science & Technology, 2007, 41(22): 7694-7698.
[4] Feo, M.L., Barón, E., Eljarrat, E., et al. Dechlorane Plus and related compounds in aquatic and terrestrial biota: a review [J]. Analytical and Bioanalytical Chemistry, 2012, 404(9): 2625-2637.
[5] Xian, Q. M., Siddique, S., Li, T., et al. Sources and environmental behavior of dechlorane plus-A review [J]. Environment International, 2011, 37(7): 1273-1284.
[6] Jia, H. L., Liu, Y. Q., Yang, M. Concentration and bioaccumulation of dechlorane compounds in coastal environment of Northern China [J]. Environmental Science & Technology, 2011, 45(7): 2613-2618.
[7] Ma, W. L., Liu, L. Y., Qi, H., et al. Dechlorane plus in multimedia in northeastern Chinese urban region [J]. Environment International, 2011, 37(1): 66-70.
[8] Qi, H., Liu, L. Y., Jia, H. L., et al. Dechlorane plus
[9] in surficial water and sediment in a Northeastern Chinese River [J]. Environmental Science & Technology, 2010, 44(7): 2305-2308.
[10] Wu, J. P., Zhang, Y., Chen, X. J., et al. Isomer-Specific Bioaccumulation and trophic transfer of dechlorane plus in the freshwater food web from a highly contaminated site, South China [J]. Environmental Science & Technology, 2010, 44(2): 606-611.
[11] Möller, A., Xie, Z. Y., Sturm, R., et al. Large-scale distribution of dechlorane plus in air and seawater from the arctic to antarctica [J]. Environmental Science & Technology, 2010, 44(23): 8977-8982.
[12] Na, G. S., Li, R. J., Lu, Z. H., et al. Dechloranes in multi-medium Dataset from sample areas in the Arctic and Antarctic [DB/OL]. Global Change Research Data Publishing & Repository, 2014. DOI: 10.3974/ geodb. 2014.02.14.V1.
[13] GCdataPR Editorial Office. GCdataPR data sharing policy [OL]. DOI: 10.3974/dp.policy.2014.05 (Updated 2017).