Future Population Estimation Dataset in
Hiroshima (2010-2040)
Chen, W. B.1,2* Doko, T.1,2 Furutani, T.1
1. Graduate School of Media and Governance, Keio University, Fujisawa 2520882, Japan;
2. Nature & Science Consulting Co., Ltd., Naka-ku, Yokohama 2310032, Japan
Abstract: Hiroshima is a capital city of Hiroshima Prefecture, Japan. In 1589, a castle was constructed on a river delta at Goka and it was given the name of Hiroshima. The population was gradually increasing year after year since Hiroshima officially became a city on April 1st, 1889. However, it is shown the tendency that the population would decrease for the future. In general, the total population trends to shrink. In Hiroshima, it is not only the problem of aging population, meanwhile it also face the problem of birth rate decreases. The dataset includes child population in which the age is under 15 years old, elder population in which the age is equal or greater than 65 years old, and total population with time period of 2010-2040. Meanwhile, the administrative boundary of Hiroshima was included in this dataset. The dataset is archived in both .kmz and .shp formats with compressed data size of 1.63 MB.
Keywords: population dataset; mesh data; future population; Hiroshima; Japan; 2010-2040
1 Introduction
Hiroshima is a capital city of Hiroshima Prefecture, Japan. In 1589, a castle was constructed on a river delta at Goka and it was given the name of Hiroshima[1]. Hiroshima officially became a city on April 1st, 1889 with a population of 83,387[1]. The population was gradually increasing year after year. However, the population was suddenly decreased due to the World War II in which the nuclear weapon was dropped on Hiroshima[1–2]. The population of Hiroshima had increased after the World War II, however, our dataset showed the tendency that the population would decrease for the future [3].
To estimate future population of Hiroshima, the 500 meter mesh population dataset of Hiroshima from 2010 to 2040 was developed using mesh CSV data which was created based on the population census by Statistics Bureau, Ministry of Internal Affairs and Communications and National Institute of Population and Social Security Research. Population age composition include child population in which the age is under 15 years old, elder population in which the age is equal or greater than 65 years old, and total population.
2 Metadata of Dataset
The descriptions of the future population data in Hiroshima (2010-2040)[4], “FuturePopulationHiroshima2010-2040” for short, are recorded in Table 1. The metadata of the dataset include the dataset’s full name, short name, authors, spatial and temporal resolution, data format, data size, data publisher and data sharing policy.
Table 1 Summary of the metadata of FuturePopulationHiroshima2010-2040
|
Items
|
Description
|
|
Dataset full name
|
Future population data in Hiroshima (2010-2040)
|
|
Dataset short name
|
FuturePopulationHiroshima2010-2040
|
|
Authors
|
Chen, W. B. L-5715-2016, Keio Research Institute at SFC, Keio University, chenwb3@gmail. com
Doko, T. L-6494-2016, Keio Research Institute at SFC, Keio University, dokochan@sfc.keio. ac.jp
Furutani, T. B-1645-2017, Keio Research Institute at SFC, Keio University, maunz@ sfc.keio.ac.jp
|
|
Geographical region
|
It stretches to a region of 34°36ʹ53ʺ N to 34°17ʹ48ʺ N and 132°41ʹ46ʺ E to 132°10ʹ43ʺ E
|
|
Temporal resolution
|
2010-2040
|
|
Spatial resolution
|
500 m
|
|
Data format
|
.shp, .kmz
|
|
Data Size
|
1.63 MB
|
|
Dataset and data files
|
The dataset consists of four files. They are pop_total, pop_elder, pop_child, and hiroshima_city.
1. pop_total.rar and pop_total.kmz; this is the total population data file of 514 KB
2. pop_elder.rar and pop_elder.kmz; this is the elder population data file of 486 KB
3. pop_child.rar and pop_child.kmz; this is the child population data file of 425 KB
4. hiroshima_city.rar and hiroshima_city.kmz; this is the Hiroshima administrative boundary data file of 244 KB as attached
|
|
Foundation(s)
|
Environment Research and Technology Development Fund (4-1505) of the Ministry of the Environment, Japan
|
|
Data Publisher
|
Global Change Research Data Publishing & Repository, http://www.geodoi.ac.cn
Address: No.11A, Datun Road, Chaoyang District, Beijing 100101, China
|
|
Data sharing policy
|
Data from the Global Change Research Data Publishing & Repository includes metadata, datasets (data products), and publications (in this case, in the Journal of Global Change Data & Discovery). Data sharing policy includes: (1) Data are openly available and can be free downloaded via the Internet; (2) End users are encouraged to use Data subject to citation; (3) Users, who are by definition also value-added service providers, are welcome to redistribute Data subject to written permission from the GCdataPR Editorial Office and the issuance of a Data redistribution license; and (4) If Data are used to compile new datasets, the ‘ten per cent principal’ should be followed such that Data records utilized should not surpass 10% of the new dataset contents, while sources should be clearly noted in suitable places in the new dataset[5]
|
3 Methods
3.1 Data Sources
The source of future population data (2010-2040), which is called “Future-Pop Data Series (Japan)”, is from MicroBase[6]. The Future-Pop Data series provides population census prediction for 500 m mesh of whole Japan, and its coverage of period is 2010 to 2040[7]. The formation of population data is mesh CSV data. The 500 meter mesh data is ShapeFile Data (regional boundaries and mesh grid code) from Shape File Library[8]. The formation of the mesh data is shape file.
3.2 Future Population Estimation
The methodology to estimate the future population was developed and illustrated in the document provided by MicroBase[9]. We summarize the key points of the methodology for the dataset development on “Future-Pop Data Series (Japan)” in the following paragraphs (3.2.1 and 3.2.2).
3.2.1 Procedure of Creating Dataset
Future-Pop Data Series (Japan) were estimated based on the basic data and cohort-component method[10–12] provided by National Institute of Population and Social Security Research.
According to the cohort-component method, estimates are made separately for (1) natural fluctuations due to birth/death, and (2) social change due to migration between entries and exits. Natural fluctuation is estimated based on assumed values obtained from past birth rates and mortality rates by age, and has characteristics that it does not fluctuate greatly in a short period of time. Social changes are almost limited to those caused by turning in and out, like new town development and large-scale population inflow through new railroad construction.
Unlike the conventional method based on net migration rate, the original migration model (corrected net migration model) was used for estimation in order to cope with social change in small areas. In this model, correction for net migration was made according to regional characteristics, in which young people tend to gather in the area where young people gather, elderly people are easy to gather in areas where elderly people gather, depending on sex and age. The compensation for net movement is given. The population tends to concentrate around facilities such as stations, universities and hospitals.
3.2.2 Accuracy of Estimation
As a result of applying the estimation method used for this data to the census before FY 2005 and verifying it at the FY 2010 census, high correlation was confirmed. Excellent results will be confirmed, unless there is local large shift such as the establishment of large condominiums and large nursing home for aged facilities and the opening of new railroads.
|
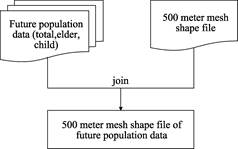
Figure 1 Flowchart of dataset generation
|
3.3 Dataset Generation
The data generation was conducted by ArcMAP© 10.0. First, the 500 meter mesh data was added as shapefile in the ArcMAP, and the CSV population data was added as XY data. The two dataset was joined based on the mesh grid code (see Figure 1). Only the meshes that have the valid population data were kept in the shapefiles.
4 Results
The dataset of future population estimation includes total population, elder population, and child population. Each data recorded the population number from 2010 to 2040. The attributes of each data include city name, mesh grid code, latitude, longitude, year of 2010, 2011, 2012, 2013, 2014, 2015, 2016, 2017, 2018, 2019, 2020, 2021, 2022, 2023, 2024, 2025, 2026, 2027, 2028, 2029, 2030, 2031, 2032, 2033, 2034, 2035, 2036, 2037, 2038, 2039, and 2040. The total and child population decreased, while the elder population increased. Figure 2 are maps to present the special distribution of population in the year of 2010 and 2040. Figure 3 shows the trends of population between 2010 and 2040.

Figure 2 Spatial distribution of Population
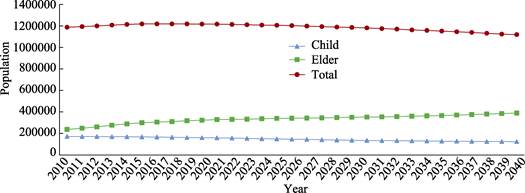
Figure 3 Population trends in Hiroshima (2010-2040)
5 Conclusion
We developed a dataset of future population estimation between 2010 and 2040 in Hirohima. The dataset includes child population in which the age is under 15 years old, elder population in which the age is equal or greater than 65 years old, and total population with time period of 2010-2040. In general, the total population trends to shrink. In Hiroshima, it is not only the problem of aging population, meanwhile it also face the problem of birth rate decreases.
Acknowledgements
This research was supported by the Environment Research and Technology Development Fund (4-1505) of the Ministry of the Environment, Japan.
References
[1] History of Hiroshima [OL]. http://www.city.hiroshima.lg.jp/www/contents/1263790328515/index.html.
[2] Stokes, B. 70 years after Hiroshima, opinions have shifted on use of atomic bomb [OL]. http://www. pewresearch.org/fact-tank/2015/08/04/70-years-after-hiroshima-opinions-have-shifted-on-use-of-atomic-bomb/.
[3] Statistics Bureau, Ministry of Internal Affairs and Communications. 2015 Population Census [Z]. 2015, 50.
[4] Chen, W., Doko, T., Furutani, T. Future population estimation dataset in Hiroshima (2010-2040) [DB/OL]. Global Change Research Data Publishing and Repository, 2017. DOI: 10.3974/geodb.2017.02.01.V1.
[5] GCdataPR Editorial Office. GCdataPR Data Sharing Policy [OL]. DOI: 10.3974/dp.policy.2014.05 (Updated 2017).
[6] MicroBase [OL]. http://microgeodata.com/.
[7] Doko, T., Chen, W., Sasaki, K., et al. An attempt to develop an environmental information system of ecological infrastructure for evaluating functions of ecosystem-based solutions for disaster risk reduction (ECO-DRR) [J]. Remote Sensing Spatial Information Sciences, 2016, (XLI-B8): 43-49. DOI: 10.5194/isprs-archives-XLI-B8-43-2016.
[8] Shape File Data (regional boundaries and mesh grid code) [OL]. http://www.okadajp.org/RWiki/?ShapeFile%E3%83%A9%E3%82%A4%E3%83%96%E3%83%A9%E3%83%AA.
[9] Microbase Co. Ltd. Future-pop data series [OL]. http://microbase.co/futurepop (17 April 2016).
[10] Smith, S. K., Tayman, J., Swanson, D. A., A practitioner’s guide to state and local population projections. In: Land, K. C., (ed). Overview of the cohort-component method [C]. Dordrecht, Netherlands: Springer, 2013, 45-50.
[11] Bowley, A. Births and population in Great Britain [J]. The Economic Journal, 1924, 334: 188-192.
[12] Cannan, E. The probability of a cessation of the growth of population in England and Wales during the next century [J]. The Economic Journal, 1977, 5(20), 505-515. DOI: 10.2307/2956626.