Snow Cover Dataset by Multi-source Data Fusion Algorithm: A
Case Study in the Northwestern United States
Gao, Y. 1 Dong, H. W. 1,2
1. Key Laboratory of Tibetan Environment Changes and Land
Surface Processes, Institute of Tibetan Plateau Research, Chinese Academy of
Sciences??Beijing 100101, China;
2. College of Geodesy and Geomatics, Shandong University of
Science and Technology, Shandong, Qingdao 266590, China
Abstract: A comprehensive
understanding of snow cover is of great significance with respect to the
measurement of changes in snow cover, the development of coping strategies, the
management of regional water resources under continuous climate warming, and
for acquiring a better understanding of climate change at the global level.
Based on the latest MODIS NDSI data, IMS snow/ice data and snow measurements at
192 SNOTEL stations, a suitable NDSI threshold for snow recognition based on
the snow characteristics occurring in the Northwestern United States was
established. Subsequently, various fusion rules based on data performance for
different time periods were formulated. Finally, the snow cover dataset by a
multi-source data fusion algorithm for the Northwestern United States region
(2000–2020)
was developed. A validation study indicated that the data fusion could improve
the accuracy and snow recognition performance compared with the source data.
The dataset included: (1) the boundary data of the test area; (2) the daily
snow cover data of the test area from 2000 to 2020 (spatial resolution 500 m).
In addition, the data for the verification points for snow depth were included.
The formats for storage of the data were .tiff, .shp, .xlsx and .txt, and
consisted of 7,688 data files with a data size of 170 GB (compressed into one
file, 421 MB).
Keywords: snow
cover; multisource data; daily data; 2000–2020; Northwestern United States
DOI: https://doi.org/10.3974/geodp.2022.02.15
CSTR: https://cstr.escience.org.cn/CSTR:20146.14.2022.02.15
Dataset Availability Statement:
The dataset supporting this paper
was published and is accessible through the Digital Journal of Global Change Data Repository
at: https://doi.org/10.3974/geodb.2022.02.08.V1 or
https://cstr.escience.org.cn/CSTR:20146.11.2022.02.08.V1.
1 Introduction
Ninety
eight percent of snow cover throughout the world is distributed in the Northern
Hemisphere, and the maximum snow cover on the land in winter is about 4.7% ?? 107
km2[1], this figure accounting for 50% of the land area of the Northern
Hemisphere[2]. Snow cover in the Northern Hemisphere is distributed
mainly in the Arctic and high-latitude regions. Large amounts of seasonal snow cover also exist in the Alpine mountains near
the Mediterranean[3], mountains in the Northwestern United
States[4], Northeastern China[5], northern
Xinjiang[6] and other regions[7,8]. The area of interest
in the Northwestern United States ranges from 105??W–140??W, 40??N–50??N, and 600–3,100
m a.s.l., and is dominated by crops and grasslands at lower elevations, shrubs
and grasslands at middle elevations, and forests at higher elevations. The snow
cover in the high-altitude regions of the Northwestern United States, is
dominated by the Cordillera and Rocky Mountains, and the area is one of the
main sources of fresh water for Washington, Oregon, Idaho, Nevada, Utah,
Wyoming, and Montana[9]. Continuous warming limits the amount of
seasonal snow cover in the winter, and snow-free or mountains with less snow
will become more common by the second half of this century[10]. The
accumulation of snow and research on snow cover data in the Northwestern United
States is of great practical significance to the management of local water
resources; moreover, this topic holds great scientific significance in
comparative studies of snow cover in the Tibet Plateau which is at similar
latitudes.
Methods for
observation and monitoring of snow include mainly ground observation and remote
sensing measurements. Ground observation can yield accurate and high-precision
data, while remote sensing observations can cover a larger area and obtain more
comprehensive snow information[11]. Optical and microwave radiation
are the most commonly used energy bands for remote sensing observation. The
resolution of snow data obtained by optical remote sensing observation is
relatively high, but surfaces enveloped in cloud cover cannot be observed.
Microwave remote sensing can operate in all-weathers, but the spatial
resolution is low[12]. Multi-source fusion of datasets has become an
effective method to integrate and exploit the advantages of the various data
sources to realize comprehensive and high-precision snow cover data[13–16].
The interactive multisensory snow and ice mapping system (IMS) is one of the
most commonly used fusion data systems[17]. Studies have shown that
the accuracy of the IMS snow/ice data in the Northwestern United States is
lower than that of the MODIS (Moderate-resolution Imaging
Spectroradiometer) snow cover data[18]. In
the present study, we first analyze the characteristics and accuracy of MODIS
and IMS in three stages based on the spatial resolution of the IMS snow/ice
data; then we define a suitable NDSI threshold for snow recognition according
to the snow characteristics in the Northwestern United States; and finally we
formulate various fusion rules based on data performance in different time
periods. Finally, the snow cover dataset provided by a multi-source data fusion
algorithm was developed for a case study which targeted the Northwestern United
States.
2 Metadata of the Dataset
The metadata of the Snow
cover dataset by multi-source data fusion algorithm—a case study in the
Northwestern United States[19] is summarized in Table 1. It includes the
dataset full name, short name, authors, year of the dataset, temporal
resolution, spatial resolution, data format, data size, data files, data
publisher, and data sharing policy, etc.
Table
1 Metadata summary of the Snow cover
dataset by multi-source data fusion algorithm—a case study in the Northwestern
United States
|
Items
|
Description
|
|
Dataset full name
|
Snow cover dataset by multi-source data fusion algorithm—a case
study in the Northwestern United States
|
|
Dataset short name
|
SnowCoverTest_2000-2020
|
|
Authors
|
Gao, Y.
AFX-6602-2022, Institute of Tibetan Plateau Research, Chinese Academy of
Sciences, yanggao@itpcas.ac.cn
Dong, H. W.,
Shandong University of Science and Technology, donghw@itpcas.ac.cn
|
|
Geographical region
|
The Northwestern
United States
|
|
Year
|
2000–2020
|
|
Temporal
resolution
|
1 day
|
|
Spatial
resolution
|
500 m
|
|
Data formats
|
.tif, .shp,
.xlsx, .txt
|
|
Data size
|
170 GB??Compressed into 1
file of 421 MB??
|
|
Data files
|
Boundary data of
test area; binary dataset for snow; data for verification points of snow
depth
|
|
Foundations
|
Ministry of
Science and Technology of P. R. China (2017YFA0603303); National Natural
Science Foundation of China (42171136)
|
|
Data
publisher
|
Global Change Research Data Publishing &
Repository, http://www.geodoi.ac.cn
|
|
Address
|
No.
11A, Datun Road, Chaoyang District, Beijing 100101, China
|
|
Data
sharing policy
|
Data from the Global Change Research Data
Publishing & Repository includes metadata, datasets (in the Digital Journal of Global
Change Data Repository), and publications (in the Journal of Global
Change Data & Discovery).
Data sharing
policy includes: (1) Data are openly available and can
be free downloaded via the Internet; (2) End users are encouraged to use Data
subject to citation; (3) Users, who are by definition also value-added
service providers, are welcome to redistribute Data subject to written
permission from the GCdataPR Editorial Office and the issuance of a Data
redistribution license; and (4) If Data are used to compile new
datasets, the ??ten per cent principal?? should be followed such that Data
records utilized should not surpass 10% of the new dataset contents, while
sources should be clearly noted in suitable places in the new dataset[7]
|
|
Communication and searchable system
|
DOI, CSTR, Crossref, DCI, CSCD, CNKI, SciEngine, WDS/ISC, GEOSS
|
3 Methods
3.1 Raw Data
The
development of this dataset used remote sensing data and ground observation
data. Remote sensing data included Terra/Aqua MODIS snow data and IMS snow/ice
data. The MODIS/Terra snow cover 8-day L3 global 500 m sin grid dataset version
6 (MOD) during the period from January 1 2000 to December 31 2020 and the
MODIS/Aqua snow cover daily L3 global 500 m sin grid dataset version 6 (MYD)
from May 4 2002 to December 31 2020 were used[21,22]. Different from
the values of ??snow?? and ??no snow?? in version 5, the MODIS snow cover data
version 6 provide the Normalized Difference Snow Index (NDSI) and parameters
which represent the quality of snow detection[23,24]. The user can
define a more suitable NDSI threshold for snow recognition according to the
regional snow characteristics, and thus obtain more accurate snow
data. The spatial resolution of MODIS NDSI data
is 500 m, and the temporal resolution is 1 day. The data acquisition time is
10:30 a.m. or 1:30 p.m. The consistency of these two data is 10% in summer and
30% in winter, up to 62%[25].
The IMS snow/ice
data is a multi-source fusion dataset of snow and sea ice for the Northern
Hemisphere, distributed by the National Snow Ice Data Center. The source
datasets include data from NOAA??s Very Low Orbit, Geostationary Operational
Environment Satellites, Geostationary Meteorological Satellite, United States
Department of Defense Polar Satellites Orbiters, Multi-Function Transport
Satellites, and European Meteorological Satellites. Also, the data of various
radar sources from European countries, Japan, China, South Korea, Canada, the
United States, and snow observations in many countries were combined[26].
The spatial resolution of IMS is 24 km, 4 km, and 1 km, during the periods from
January 1 2000 to February 23 2004, from February 24 2004 to December 2 2014
and after December 2 2014, respectively. The temporal resolution of the IMS is
1 day[27].
The ground data
represent the observations of snow depth during the snow years 2001–2003, 2009–2011, 2016–2018 (snow years are
defined as being from September 1 to August 31 of the following year, e.g.,
snow year 2001 is from Sepember1 2000 to August 31 2001) at SNOTEL (snow
telemetry) stations[28].
After discarding stations with short time or discontinuous observation, 192
stations in the Northwestern United States were chosen. These stations, located
in the area of the Cordillera Mountains or the Rocky Mountains range in height
from 650 m to 3,031 m. 72.4% of the stations located in the area are within 1,000–3,000 m. The stations encompassed all the
key altitudes for the study area, and which were used to evaluate the fusion
and improvement of the snow data in the various geographical locations. Thus,
the observations at these stations can be viewed as the ??true values?? used to
evaluate the accuracy and to verify the original remote sensing data and the
improvements which result from using the fusion data.
3.2 Snow Recognition and
Data Fusion
The
purpose of this study is to create a new dataset with higher resolution, higher
accuracy of snow recognition and less snow omission by integrating the effective
information provided by the MODIS and IMS snow/ice data. The data processing
consists of three parts. The first part is to define a suitable NDSI threshold
according to the snow characteristics in the Northwestern United States and
generate the MODIS snow cover binary dataset. The second part is the fusion of
the two MODIS snow cover datasets. The information in MYD (Aqua) was used to
compensate for the cloud coverage in MOD (Terra) and generate the MODIS fusion
dataset MOYD (combined). In the third part, according to the data performance
in the three periods, the corresponding fusion strategy was formulated and
adopted to fuse the MODIS fusion data with IMS snow/ice data. Thereby, a new
multi-source fusion snow cover dataset for the Northwestern United States was
realized. The data processing steps are outlined in Figure 1.
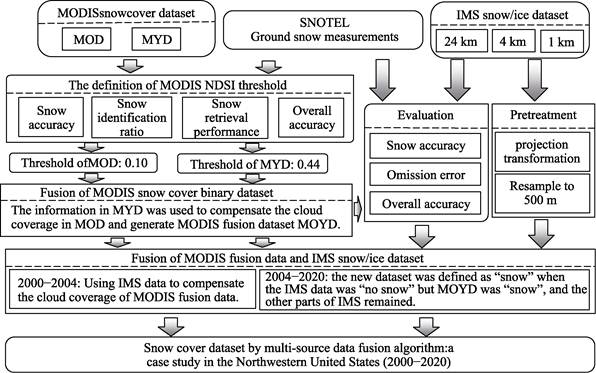
Figure 1 Flow chart for the development of the snow
data
The ??step-by-step iterative test?? was used to define a
suitable MODIS NDSI threshold for snow recognition. The NDSI threshold was
based on carrying out 99 iterations between 0 and 1 in steps of 0.01[29].
The snow recognitions under each threshold were evaluated based on the ground
observations by four indicators, i.e., the snow accuracy, the snow
identification ratio, the snow retrieval performance, and the overall accuracy[6].
The snow accuracy is defined as the ratio between the number of correctly
recognized snow samples and the number of snow samples identified by the remote
sensing data, representing the correct snow recognition. The snow
identification ratio is the ratio of the number of correctly recognized snow
samples to the snow samples recorded by the ground observations; this
represents the proportion of snow recognized by the remote sensing data. The
snow retrieval performance is defined as the product of the snow accuracy and
the snow identification ratio and is used to evaluate comprehensively the
performance of data retrieval. The overall accuracy is defined as the ratio of
the number of correctly classified samples to the total number of samples, and
thus represents the overall accuracy for recognition in the data corresponding
to ??snow?? and ??no snow??.
Verification
indicated that the MOD and MYD for the Northwestern United States had the best
snow retrieval performance being 78.3% and 67.9% when the NDSI threshold was
0.10 and 0.15, respectively. The snow accuracy for the MYD data was 87.1%,
which was 5.5% lower than that of the MOD data which had a value of 92.6%. To
ensure the highest snow accuracy for these two data fusion results, the NDSI
threshold of MYD was reset as 0.44 to achieve a snow accuracy of 94.7%, a value
which is comparable to that for the MOD. Therefore, 0.10 and 0.44 were set as
the NDSI thresholds for MOD and MYD in the Northwestern United States,
respectively. When the NDSI was greater than or equal to this value, the grid
was recognized as ??snow??, and when the NDSI was less than this value, it was
recognized as ??no snow??. In the multi-data fusion, the MOD dataset was given
the highest priority. The MYD dataset served to compensate for cloud coverage
in the MOD and generate the MODIS fusion dataset MOYD.
The IMS snow/ice
data has three different spatial resolution settings, that is, 24, 4, and 1 km,
respectively. For data with different spatial resolutions, the data from
September 1 2000 to August 31 2003, September 1 2008 to August 31 2011, and
September 1 2015 to August 31 2018 were selected. Three indicators, namely, the
snow accuracy, the omission error and the overall accuracy were used to evaluate
the MODIS and the IMS dataset. The snow accuracy and overall accuracy were
defined as previously mentioned above. The omission error is the ratio of the
number of samples that misjudged ??snow?? as ??no snow?? based on remote sensing
retrieval versus the number of snow samples verified by ground observations,
thus giving a measure of the snow missed by remote sensing observation. The
results indicated that in the first stage when the spatial resolution of IMS
was 24 km, the snow accuracy of IMS was slightly lower than that of the MODIS
fusion dataset, and the omission error was higher. Thus, the MODIS fusion
dataset should have the highest priority in the next fusion. The data fusion
rule was defined as using the IMS data to compensate for the cloud coverage of
the MODIS fusion data. In the second stage, when the spatial resolution of the
IMS was 4 km, the snow accuracy of the IMS was higher than that of MODIS fusion
dataset, but the omission error was still higher. Therefore, the data fusion
rule was that the new dataset was defined as ??snow?? when the IMS data was ??no
snow?? but MOYD was ??snow??, and the other parts of the IMS remained. In the
third stage when the spatial resolution of the IMS was 1 km, the snow accuracy
of the IMS was higher than that of the MODIS fusion data, and the omission
error was lower than that of the MODIS. However, the overall accuracy of the
IMS was lower, and a higher level of snow omission still existed. To further
reduce the snow omission, the data fusion rule was adjusted to be the same as
that in the second stage.
4 Data Results and Validation
4.1 Data Products
The dataset consists of 7,688 files and covers the
period from January 1 2000 to December 31 2020. The time resolution is on a
daily basis and the spatial resolution is 500 m. The data file format is .tif.
The grid consists of snow binary data, where one represents ??snow?? and zero
represents ??no snow??. The data size was 170 GB and was compressed into 1 file
of 421 MB.
4.2 Data Results
|
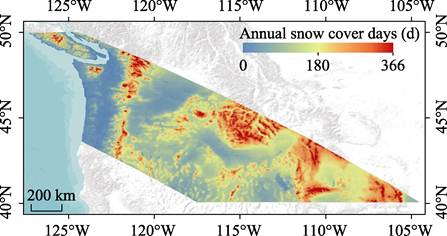
Figure 2 Average annual snow cover days for the Northwestern
United States
|
The
snow cover in the Northwestern United States exhibited different distribution
characteristics for the various regions (Figure 2). For example, the western
coastal areas were almost snow free. In the Cordillera Mountains near 122??W,
snow cover increased with increase of altitude, and the number of snow cover
days over 2,000 m on an annual basis was more than 120 days. Perennial snow
cover existed in the areas above 3,000 m, where the number of snow cover days (annual
basis) was more than 330. Most areas of the Rocky Mountains above 1,500 m, in
the location 115??W to 105??W, had more than 180 days of snow cover (annual
basis). The lower elevations between the two mountainous regions had fewer
numbers of snow cover days, typically being less than 60 (annual basis).
The annual
variation of snow cover for the Northwestern United States is presented in
Figure 3. From September there were 1–2 days with sporadic snow in the
high-altitude regions. In October, the snow cover days at high altitude
increased to 6–10. In November, a large area experienced snow cover, the number
of days being 6–10. In December, more areas were covered with snow, and the
duration of snow cover in the high-altitude regions increased to more than 20
days. In January and February, most areas higher than 1,000 m were covered
continually with snow. In March, the snow at low altitude (< 1,000 m) melted
first, and in April, the snow at mid-altitude (1,000–2,000 m) melted. In May,
the snow in other areas had melted except for some regions above 2,000 m. After
June, the snow had disappeared except for small amounts of snow on the top of
the northern Cordillera Mountains. The Cordillera Mountains are a north-south
mountain range. The data for snow in November and May indicated that snow cover
started earlier and ended later in the northern part of the Cordillera
Mountains. In addition, snow cover in the Rocky Mountains, which is far from
the Pacific Ocean, started earlier and ended later than expected based on
comparisons of the snow cover variations for other regions at a similar
latitude and altitude.
From 2000 to 2020, the snow cover days (monthly basis) revealed a
decreasing trend at the different altitudes as illustrated in Figure 4. The
snow cover days on a monthly basis was defined as the average snow cover days
in one month per square kilometer in the region of interest (d·km–2).
Based on altitude, the study area was divided into four regions: <1,000 m, 1,000–2,000
m, 2,000–3,000 m and >3,000 m, which corresponds to areas of 1.6 ?? 105
km2,
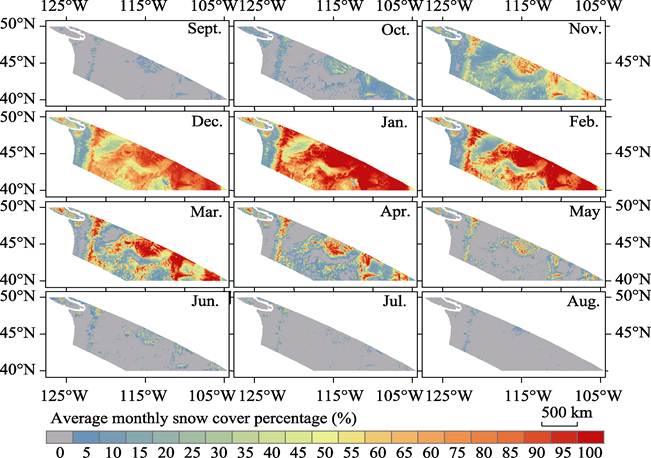
Figure 3 Average
monthly snow cover percentage for the Northwestern United States
|
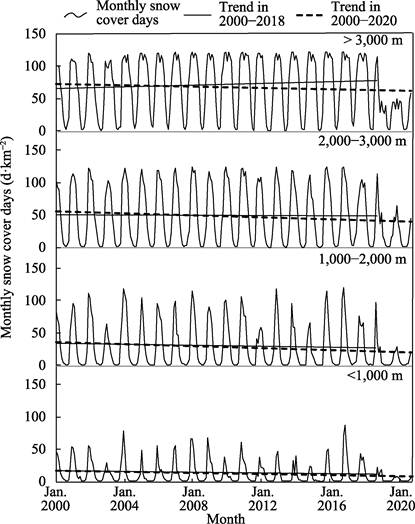
Figure
4 Variation of monthly snow cover days at
different altitudes for the Northwestern United States during the period 2000
to 2020
|
2.8
?? 105 km2, 1.0 ?? 105 km2 and 0.6 ??
105 km2, respectively. Irrespective of the altitude, the
seasonal fluctuations in the number of snow cover days (monthly basis) for the Northwestern
United States is quite clear; that is, there is almost no snow from June to
September, and some snow from December to March. The number of snow cover days
generally reached a peak in January being 41.3, 86.1, 110.3 and 110.8 d·km–2
for the four regions, respectively. The inter-annual fluctuations were particularly
clear for the region <1,000 m, and less for the region > 2,000 m except
in 2019 and 2020.
The trends for
the number of snow cover days (monthly basis) in the four regions during the
period from 2000 to 2020 were –0.45, –0.73, –0.74 and –0.54 d·km–2·y–1,
respectively. These decreasing trends were clearly affected by the low number
of snow cover days in 2019 and 2020. Therefore, the snow changes during the
period from 2000 to 2018 were recalculated in order to better represent the
snow fluctuations over a long-time series. The results showed that the trends
for the number of snow cover days (monthly basis) in the four regions were
–0.29, –0.30, –0.04 and 0.66 d·km–2·y–1, respectively.
During these 19 years, the number of snow cover days (monthly basis) decreased
by 5.5, 5.7 and 0.7 d·km–2 in the region <1,000 m, 1,000–2,000 m,
and 2,000–3,000 m, respectively, while it increased by 12.5 d·km–2
in the region >3,000 m. It can be seen that since the start of this century,
snow cover in areas less than 2,000 m in the Northwestern United States has
exhibited a decreasing trend, snow cover in the area 2,000–3,000 m basically
has remained unchanged, while the snow cover in the area >3,000 m has
clearly shown an increasing trend.
|
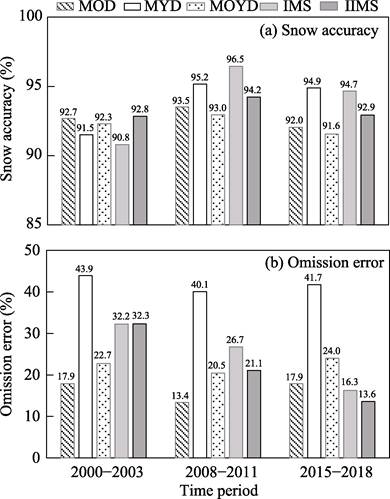
Figure 5 Evaluation of accuracy and verification
of the results of MODIS. IMS raw data and
the fusion datasets: (a) snow accuracy; (b) omission error
|
4.3 Data Validation
The
accuracy of MODIS, the IMS snow data and the two fusion snow datasets were
evaluated based on the ground observations at 192 SNOTEL stations. It was found
that all the data exhibited a high level of accuracy for snow recognition
(above 90%), whether it was the original data or the fusion data (Figure 5).
The first MODIS data fusion aimed to remove the effect of cloud cover and
increase the area of study. Compared with the raw MOD, the accuracy of the
fusion data decreased slightly by 0.4%–0.5%, however, the extent of cloud cover
decreased substantially. The cloud cover on a monthly basis decreased by 6.7%
(2.7–9.1%), and the maximum daily decrease in cloud cover could reach 57.8%.
The omission error for the MOYD fusion data was still lower than that of the
IMS snow/ice data. All of these findings indicated that the fusion of the two
MODIS datasets can effectively reduce the impact of cloud cover, and this
method was confirmed to be feasible and efficient for the Northwestern United
States.
The purpose of
the fusion of the MOYD and IMS was to improve the spatial resolution and reduce
the snow omission errors. Two strategies were adopted for the data fusion in
the different time periods. The data fusion of 2000–2004 firstly improved the
IMS spatial resolution from 24 km to 500 m, which resulted in an improvement in
the accuracy by 2.0%. The data fusion of 2004–2020 also at first increased the
IMS spatial resolution from 4 km or 1 km to 500 m. Also, the snow omission
error decreased significantly, i.e., by 5.6% and 2.7%, although the snow
accuracy decreased by 2.3% and 1.8%. The snow accuracies were still at a high
level, 94.2% and 92.9%, respectively. The above verifications showed that the
second fusion of MODIS and IMS not only effectively improved the spatial
resolution, but also maintained high snow accuracies and reduced the omission
errors to some extent. The comprehensive performance of the new multi-source
fusion snow cover dataset resulted in improvements compared with the source
datasets.
5 Discussion and Summary
Snow
cover is an important element of the global climate system, and affects the
surface energy budget, regulates temperature, promotes atmospheric
teleconnection, and controls the hydrology system. A comprehensive
understanding of snow cover is of great significance to the measurement of
changes in snow cover and the associated coping strategies, the management of
regional water resources under continuous warming, and for obtaining a deeper
understanding of global climate change. Based on the latest MODIS NDSI data,
and the IMS snow\ice data, this study formulated various fusion rules based on
the snow recognition performance for each dataset in the different periods, and
this led to a snow cover dataset based on the use of a multi-source data fusion
algorithm being developed; the algorithm was then successfully applied to a
case study of the Northwestern United States for the period 2000–2020.
The daily snow
measurements at 192 SNOTEL stations were used in accuracy and verification
studies. The stations were distributed in 4 altitude ranges within the study
area, and the observations of snow cover were shown to represent the snow
characteristics of the study area. Data evaluation and verification indicated
that use of the multi-source fusion snow cover dataset resulted in a higher
snow accuracy, a lower snow omission error, and with a spatial resolution of
500 m. Moreover, the improved dataset can fully reflect the spatial
differences, and the inter-annual and intra annual variations of snow cover in
the Northwestern United States. The analysis of the snow cover days on a
monthly basis for the period 2000 to 2018 revealed various change trends for
different regions, i.e., a decrease of snow cover in the area less than 2,000
m, an unchanged level of snow cover between 2,000 and 3,000 m, and an
increasing level of snow cover at altitudes greater than 3,000 m.
In conclusion,
the approach featuring the MODIS and IMS datasets provided a long-time series
of snow cover and were used to study the spatial-temporal distribution and
variation of snow cover in the area. Multi-source dataset fusion has been shown
to be one of the most effective methods for improving comprehensively the
performance of snow cover data. This study should provide a foundation for
further research on long-time series snow cover datasets at the global level.
Author
Contributions
Gao,
Y. made the overall design for the dataset development and modified the data
paper. Dong, H. W. processed MODIS and IMS datasets and verified these
datasets. All authors wrote this data paper.
Conflicts
of Interest
The
authors declare no conflicts of interest.
References
[1]
Brown, R., Derksen, C., Wang,
L. Assessment of spring snow cover duration variability over northern Canada
from satellite datasets [J]. Remote Sensing of Environment, 2007, 111:
367–381.
[2]
Armstrong, R. L., Brodzik, M.
J. Recent northern hemisphere snow extent: a comparison of data derived from
visible and microwave satellite sensors [J].
Geophysical Research Letters, 2001, 28(19): 3673–3676.
[3]
Organization,
W. M. IGOS Cryosphere Theme: a Cryosphere Theme Report for the IGOS Partnership
[M]. World Meteorological Organization, 2007.
[4]
Abbas, F.,
Simon, G., Ghaleb, F., et al. Snow hydrology in Mediterranean mountain
regions: a review [J]. Journal of Hydrology, 2017, 551: 374–396.
[5]
Franz, K. J.,
Hogue, T. S.,
Sorooshian, S.
Operational snow modeling: addressing the challenges of an energy balance model
for National Weather Service forecasts [J]. Journal of Hydrology, 2008,
360(1/4): 48–66.
[6]
Zhong, G. X., Song, K. S.,
Wang, Z. M., et al. Verification and comparison of the MODIS and AMSR-E
snow cover products in Northeast China [J]. Journal of Glaciology and
Cryopedology, 2010, 32(6): 1262–1269.
[7]
Huang, X. D., Zhang, X. T., Li,
Z., et al. Accuracy analysis for MODIS snow products of MOD10A1 and
MOD10A2 in Northern Xinjiang area [J]. Journal of Glaciology and
Cryopedology, 2007(5): 722–729.
[8]
Chen, R. S., Kang, E. Q., Wu,
L. Z., et al. Cold regions in China [J]. Journal of Glaciology and
Cryopedology, 2005(4): 469–475.
[9]
Rasouli, K., Pomeroy, J. W.,
Whitfield, P. H. Hydrological responses of headwater basins to monthly
perturbed climate in the North American Cordillera [J]. Journal of
Hydrometeorology, 2019, 20(5): 863–882.
[10]
Zhang, Y. J., Zhong, X. Y.
Classification and regionalization of the seasonal snow cover across the
Eurasian Continent [J]. Journal of Glaciology and
Cryopedology, 2014, 36(3): 481–490.
[11]
Siirila-Woodburn,
E. R., Rhoades, A. M., Hatchett, B. J., et al. A low-to-no snow future
and its impacts on water resources in the western United States [J]. Nature
Reviews Earth & Environment, 2021, 2: 800–819.
[12]
Huang, X. D., Li, X. B., Liu,
C. Y., et al. Remote sensing inversion of snow cover extent and snow
depth/snow water equivalent on the Qinghai-Tibet Plateau: advance and challenge
[J]. Glaciology and Geocryology, 2019, 41(5): 1138–1149.
[13]
Gao, Y., Lu, N., Yao, T. D.
Evaluation of a cloud-gap-filled MODIS daily snow cover product over the
Pacific Northwest USA [J]. Journal of Hydrology, 2011, 404: 157–165.
[14]
Gao, Y., Xie, H. J., Lu, N., et
al. Toward advanced daily cloud-free snow cover and snow water equivalent
[J]. Journal of Hydrology, 2010, 385: 23–25.
[15]
Li, X. H., Jing, Y. H., Shen,
H. F., et al. The recent development in cloud removal approaches of
MODIS snow cover product [J]. Hydrology and Earth system Sciences, 2019,
23(5): 2401–2416.
[16]
Gao, Y., Xie, H. J., Yao, T.
D., et al. Integrated assessment on multi-temporal and multi-sensor
combinations for reducing cloud obscuration of MODIS snow cover products of the
Pacific Northwest USA [J]. Remote Sensing of Environment, 2010, 114:
1662–1675.
[17]
Chu, D., Zhaxi, D. Z., Cidan,
Y. Z., Analysis on applicability of NOAA IMS snow and ice products in snow
cover monitoring over the Tibetan Plateau [J]. Journal of Glaciology and
Geocryology, 2021, 43(6): 1659–1672.
[18]
Marzari, N., Ahmet, E., Xie, H.
J., et al. Assessment of ice mapping system and moderate resolution
imaging spectroradiometer snow cover maps over Colorado Plateau [J]. Journal
of Applied Remote Sensing, 2013, 7(1): 1–16.
[19]
Gao, Y.,
Dong, H. W. Snow cover dataset by multi-source data fusion algorithm??a case
study in the Northwestern United States [J/DB/OL]. Digital Journal of Global
Change Data Repository, 2022. https://doi.org/10.3974/geodb.2022.02.08.V1. https://cstr.escience.org.cn/CSTR:20146.11.2022.02.08.V1.
[20]
Crater Editorial Office. GCdataPR data sharing
policy [OL]. https://doi.org/10.3974/dp.policy.2014.05 (Updated 2017)
[21]
Hall, D. K., Riggs, G. A.
MODIS/Terra snow cover daily L3 global 500m Sin grid, version 61 [DB]. NASA National Snow and Ice Data Center
Distributed Active Archive Center, 2021. https://doi. org/10.5067/MODIS/MOD10A1.061.
[22]
Hall, D. K., Riggs, G. A.
MODIS/Aqua snow cover daily L3 global 500m Sin grid, version 61 [DB]. NASA National Snow and Ice Data Center
Distributed Active Archive Center, 2021. https://doi.org/ 10.5067/MODIS/MYD10A1.061.
[23]
Hall, D. K., Riggs, G. A.,
Salomonson, V. V., et al. MODIS snow-cover products [J]. Remote
Sensing of Environment,
2002, 83: 181–194.
[24]
Riggs, G. A., Hall, D. K.,
Rom??n, M. MODIS snow products user guide for Collection 6(C6) [R/OL].
[2019-07-02].
https://modis-snow-ice.gsfc.nasa.gov/uploads/C6_MODIS_Snow_User_Guide.pdf.
[25]
Zeng, T. Y. Snow phenology
dynamics and its response to climate over Tibetan Plateau [D]. Lanzhou: Lanzhou University, 2019.
[26]
Liu, X., Jin, X., Ke, C. Q.
Accuracy evaluation of the IMS snow and ice products in stable snow covers
region in China [J]. Glaciology and Geocryology, 2014, 36(3): 500–507.
[27]
U.S. National Ice Center. IMS
daily northern hemisphere snow and ice analysis at 1-km, 4-km, and 24-km
resolutions, version 1 [DB]. National
Snow and Ice Data Center, 2008, https://doi.org/10.7265/ N52R3PMC.
[28]
USDA Natural Resources
Conservation Service. Snowpack: Snow Water Equivalent (SWE) and Snow Depth
[DB/OL]. https://www.nrcs.usda.gov/wps/portal/wcc/.
[29]
Zhang, H. B., Zhang, F., Zhang,
G. Q., et al. Ground-based evaluation of MODIS snow cover product V6
across China: implications for the selection [J]. Science of the Total
Environment, 2019, 651: 2712–2726.