20-m/12-d
Surface Soil Moisture Dataset for the Panzhuang Irrigation District of China
(2020)
Wang, J. J.1
Zhang, D.2 Shi,
H. J.3 Lin, R. C.2 Wang, J.4 Wei, Z.2*
1. Operation and Maintenance Center of Panzhuang Irrigation District,
Dezhou 253000, China;
2. China Institute of Water Resources
and Hydropower Research, Beijing 100038, China;
3. Water Conservancy Bureau of Dezhou,
Dezhou 253014, China;
4. Aerospace Information Research
Institute, Chinese Academy of Sciences, Beijing 100101, China
Abstract: Soil moisture is an
important factor affecting the energy, water and carbon cycles, agricultural
processes, and hydrometeorology. The 20-m/12-d soil moisture dataset covers
Panzhuang Irrigation District of China (2020) was developed based on the series
of Sentinel-1 SAR images from 2020. A linear regression model was established
between the backscattering coefficient and
surface soil moisture. Concurrently, the supporting vector machine algorithm based
on machine learning was used to identify and extract farmland in the Panzhuang
Irrigation District. This dataset includes: (1) boundary vector data for the
Panzhuang Irrigation District; and (2) surface soil moisture for 31 12-d
periods during 2020, having a temporal resolution of 12 d and a spatial resolution
of 20 m. The dataset is archived in .shp and .tif formats and consists of 43
files, amounting to 5.16 GB (or when compressed to 4 files, amounting to 1.09
GB). These data are highly relevant to water storage management, drought
warning, and irrigation planning.
Keywords: surface soil moisture; Sentinel-1; back
scattering coefficient; the Panzhaung Irrigation District; Shandong
DOI: https://doi.org/10.3974/geodp.2022.01.18
CSTR: https://cstr.escience.org.cn/CSTR:20146.14.2022.01.18
Dataset Availability Statement:
The dataset
supporting this paper was published and is accessible through the Digital Journal of Global Change Data
Repository at: 1https://doi.org/10.3974/geodb.2021.10.08.V1 or
https://cstr.escience.org.cn/CSTR:20146.11.2021.10.08.V1.
1 Introduction
Soil moisture (SM) plays an
important role in energy, water and carbon cycles, and affects meteorological,
hydrological and agricultural processes[1,2]. Surface soil moisture
(SSM; 0?C5 cm depth) is vital to drought, flood and thunderstorm predictions[3,4].
There are many SSM monitoring methods, e.g., oven-drying[5],
modeling[6], and remote sensing estimation[7]. The
development of satellite remote sensing technology makes it more convenient to
monitor SSM at different spatial and
temporal scales. Remote sensing methods include optical remote sensing
and microwave remote sensing. Optical remote sensing is greatly affected by
cloud, rain and other weather conditions, so its application is limited,
especially in southern China. Microwave remote sensing has a unique advantage
because it has a longer wavelength than visible and infrared wavelengths, and
is less affected by bad weather conditions, e.g., clouds and precipitation. Microwave remote sensing is commonly used to monitor SSM,
e.g., the Advanced Scatterometer (ASCAT)[8,9], Soil Moisture Ocean
Salinity (SMOS)[8,10] and Soil Moisture Active and Passive (SMAP)[8,11,12].
However, the low spatial resolution (about 40 km[13]) cannot meet
the requirements of agricultural fine management and efficient use of water
resources.
In recent decades, synthetic aperture radar (SAR) have produced
significant advantages in estimating soil surface features, especially surface
roughness[14] and soil moisture[15]. The SAR images with
L, C and X-bands are widely used for SSM estimation[16?C19]. Studies
by relevant scholars[18,20] show that the C-band sensor carried by
Sentinel-1 (S1) shows the inversion ability of soil characteristics on a
vegetation covered surface. Sentinel-1
images can be used for both SSM inversion and downscaling of SMOS or SMAP SM. A higher accuracy of SSM can be obtained
by using active and passive microwave remote sensing data fusion. Based
on the sensitivity of radar backscattering coefficient to SSM, the fitting
relationship between the radar backscattering coefficient and soil moisture
data from the China Meteorological Administration (CMA) Land Data Assimilation
System (CLDAS) was determined to obtain SSM with high spatial resolution.
Concurrently, the support vector machine
method[21] based on machine learning was used to identify and extract
farmland within the study area to obtain a
high spatial resolution farmland SSM dataset, which provides support for the
fine agricultural management and efficient use of water resources.
2 Survey of
the Study Area
|
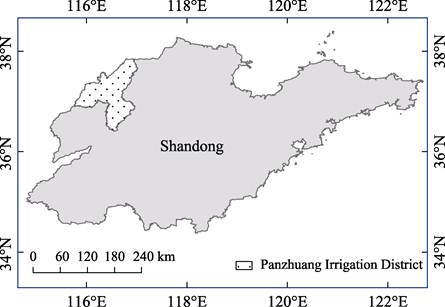
Figure 1 Location map of the Panzhuang
Irrigation District
within Shandong
|
The Panzhuang
Irrigation District (36??24??N?C37??51??N, 116??57??E?C115??51??E) is a large-scale
irrigation area linked to the Yellow River in China, located west of Dezhou
city within Shandong. It is bordered by the Lijia??an Irrigation District to the
east, the Yellow River to the south, Dezhou city to the west, Hebei to the
northwest, and the Wei canal and Zhangweixin river to the north[22].
The area was built and put to use in 1972. It includes Decheng, Lingcheng,
Ningjin, Wucheng, Pingyuan, Xiatjin, Yucheng, and Qihe, with a total area of 5,851
km2. The maximum annual precipitation is 1,018 mm, the minimum
annual precipitation is only 286 mm, and the average annual precipitation is
562 mm. The precipitation from July to September accounts for 65% of the annual
precipitation, and the interannual distribution of precipitation in the area
is uneven. The average annual evaporation is 1,240 mm. Panzhuang Irrigation
District is an important grain and cotton
production base in the northwest of Shandong, and provides a large
amount of high- quality water resources for Dezhou city, making an essential contribution to the economic
development and agricultural production in
this area[23].
3 Metadata of the Dataset
The metadata for the dataset[24],
which includes the full name of the dataset, its short name, the authors, the
years, the temporal resolution, data format, data size, data files, data publisher, and data sharing policy are summarized in
Table 1.
Table
1 Metadata summary
of the 20-m/12-d soil moisture dataset covers Panzhuang Irrigation District of
China (2020)
|
Items
|
Description
|
|
Dataset
full name
|
20-m/12-d
soil moisture dataset covers Panzhuang Irrigation District of China (2020)
|
|
Dataset
short name
|
SM_Panzhuang_2020
|
|
Authors
|
Wang,
J. J., Operation and Maintenance Center of Panzhuang Irrigation District,
Dezhou, 1558412182@qq.com
Shi,
H. J., Water Conservancy Bureau of Dezhou, 1159045384@qq.com
Wei,
Z., China Institute of Water Resources and Hydropower Research,
weizheng@iwhr.com
Lin,
R. C., China Institute of Water Resources and Hydropower Research,
190453501@qq.com
Wang,
J., Aerospace Information Research Institute, Chinese Academy of Sciences,
wangjin@aircas.ac.cn
Zhang,
D., China Institute of Water Resources and Hydropower
Research, 1945685727@qq.com
|
|
Geographical
region
|
Panzhaung
Irrigation District
|
|
Year
|
2020
|
|
Temporal
resolution
|
12 d
|
|
Data
format
|
.tif,
.shp
|
|
Data
size
|
1.09
GB
|
|
Data
files
|
Boundary
vector data of Panzhuang Irrigation District; surface soil moisture for 31
12-d periods during 2020, having a temporal resolution of 12 d and a spatial
resolution of 20 m
|
|
Foundation
|
Ministry
of Science and Technology of P. R. China (2017YFC0403202)
|
|
Data computing environment
|
ArcGIS10.4,
ENVI5.6, SARscape5.4
|
|
Data
publisher
|
Global
change scientific research data publishing system, http://www.geodoi.ac.cn
|
|
Address
|
No.
11A, Datun Road, Chaoyang District, Beijing 100101, China
|
|
Data
sharing policy
|
Data from the Global
Change Research Data Publishing & Repository includes metadata, datasets (in the Digital Journal of Global Change Data Repository), and
publications (in the Journal of Global Change Data & Discovery). Data sharing policy includes: (1) Data are openly
available and can be free downloaded via the internet; (2) end users are
encouraged to use Data subject to citation; (3) users, who are by definition
also value-added service providers, are welcome to redistribute Data
subject to written permission from the GcdataPR Editorial Office and the
issuance of a Data redistribution license; and (4) if Data are used to
compile new datasets, the ??ten percent principal?? should be followed such
that Data records utilized should not surpass 10% of the new
dataset contents, and sources should be clearly noted in suitable places in
the new dataset[25]
|
|
Communication and searchable system
|
DOI,
CSTR, Crossref, DCI, CSCD, CNKI, SciEngine, WDS/ISC, GEOSS
|
4 Methods
4.1 Data Sources
The data used were Sentinel-1 (S1) SAR images, with a spatial
resolution of 20 m. These images were captured using a C-band SAR sensor and an
interferometric wide swath mode (IW) with vertical-vertical (VV) polarization
and vertical-horizontal (VH) polarization. There are some other auxiliary data, e.g., Landsat8 Operational Land
Imager (OLI)
images, boundary vector data of Panzhuang Irrigation District, digital
elevation model (DEM)
data with a spatial resolution of 90 m and CLDAS SSM.
The specific parameters of the S1 images used are shown in Table 2.
Table
2 Parameters for
Sentinel-1 (S1) synthetic aperture radar images (IW=interferometric wide swath mode; SLC=single
look complex, VV=vertical-vertical polarization; VH=vertical-horizontal
polarization)
|
Images
|
Date
|
Imagingmode
|
Product
type
|
Spatial
resolution (m)
|
Band
|
Polarization
|
|
S1
|
20200105
|
20200117
|
20200129
|
IW
|
SLC
|
20
|
C
|
VV/VH
|
|
20200210
|
20200222
|
20200305
|
|
20200317
|
20200329
|
20200410
|
|
20200422
|
20200504
|
20200516
|
|
20200528
|
20200609
|
20200621
|
|
20200703
|
20200715
|
20200727
|
|
20200808
|
20200820
|
20200901
|
|
20200913
|
20200925
|
20201007
|
|
20201019
|
20201031
|
20201112
|
|
20201124
|
20201206
|
20201218
|
|
20201230
|
|
|
4.2 Data Processing
A flowchart of the farmland SSM
mapping process is presented in Figure 2. The S1 images were used as the data
source, focusing on the Panzhuang Irrigation District. According to the
sensitivity of the backscattering coefficient to SSM, a linear regression model
was established. By fitting the coefficient of the backscattering coefficient
with SSM derived from CLDAS, SSM values with high spatial resolution were
obtained. Concurrently, the support vector machine (SVM) algorithm was used to
identify and extract farmland areas, and obtain the SSM values within farmland.
These data are highly relevant to water storage management, drought warning,
and irrigation planning. SVM classification is a machine learning method based
on statistical learning theory. Its decision boundary is the maximum edge
hyperplane to solve the learning sample, which solves classification problems
involving complex data and is applicable to statistical learning of
high-dimensional feature space and small samples[26].
5 Data Results
5.1 Data products
Details regarding the files
containing the boundary vector data for the Panzhuang Irrigation District SSM
data for 2020 are listed in Table 2. The SSM dataset for the Panzhuang
Irrigation District (2020) includes 31 files in .tif format, covering the
period from 5 January, 2020 to 30 December, 2020. The dataset has a temporal
resolution of 12 d and a spatial resolution of 20 m. The SSM unit in the
dataset is cm3/cm3, and its value range is (0,1). The
files are named using the format: SSM_yyyymmdd.tif, e.g., SSM_20201230.tif
indicates SSM data for 30 December, 2020.
5.2 Data Results
Figure 3 shows the comparison of SSM estimation accuracy
between winter wheat and summer maize values, determined using different
polarization modes during the growing season. In the winter wheat growing
season, an important period of Yellow River irrigation
in the Panzhuang Irrigation
District, the SSM values are greatly affected by irrigation. In contrast,
during the summer maize growing season, they are mainly affected by
precipitation. Four days of vigorous crop growth in irrigated areas were
selected for comparison (winter wheat: 10 April, 2020 and 6 May, 2020; summer
maize: 27 July, 2020 and 20 August, 2020). During the growing seasons of winter wheat and summer maize, the
backscattering coefficients of VV polarization were 9?C11 db higher than those
derived from VH polarization. The ranges of backscattering coefficients of VV
and VH polarization modes were (−16, −8) and (−24, −12), respectively.
Table 3 Brief table of the 20-m/12-d SSM dataset for the Panzhuang
Irrigation District (2020)
|
Data
|
Data format
|
Data content
|
Data amount
|
|
The boundary of the Panzhuang Irrigation District
|
.shp
|
Vector data
|
32.60 KB
|
|
31 SSM data in the Panzhuang Irrigation District in 2020
|
.tif
|
SSM data
|
1.09 GB
|
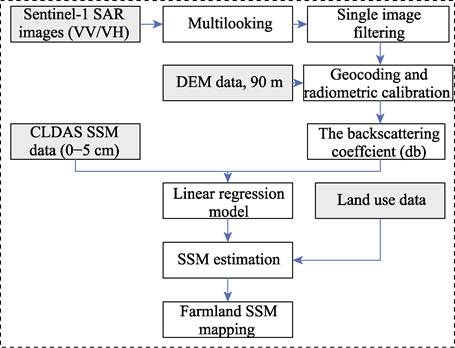
Figure
2 Flowchart for SSM mapping of farmland
areas
Differences in SM caused by rainfall
versus irrigation for different periods were reflected in differences in
backscattering coefficients. Figure
3 shows that on 20 August, 2020, the estimation accuracy of VH polarization was
slightly higher than that of VV polarization. On 10 April, 2020, 6 May, 2020,
and 27 July, 2020, the estimation accuracy of VV polarization was higher than
that of VH polarization, yielding determination coefficients (R2) of 0.118, 0.033, and
0.136, respectively. Therefore, the backscattering coefficient of VV polarization
mode and SSM values from CLDAS were selected to establish a regression model
for SSM estimation. The estimation results of SSM were different among
different crop types, and the estimation results during the summer maize
growing season were better than those during the winter wheat growing season
(summer maize: R2 = 0.505,
0.492; winter wheat: R2 =
0.444, 0.345).
Figure 4 shows the
spatial distribution of SSM obtained for different polarization modes. Four
days (27 July, 2020, 8 August, 20 August, and 1 September, 2020) were selected
for analysis, representing dates when crops were growing vigorously in the
area, within a spatial range of 5 km ?? 5 km. According to the figure, the
removal effect of roads, buildings and other features in the area is obvious.
The correlation coefficient (R) for
SSM values obtained from inversion of the two polarization modes was between
0.383 and 0.525.
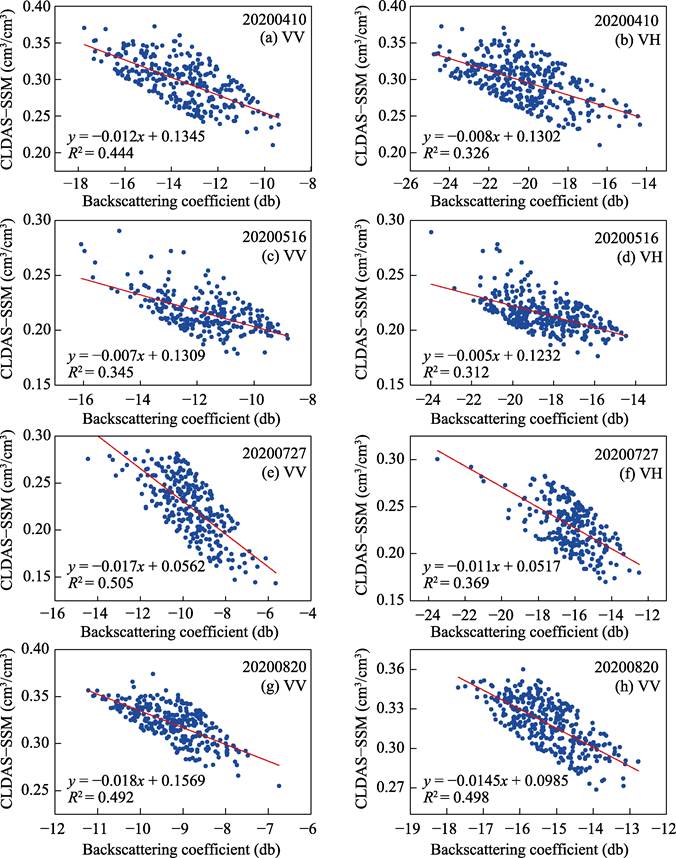
Figure 3 SSM retrieval under
different polarization modes during the winter wheat (a?Cd) and summer maize
(e?Cg) growing seasons
As shown in Figure 5, the SSM estimation method was applied to the
Panzhuang Irrigation District. Figure 5a shows farmland SM values in the Panzhuang Irrigation
District on 10 April, 2020. The range of SSM values was 0?C0.49 cm3/cm3,
but typically between 0.16?C0.36 cm3/cm3; Figure 5b shows the farmland
SSM values in the Panzhuang Irrigation District on 27 July, 2020. The range of
SSM values was 0?C0.37 cm3/cm3, but typically between 0.14?C0.28 cm3/cm3.
These results are consistent with the SSM values from CLDAS, and provide a
reference for irrigation management, drought prediction and crop yield
estimation.
6 Discussion and Conclusion
S1 images
for SSM retrieval show that VV polarization performs better than VH polarization, yielding
determination coefficients (R2)
between 0.369 and 0.508. The removal effect of roads, buildings and other
features in the areas is obvious. The correlation coefficient (R) of SSM obtained from the two
polarization methods is between 0.383 and 0.525.
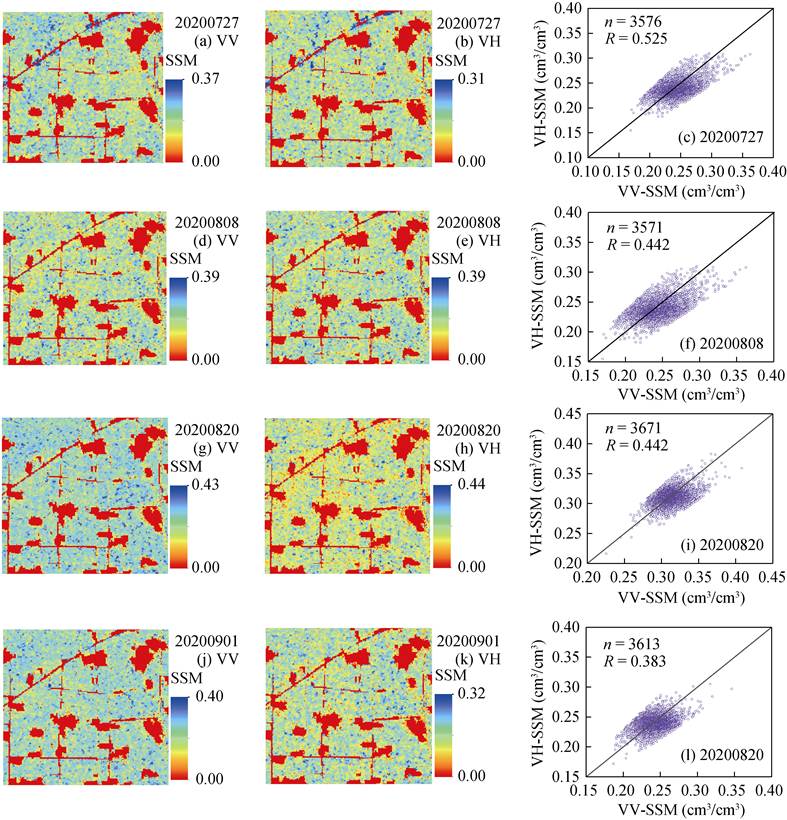
Figure
4 Spatial distribution
of SSM derived from different polarization modes
A regression model was
established between SSM values from CLDAS and the backscattering coefficient
from S1 images. However, the spatial representation of SSM grid pixels with a
resolution of 0.0625?? ?? 0.0625?? varies greatly, especially in areas with
complex underlying surface properties. S1 images have high spatial resolution,
and some errors may occur when the backscattering coefficient is resampled to
the same resolution as the SSM raster data.
In addition, although high spatial resolution SSM data were obtained, the
temporal resolution was low and did not meet the requirement for time
continuity. In the future, station-based SSM observations could be carried out.
Inputting these data into the inversion model would effectively reduce the
impact of differences in spatial representativeness. S1 images can be used not only for SSM retrieval[27], but also
for SMOS or SMAP SM downscaling[16]. In the future, the data
fusion method combining active and passive microwave remote sensing data will
be used to obtain SSM data with higher spatial and temporal resolutions.
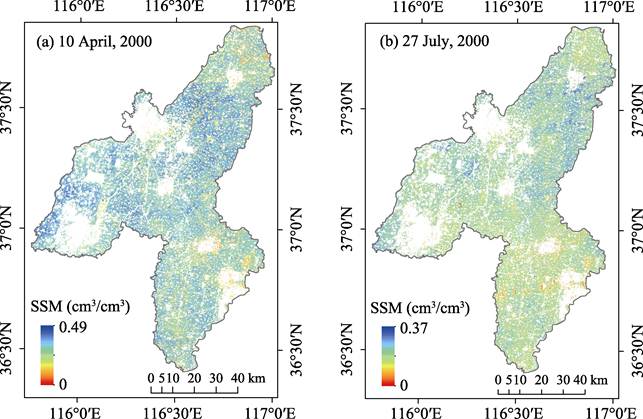
Figure
5 SSM mapping in the Panzhuang Irrigation
District for 10 April (a) and 27 July (b), 2020
Author Contributions
Wang, J. J. made the overall
design for the development of the dataset; Zhang, D. and Shi, H. J. downloaded
and processed the remote sensing data for the Panzhuang Irrigation District;
Wei, Z. designed the model algorithm; Lin, R. C. and Wang, J. wrote the paper.
Conflicts of Interest
The
authors declare no conflicts of interest.
References
[1]
Alizadeh, M.
R., Nikoo, M. R. A fusion-based methodology for meteorological drought
estimation using remote sensing data [J]. Remote Sensing of Environment an
Interdisciplinary Journal, 2018, 211: 229?C247.
[2]
Dorigo, W.,
Wagner, W., Albergel, C., et al. ESA
CCI Soil Moisture for improved Earth system understanding: State-of-the art and
future directions [J]. Remote Sensing of Environment, 2017, 203:
185?C215.
[3]
Mccoll, K.
A., He, Q., Lu, H., et al. Short-term
and long-term surface soil moisture memory time scales are spatially
anticorrelated at global scales [J]. Journal of Hydrometeorology, 2019,
20(6): 1165?C1182.
[4]
Kim, H.,
Lakshmi, V. Global dynamics of stored precipitation water in the topsoil layer
from satellite and reanalysis data [J]. Water Resources Research, 2019,
55(4): 3328?C3346.
[5]
Xu, A. Z.,
Hu, J. M., Xiong, Y., et al.
Comparison of soil moisture measurement using TDR method, dry burning method
and oven drying method [J]. Journal of Water Resources and Water Engineering,
2018, 29(2): 253?C256.
[6]
Wang, G.
S., Shi, H. B., Li, X. Y., et al.
Simulation and evaluation of soil water and salt transport in desert oases of
Hetao Irrigation District using HYDRUS-1D model [J]. Transactions of the
Chinese Society of Agricultural Engineering, 2021, 37(8): 87?C98.
[7]
Bai, L. L.,
Long, D., Yan, L. Estimation of surface soil moisture with downscaled land
surface temperatures using a data fusion approach for heterogeneous
agricultural land [J]. Water Resources Research, 2019, 55(2): 1105?C1128.
[8]
Zheng, C.
L., Hu, G. C., Chen, Q. T., et al.
Impact of remote sensing soil moisture on the evapotranspiration estimation [J].
National Remote Sensing Bulletin, 2021, 25(4): 990?C999.
[9]
Xie, Q. X.,
Jia, L., Chen, Q. T., et al.
Evaluation of microwave remote sensing soil moisture products farming-pastoral area of Shandian river basin [J].
National Remote Sensing Bulletin, 2021, 25(4): 974?C989.
[10]
Merlin, O.,
Escorihuela, M. J., Mayoral, M. A., et al.
Self-calibrated evaporation-based disaggregation of SMOS soil moisture: an
evaluation study at 3 km and 100 m resolution in Catalunya, Spain [J]. Remote
Sensing of Environment, 2013, 130: 25?C38.
[11]
Chan, S.
K., Bindlish, R., O??Neill, P., et al.
Development and assessment of the SMAP enhanced passive soil moisture product [J].
Remote Sensing of Environment, 2018, 204: 2539?C2542.
[12]
Das, N. N.,
Entekhabi, D., Dunbar, R. S., et al.
The SMAP mission combined active-passive soil moisture product at 9 km and 3 km
spatial resolutions [J]. Remote Sensing of Environment, 2018, 211:
204?C217.
[13]
Zribi, M.,
Andre, C., Decharme, B. A method for soil moisture estimation in Western Africa
based on ERS scatterometer [J]. IEEE Transactions on Geoscience and Remote
Sensing, 2008, 46(2): 438?C448.
[14]
Zribi, M., Gorrab,
A., Baghdadi, N. A newsoil roughness parameter for themodelling of radar backscattering
over bare soil [J]. Remote Sensing of Environment, 2014, 152: 62?C73.
[15]
Gorrab, A.,
Zribi, M., Baghdadi, N., et al.
Potential of X-Band TerraSAR-X and COSMO-SkyMed SAR data for the assessment of
physical soil parameters [J]. Remote Sensing, 2015, 7(1): 747?C766.
[16]
Gao, Q.,
Zribi, M., Escorihuela, M. J., et al.
Synergetic use of Sentinel-1 and Sentinel-2 data for soil moisture mapping at
100 m resolution [J]. Sensors, 2017, 17(9): 1966.
[17]
Li, J.,
Wang, S. Using SAR-Derived vegetation descriptors in a Water Cloud Model to
improve soil moisture retrieval [J]. Remote Sensing, 2018, 10(9): 1370.
[18]
Bousbih,
S., Zribi, M., El Hajj, M., et al.
Soil moisture and irrigation mapping in a semi-arid region, based on the
synergetic use of Sentinel-1 and Sentinel-2 data [J]. Remote Sensing,
2018, 10(12): 1953.
[19]
Amazirh,
A., Merlin, O., Er-Raki, S., et al.
Retrieving surface soil moisture at high spatio-temporal resolution from a
synergy between Sentinel-1 radar and Landsat thermal data: a study case over
bare soil [J]. Remote Sensing of Environment, 2018, 211: 321?C337.
[20]
Bao, Y.,
Lin, L., Wu, S., et al. Surface soil
moisture retrievals over partially vegetated areas from the synergy of Sentinel-1
and Landsat 8 data using a modified water-cloud model [J]. International
Journal of Applied Earth Observation and Geoinformation, 2018, 72: 76?C85.
[21]
Gao, Q.,
Zribi, M., Escorihuela, M., et al.
Irrigation mapping using Sentinel-1 time series at field scale [J]. Remote
Sensing, 2018, 10(9): 1495.
[22]
Li, J. M.,
Wang, J. J., Yan, Q. H. Analysis of water and soil resources balance in
Panzhuang Irrigated Disrrict, Shandong province [J]. Water Resources
Development Research, 2020, 20(9): 47?C50, 58.
[23]
Feng, Y.
Q., Li, Q. Y., Wang, H. J., et al.
Analysis on the network scheme of ultrasonic water level system in Panzhuang
Irrigation District, Shandong province [J]. Ground Water, 2007(4):
117?C118.
[24]
Wang, J. J., Shi, H. J., Wei, Z., et al. 20-m/12-d soil moisture dataset
covers Panzhuang Irrigation District of China (2020) [J/DB/OL]. Digital
Journal of Global Change Data Repository, 2021. https://doi.org/10.3974/geodb.2021.10.08.V1.
https://cstr.escience.org.cn/CSTR:20146.11.2021.10.08.V1.
[25]
GCdataPR
Editorial Office. GCdataPR data sharing policy [OL]. https://doi.org/10.3974/dp.policy.2014.05 (Updated 2017).
[26]
Zhang, D.
Y., Dai, Z., Xu, X. G., et al. Crop
classification of modern agricultural park based on time series Sentinel-2
images [J]. Infrared and Laser Engineering, 2021, 50(05): 262?C272.
[27]
Yu, F.,
Zhao, Y. A new semi-empirical model for soil moisture content retrieval by ASAR
and TM data in vegetation-covered areas [J]. Science China Earth Sciences,
2011, 54(12): 1955?C1964.