Dataset Development of
Identifying China??s Metropolitan Area Using DBSCAN Clustering Under Dominant
Flow Constraints
Li,
J. Zhang, Y.* Tang, S. Liu, X. H.
College of Geography and Planning, Chengdu
University of Technology, Chengdu 610059, China
Abstract: Metropolitan areas are a vital spatial unit for
advancing new-type urbanization and fostering high-quality development.
Scientific delineation of metropolitan boundaries is fundamental for conducting related research and guiding
planning practices. Building on a clear conceptual framework, this study
initially identifies central cities, then constructs an intercity human
mobility network using Baidu Migration data, and finally delineates the spatial
extent of China??s metropolitan areas through DBSCAN (Density-Based Spatial
Clustering of Applications with Noise) clustering under dominant flow
constraints. The resulting dataset includes: (1) a list of metropolitan core
cities and their spatial distribution, (2) a matrix of intercity human mobility
intensities and the corresponding mobility network, (3) the delineated
metropolitan areas and their spatial distribution. The dataset is archived in
.shp and .xlsx formats, comprising 29 data files with a total size of 67.9 MB
(compressed into a single file of 31.3 MB).
Keywords: metropolitan
area identification; human mobility network; central cities; dominant flow
constraint; DBSCAN clustering
DOI: https://doi.org/10.3974/geodp.2025.03.04
Dataset Availability Statement:
The dataset supporting this paper
was published and is accessible through the Digital Journal of Global Change Data Repository
at: https://doi.org/10.3974/geodb.2025.08.01.V1.
1 Introduction
Metropolitan
areas are essentially functional urban regions[1]. Metropolitan
areas typically emerged through the diffusion and radiation effects of large,
comprehensive cities, which drive the coordinated development of surrounding small
and medium-sized cities. Over time, these interactions give rise to densely
connected urban regions with deeply integrated functions[2]. The
spatial scope of metropolitan areas is generally smaller than that of city
clusters, representing the core zones within broader urban agglomerations[3,4].
As a key vehicle for advancing the national strategy of new-type urbanization
and achieving high-quality development, metropolitan areas have gained
increasing prominence[5?C7]. In recent years, their development has
been consistently prioritized at the national strategic level. For example, the
National new-type urbanization plan (2014?C2020) emphasized the construction of
integrated metropolitan areas characterized by efficient commuting and
coordinated development. Subsequently, in 2019, China??s government issued the
Guidelines on fostering the development of modern metropolitan areas, further
advancing the construction of metropolitan areas toward modernization and
high-quality development. More recently, China??s government reiterated the
importance of leveraging urban agglomerations and metropolitan areas to
establish a coordinated development pattern among large, medium, and small
cities. As a foundation for planning practices and academic research, the
scientific delineation of metropolitan spatial boundaries provides essential
references for optimizing cross-regional resource allocation, promoting urban-rural
integration, and fostering high-quality new-type urbanization.
The accelerating
processes of globalization and informatization have intensified the flows of
key elements??such as population, goods, information, capital, and
technology??across cities, profoundly reshaping urban networks and influencing
the emergence and evolution of metropolitan areas[8]. However,
conventional methods for identifying metropolitan areas rely primarily on
static spatial analysis[9,10], typically incorporating attribute
data such as the proportion of non-agricultural population[1],
population size[11], and secondary and tertiary industry output,
alongside spatial proximity factors[12]. These approaches often
overlook the spatial interaction effects of dynamic factor flows. In recent
years, the rapid development of big data technologies has enabled access to
diverse and low-cost geographic flow data, presenting new opportunities for metropolitan
areas identification[13]. Therefore, this study identifies central
cities, constructs a national intercity population flow network using Baidu
migration data, and applies DBSCAN clustering under dominant flow constraints
to delineate the spatial extent of metropolitan areas in China.
2
Metadata of the Dataset
The
metadata for the Dataset for identifying Chinese metropolitan areas using
DBSCAN clustering under dominant flow constraints[14], including the title, authors, geographical region, data
format, data size, data files, data publication and sharing platform, and data
sharing policy, are summarized in Table 1.
3
Methods
3.1 Data Sources
The
data used in this study primarily comprise socio-economic statistics and Baidu
migration data. Socio-economic indicators, including permanent resident
population and GDP(Gross Domestic Product), are derived from the China city statistical
yearbook 2020[16]. Baidu migration data, supported by large-scale
location-based service technologies, dynamically capture population flows,
directions, and migration intensities among cities across different time
periods, and have been widely applied in studies of urban networks[17].
In this study, we utilized intercity inflow and outflow data covering 365
China??s cities (excluding Hong Kong, Macao, and Taiwan due to data
unavailability) from January 1 to January 14, 2020, a period encompassing
weekdays, weekends, and statutory holidays.
Rigorous data cleaning and preprocessing were subsequently conducted, including
duplicate removal, missing-value imputation, anomaly detection, standardized
formatting, and calibration, to ensure data reliability and consistency.
Finally, based on the preprocessed inflow-outflow records, we then constructed
a population migration intensity matrix across the 365 cities.
Table 1 Metadata summary of the Dataset for identifying Chinese metropolitan
areas using DBSCAN clustering under dominant flow constraints
|
Items
|
Description
|
|
Dataset full name
|
Dataset for
identifying Chinese metropolitan areas using DBSCAN clustering under dominant
flow constraints
|
|
Dataset short
name
|
MetropolitanAreaDelineation
|
|
Authors
|
Li, J., College
of Geography and Planning, Chengdu University of Technology,
lijuan@stu.cdut.edu.cn
|
|
|
Zhang, Y.,
College of Geography and Planning, Chengdu University of Technology,
zhangyang2020@cdut.edu.cn
|
|
|
Tang, S., College
of Geography and Planning, Chengdu University of Technology,
2910356995@qq.com
|
|
|
Liu, X. H.,
College of Geography and Planning, Chengdu University of Technology,
1303940151@qq.com
|
|
Geographical
region
|
365 municipal
units in China (data for Hong Kong, Macao and Taiwan is temporarily
unavailable)
|
|
Year
|
2020
|
|
Data format
|
.shp, .xlsx
|
|
Data size
|
31.3 MB (after
compression)
|
|
Data files
|
(1) Central
cities list and their spatial distribution; (2) A matrix of intercity human
mobility intensity and the corresponding mobility network; (3) Identified metropolitan
areas and their spatial distribution
|
|
Foundation
|
National Natural
Science Foundation of China (52478045)
|
|
Data publisher
|
Global Change
Research Data Publishing & Repository, http://www.geodoi.ac.cn
|
|
Address
|
No. 11A, Datun
Road, Chaoyang District, Beijing 100101, China
|
|
Data sharing
policy
|
(1) Data are openly
available and can be free downloaded via the Internet; (2) End users are
encouraged to use Data subject to
citation; (3) Users, who are by definition also value-added service
providers, are welcome to redistribute Data subject to written permission
from the GCdataPR
Editorial Office and the issuance of a Data
redistribution license; and (4) If Data
are used to compile new datasets, the ??ten percent principal?? should be
followed such that Data records
utilized should not surpass 10% of the new dataset contents, while sources
should be clearly noted in suitable places in the new dataset[15]
|
|
Communication and
searchable system
|
DOI, CSTR,
Crossref, DCI, CSCD, CNKI, SciEngine, WDS, GEOSS, PubScholar, CKRSC
|
3.2 Model and
Experimental Design
3.2.1 Calculation of Human Flow Connection Intensity
Owing
to directional differences in population inflows and outflows among cities, the
intensity of population flow connections between city i and city j is
calculated as the sum of the population inflow and outflow intensities. This
approach eliminates the directionality inherent in population flow connections.
The Equation for calculating the intensity of population flow connections
between two cities is as follows[18]:
Pij=Pi,j + Pj,i
(1)
where
the scales of population flow connections from city i to city j
and from city j to city i are denoted by Pi,j and Pj,i.
3.2.2 DBSCAN
Clustering under Dominant Flow Constraints
DBSCAN
is a density-based clustering algorithm that identifies clusters by specifying
a neighborhood radius (Eps) and a minimum number of points (MinPts). Core
points are those with a sufficient number of neighbors within the Eps radius,
and clusters are formed by linking core points with their density-reachable
neighbors. Owing to its ability to detect arbitrarily shaped clusters,
distinguish high-density regions, and effectively handle noise, DBSCAN has been
widely applied in spatial data clustering and complex network community
detection[19]. For flow-based data scenarios such as urban
interaction networks, Zhang, et al.[20] innovatively
integrated dominant flow analysis with the DBSCAN algorithm to propose an
improved spatial clustering approach. This method extends conventional
density-based clustering by introducing dominant inter-node flows as a
constraint condition[21]. By simultaneously accounting for
geographical proximity and network connectivity strength, it enables a more
rigorous and scientifically grounded delineation of metropolitan spatial
boundaries.
3.3 Technical Route
The
development process of this dataset comprises 3 main steps: (1) identification
of metropolitan core cities, (2) construction of the national population
mobility network and dominant flow analysis, and (3) delineation of
metropolitan spatial boundaries (Figure1).
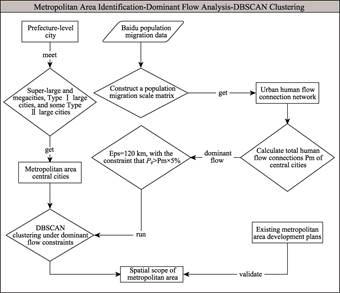
Figure 1 Flowchart of dataset
development
3.3.1 Identification
of Metropolitan Area Central Cities
Based
on the definitions of core cities provided in the national Technical guidelines
for territorial spatial planning of metropolitan areas[22] and the
Guiding opinions on fostering and developing modern metropolitan areas[23],
this study prioritizes the selection of metropolitan cores among China??s
cities. Specifically, we identify 7 megacities, 14 very large cities, and 14
Type I large cities with central urban district populations exceeding 3 million
as metropolitan core cities. In accordance with the research by Shen, et al.[24],
the population threshold for central cities in metropolitan areas may be
appropriately lowered in Western China. Accordingly, 12 Type II large cities in
Western China, with urban district populations ranging from 1 to 3 million, are
also included as metropolitan core cities. Although their populations fall
below the 3 million benchmark, these cities exert strong spatial influence over
surrounding areas and are often provincial capitals or central nodes within
urban glomerations. A total of 47 cities were identified as metropolitan core
cities for this study.
3.3.2
Construction of Urban Human Flow Connection Network
Following
the preprocessing of Baidu migration data, a daily population migration matrix
was constructed based on intercity in-migration and out-migration flows.
Subsequently, a population mobility intensity matrix was derived using Equation
1, which aggregates bidirectional flows to quantify the strength of intercity
population connections. This matrix was then visualized and classified into
discrete levels using the natural breaks (Jenks) method. Based on the
classification results, the spatial structure of the intercity population
mobility network was identified, and a dominant flow analysis was conducted to
reveal the hierarchical organization and directional characteristics of the
network.
3.3.3
Identification of Metropolitan Area Spatial Scope
In
this dataset, the identification radius of metropolitan areas is set to 120 km,
based on 2 key factors: the maximum average intercity distance among existing
planned metropolitan areas and the spatial coverage of the one-hour commuting
circle. To incorporate network connectivity, a dominant flow threshold was
introduced, whereby intercity population flow intensity exceeding 5% of the
total flow of the core city was defined as a clustering constraint. The
improved DBSCAN clustering algorithm was implemented in a Node.js runtime
environment using JavaScript on the VS Code platform. Starting from a core city
point p in the set of core cities D, if the number of cities
within its Eps neighborhood exceeds the minimum threshold (MinPts), p is
identified as a core point. Subsequently, a cluster is initialized with p
as its center, and cities within its Eps neighborhood are added to the cluster.
During cluster expansion, the dominant flow constraint is applied to ensure
that only cities with strong population linkages to the core city (i.e.,
exceeding the threshold) are included. This approach enables the identification
of the spatial extent of metropolitan areas centered on each core city,
integrating geographic proximity and network connectivity.
4
Data Results and Validation
4.1 Dataset Composition
The
dataset comprises 3 components: (1) the list and spatial distribution of
metropolitan core cities, provided in.xlsx and .shp formats; (2) the intercity
population mobility intensity matrix and the corresponding mobility network
among 365 cities, available in .xlsx and .shp formats; (3) the identification
results and spatial distribution of metropolitan areas across China, also
provided in .xlsx and .shp formats.
4.2 Data Results
A
total of 47 metropolitan core cities were identified through the selection
process (Figure 2), including 7 megacities, 14 very large cities, 14 Type I
large cities, and 12 Type II large cities. Most of these core cities are
located southeast of the Hu Huanyong Line, reflecting the stronger capacity for
population agglomeration and spatial radiation in the eastern region. By
contrast, most cities in the western region, aside from several provincial
capitals, exhibit limited capacity to drive regional development.
As shown in
Figure 3, the overall structure of China??s intercity population flow network
reveals a pattern of higher density and stronger linkages in the east, and
lower density with weaker linkages in the west. Major urban agglomerations??such
as the Yangtze River Delta, Beijing-Tianjin-Hebei, Pearl River Delta, and
Chengdu-Chongqing??constitute the primary clusters of high-intensity flows.
Within these regions, core cities including Beijing, Shanghai, Shenzhen,
Chengdu, and Chongqing function as central hubs, radiating strong connections
outward. Several provincial capitals, such as Xi??an, Kunming, Changsha, and
Wuhan, also serve as important sources of high-intensity flows. The
distribution of flow intensities across different
levels is markedly uneven. High-level flows account for a smaller proportion
and are predominantly characterized by short-distance interactions, whereas
low-level flows are more widely distributed and tend to span longer distances.
|
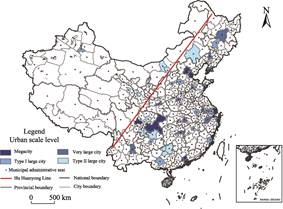
Figure
2 Distribution map of central cities in
metropolitan areas
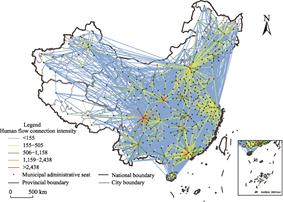
Figure
3 Network map of urban human flow
connections
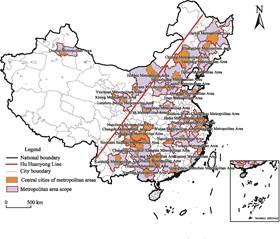
Figure
4 Distribution map of
metropolitan area identification results
|
By setting the
metropolitan area identification radius and applying dominant flow constraints,
the resulting metropolitan area delineations are presented in Figure 4 and
Table 2, yielding a total of 37 metropolitan areas. Due to Shanghai??s extensive
population mobility connections with cities nationwide, and the absence of
clear dominant flows with its immediate neighbors, Shanghai was not included
within the spatial boundaries of any metropolitan area. Overall, the spatial
distribution of metropolitan areas in China reveals a pattern of dense
concentration in the southeast and sparse distribution in the northwest. With
the exception of Urumqi, Xining, Lanzhou-Baotou, Yinchuan, and Hohhot, all
identified metropolitan areas are located southeast of the Hu Huanyong Line.
Key urban agglomerations, such as the Beijing- Tianjin-Hebei, the Yangtze River
Delta, the Pearl River Delta, and Chengdu- Chongqing, form dense clusters of
metropolitan areas. The identified metropolitan areas exhibit a coexistence of
single-center, dual-center, and multi- center structures. For example, the
Guangzhou-Shenzhen and Suzhou- Wuxi-Changzhou Metropolitan Areas are classified as multi-center, whereas
the Capital, Southern Sichuan, Guiyang, and Hohhot Metropolitan Areas are
dual-center. The core cities within these metropolitan areas tend to be of
comparable size, reflecting either strong cooperation between equals or a
dominant core city supported by multiple secondary centers. The combined GDP of
the 37 metropolitan areas accounts for
64.76% of the national total.
Notably, the Guangzhou- Shenzhen and Capital Metropolitan Areas stand out as
more mature and developed, leading all metropolitan areas in GDP and resident population size. These areas also serve as hubs of high-level
population mobility
flows, demonstrating elevated economic activity and strong population
attraction.
Table 2 Identification results of metropolitan
areas
|
Metropolitan area name
|
Central city
|
Component cities
|
Population (10,000 persons)
|
Area (km2)
|
GDP (100 million CNY)
|
|
Suzhou-Wuxi-Changzhou
Metropolitan Area
|
Suzhou, Wuxi, Changzhou
|
Suzhou, Wuxi, Changzhou, Nantong
|
3,362.80
|
25,670.78
|
66,225.79
|
|
Nanjing Metropolitan
Area
|
Nanjing
|
Nanjing, Zhenjiang, Yangzhou, Wuhu, Ma??anshan, Xuancheng
|
2,587.98
|
37,913.25
|
41,809.10
|
|
Hangzhou Metropolitan Area
|
Hangzhou
|
Hangzhou, Huzhou, Jiaxing, Shaoxing, Quzhou, Huangshan
|
3,074.20
|
53,837.00
|
45,408.26
|
|
Hefei Metropolitan Area
|
Hefei
|
Hefei, Huainan, Lu??an, Bengbu
|
2,058.70
|
38,335.00
|
19,844.19
|
|
Ningbo Metropolitan
Area
|
Ningbo
|
Ningbo, Zhoushan
|
1,095.30
|
11,216.00
|
20,373.90
|
|
Nanchang Metropolitan
Area
|
Nanchang
|
Nanchang, Jiujiang,
Fuzhou, Yichun, Shangrao
|
2,595.40
|
86,516.59
|
21,427.15
|
|
Changsha-Zhuzhou-Xiangtan
Metropolitan Area
|
Changsha
|
Changsha, Zhuzhou, Xiangtan
|
1,693.31
|
28,069.70
|
22,128.24
|
|
Wuhan Metropolitan Area
|
Wuhan
|
Wuhan, Ezhou, Huangshi, Huanggang, Xiaogan, Xianning, Xiantao
|
3,166.11
|
53,657.05
|
33,398.22
|
|
Fuzhou Metropolitan
Area
|
Fuzhou
|
Fuzhou, Putian, Nanping, Ningde
|
1,748.30
|
55,828.24
|
23,671.79
|
|
Xiamen Metropolitan
Area
|
Xiamen
|
Xiamen, Zhangzhou, Quanzhou
|
1,934.00
|
25,315.61
|
27,747.59
|
|
Guangzhou-Shenzhen
Metropolitan Area
|
Guangzhou, Foshan,
Dongguan, Shenzhen
|
Guangzhou, Foshan, Dongguan, Shenzhen, Huizhou, Qingyuan, Zhaoqing
|
7,147.68
|
60,942.97
|
104,785.73
|
|
Nanning Metropolitan
Area
|
Nanning
|
Nanning, Qinzhou,
Guigang, Fangchenggang, Chongzuo, Baise
|
2,408.89
|
103,366.00
|
15,096.76
|
|
Liuzhou Metropolitan
Area
|
Liuzhou
|
Liuzhou, Hechi, Laibin
|
951.99
|
65,500.00
|
5,385.24
|
|
Guilin Metropolitan
Area
|
Guilin
|
Guilin, Hezhou
|
696.12
|
39,552.64
|
3,481.81
|
|
Guiyang Metropolitan
Area
|
Guiyang, Zunyi
|
Guiyang, Zunyi, Tongren, Bijie, Anshun, Qiannan, Qiandongnan
|
3,263.93
|
149,418.00
|
19,477.66
|
|
Chongqing Metropolitan
Area
|
Chongqing
|
Chongqing, Guang??an
|
3,517.17
|
88,744.00
|
33,808.65
|
|
Southern Sichuan Metropolitan Area
|
Yibin, Luzhou
|
Yibin, Luzhou, Zigong, Neijiang
|
1,438.4
|
35,273.18
|
10,661.07
|
|
Chengdu Metropolitan
Area
|
Chengdu
|
Chengdu, Ziyang, Deyang, Meishan
|
3,009.10
|
33,104.00
|
29,756.75
|
|
Nanchong Metropolitan
Area
|
Nanchong
|
Nanchong, Suining
|
823.70
|
17,822.25
|
4,731.96
|
|
Kunming Metropolitan
Area
|
Kunming
|
Kunming, Qujing, Yuxi, Chuxiong Yi Autonomous Prefecture
|
1,891.40
|
93,671.95
|
16,553.44
|
|
Xi??an Metropolitan Area
|
Xi??an
|
Xi??an, Xianyang, Tongchuan, Weinan
|
2,253.62
|
37,304.51
|
19,065.60
|
|
Zhengzhou Metropolitan
Area
|
Zhengzhou
|
Zhengzhou, Xinxiang, Jiaozuo, Kaifeng, Xuchang, Pingdingshan, Luoyang
|
4,373.10
|
54,276.00
|
35,323.77
|
|
Jinan Metropolitan Area
|
Jinan
|
Jinan, Zibo, Tai??an, Liaocheng
|
2,533.98
|
32,599.45
|
25,201.74
|
|
Qingdao Metropolitan
Area
|
Qingdao
|
Qingdao, Weifang, Rizhao, Yantai
|
2,974.58
|
46,750.90
|
38,262.38
|
|
Dalian Metropolitan
Area
|
Dalian
|
Dalian, Yingkou, Dandong
|
1,187.80
|
33,027.81
|
12,085.00
|
|
Shenyang Metropolitan
Area
|
Shenyang
|
Shenyang, Tieling, Fushun, Benxi, Liaoyang, Anshan
|
1,925.10
|
59,535.77
|
14,937.50
|
(To be continued on the next page)
(Continued)
|
Metropolitan area name
|
Central city
|
Component cities
|
Population (10,000 persons)
|
Area (km2)
|
GDP (100 million CNY)
|
|
Harbin Metropolitan
Area
|
Harbin
|
Harbin, Mudanjiang,
Daqing, Suihua, Yichun, Jiamusi
|
2,003.63
|
213,467.00
|
12,505.70
|
|
Changchun Metropolitan Area
|
Changchun
|
Changchun, Jilin, Siping, Liaoyuan, Songyuan
|
1,728.63
|
92,989.00
|
11,375.87
|
|
Chifeng Metropolitan
Area
|
Chifeng
|
Chifeng, Tongliao, Chaoyang
|
946.38
|
169,255.14
|
5,161.50
|
|
Hohhot Metropolitan
Area
|
Hohhot, Baotou
|
Hohhot, Baotou, Ordos, Bayannur, Ulanqab
|
1,172.17
|
251,500.00
|
17,401.71
|
|
Yinchuan Metropolitan
Area
|
Yinchuan
|
Yinchuan, Wuzhong, Shizuishan
|
504.61
|
35,735.38
|
4,438.78
|
|
Capital Metropolitan Area
|
Beijing, Tianjin
|
Tianjin, Beijing,
Zhangjiakou, Chengde, Baoding, Langfang, Cangzhou, Tangshan
|
7,233.97
|
160,101.00
|
94,878.72
|
|
Shijiazhuang Metropolitan Area
|
Shijiazhuang
|
Shijiazhuang, Hengshui, Xingtai
|
2,225.43
|
35,701.00
|
12,941.10
|
|
Taiyuan Metropolitan
Area
|
Taiyuan
|
Taiyuan, Xinzhou,
Yangquan, Jinzhong, Lvliang
|
1,605.84
|
74,238.63
|
12,720.51
|
|
Lanzhou-Baiyin Metropolitan Area
|
Lanzhou
|
Baiyin, Lanzhou, Linxia, Dingxi
|
1,049.00
|
60,969.00
|
5,728.28
|
|
Xining Metropolitan
Area
|
Xining
|
Xining, Haidong
|
380.55
|
20,860.00
|
2,467.56
|
|
Urumqi Metropolitan
Area
|
Urumqi
|
Urumqi, Changji Hui Autonomous Prefecture
|
576.15
|
87,300.00
|
7,011.39
|
4.3 Data Validation
A
comparative validation between the identified metropolitan areas and those
officially approved by the national government reveals a high degree of spatial
overlap for most cases, including the Chengdu, Chongqing, Changsha-Zhuzhou-Xiangtan,
and Xi??an Metropolitan Areas. Some differences also emerge, for example, the
Guangzhou-Shenzhen Metropolitan Area was identified as a single entity due to
the strong population mobility connections between Guangzhou and Shenzhen. This
outcome supports the scientific validity of applying the DBSCAN clustering
algorithm constrained by dominant flows to delineate metropolitan spatial
boundaries. Moreover, 20 metropolitan areas that have not yet received official
national approval were identified. These metropolitan areas demonstrate
substantial population and economic scale, as well as strong internal
population mobility linkages, indicating significant potential for development
into modern metropolitan areas. Notable examples include the Southern Sichuan,
Hohhot, Dalian, and Nanning Metropolitan Areas.
5
Discussion and Conclusion
This
dataset constructs an intercity population mobility network using Baidu
migration data and applies a DBSCAN clustering algorithm constrained by
dominant flows. Through an integrated identification framework, comprising
??core city selection, dominant flow analysis, and dynamic clustering??, it
provides a scientific delineation of metropolitan areas in China. The
metropolitan areas identified through this approach are largely consistent with
the core regions defined in existing plans, while encompassing a more complete
spatial extent. This finding reflects strong scientific rigor and practical
applicability, providing methodological reference and empirical evidence for
delineating metropolitan boundaries and informing planning policy in China.
Future research could incorporate multidimensional element flows, such as
technology and information flows, to further enhance the methodology. In
addition, the metropolitan area identification results may be used to conduct
competitiveness assessments and development tier classifications, supporting
differentiated planning and policy formulation tailored to various stages of
metropolitan development.
Author Contributions
Li,
J. was responsible for data visualization and paper writing. Zhang, Y. proposed
the overall framework for dataset development and supervised the manuscript.
Tang, S. acquired and processed human flow data and other related basic data.
Liu, X. H. designed and implemented the model and algorithm for metropolitan
area delineation.
Conflicts of
Interest
The
authors declare no conflicts of interest.
References
[1]
Zhou, Y.
X., Shi, Y. L. Establishing the concept of physical territory of Chinese cities
[J]. Acta Geographica Sinica, 1995(4): 289?C301.
[2]
Niu, X.
Y., Li, K. K. Implementation monitoring of territorial spatial planning for
metropolitan areas from the perspective of cross-city functional connections
[J]. Resources Science, 2021, 43(2): 380?C389.
[3]
Zhang,
J. X., Hu, H. J. Development, planning and governance innovation of
metropolitan areas in the new development environment [J]. Economic
Geography, 2023, 43(1): 17?C25.
[4]
Yuan, J.
D., Zhou, J., Huang, W. Several misunderstandings in the theoretical research
and planning practice of metropolitan areas in China [J]. Geographical
Research, 2006(1): 112?C120.
[5]
Zhang,
Y. S., Huang, J. Z., Wang, Q. X., et al. Research on the construction
ideas of China??s metropolitan area governance model from the perspectives of
??scale reorganization?? and ??meta-governance?? [J]. Planners, 2023, 39(4):
19?C27.
[6]
Zhang,
J. X., Zou, J., Wu, Q. Y., et al. On the organization of metropolitan
area space [J]. City Planning Review, 2001(5): 19?C23.
[7]
Wang, G.
T., Li, F., Liu, X., et al. Research on the new pattern of urbanization
in the new development stage??concept and identification criteria of modern
metropolitan areas [J]. Urban Planning Forum, 2021(2): 15?C24.
[8]
Ma, L.
Y., Xiu, C. L., Feng, X. H. Analysis of urban network characteristics in
Northeast China from the perspective of multiple flows [J]. Economic
Geography, 2019, 39(8): 51?C58.
[9]
Stone,
L. O. On the correlation between metropolitan area in-and out-migration by
occupation [J]. Journal of the American Statistical Association, 1971,
66(336): 693?C701.
[10] Feria, J. M, Casado-Diaz, J. M., Martinez-Bernabeu,
L. Inside the metropolis: the articulation of Spanish metropolitan areas into
local labor markets [J]. Urban Geography, 2015, 36(7): 1018?C1041.
[11] Yang, Y. C., Zhang, C. G., Wu, W. X.
Study on the development planning of metropolitan areas in Western China??a case
study of Lanzhou Metropolitan Area Planning [J]. City Planning Review,
2005(4): 23?C29.
[12] Zou, J., Chen, X. H.
Re-understanding of urban system spatial planning??taking Jiangsu as an example [J].
City Planning Review, 2001(1): 30?C33.
[13] Yang, Y., Yin, D., Liu, Z. W., et
al. Research progress of flow space based on big data [J]. Progress in
Geography, 2020, 39(8): 1397?C1411.
[14] Li, J., Zhang, Y., Tang, S, et al.
Dataset for identifying Chinese metropolitan areas using DBSCAN clustering
under dominant flow constraints [J/DB/OL]. Digital Journal of Global Change
Data Repository, 2025. https://doi.org/10.3974/geodb.2025.08.01.V1.
[15]
GCdataPR
Editorial Office. GCdataPR data sharing policy [OL].
https://doi.org/10.3974/dp.policy.2014.05 (Updated 2017).
[16] Urban Social and Economic Survey Department of the National Bureau
of Statistics of China. China Urban Statistical Yearbook (2020) [M].
Beijing: China Statistics Press, 2021.
[17] Zhan, C., Tse, C. K., Fu, Y. X., et
al. Modeling and prediction of the 2019 coronavirus disease spreading in
China incorporating human migration data [J]. Plos One, 2020, 15(10):
e0241171.
[18] Zhang, Y., Zhao, Y. B., Zhao, J. J.,
et al. Research on the network structure characteristics of
Chengdu-Chongqing Urban Agglomeration based on human flow-logistics-information flow
[J]. Areal Research and Development, 2023, 42(6): 40?C45.
[19] Li, X. Y., Li, D. R. DBSCAN spatial
clustering algorithm and its application in urban planning [J]. Science of
Surveying and Mapping, 2005(3): 51?C53+5.
[20] Zhang, Y., Li, J., Wang, X. P.
Research on the spatial structure characteristics of Chengdu-Chongqing Urban Agglomeration
from the perspective of multidimensional element flows [J]. Western Human
Settlements, 2024, 39(3): 14?C20.
[21] Zheng, L., Long, F., Zhang, S. Comparison of the spaces of call and
traffic flows: an empirical study of Qianzhong urban region, China [J]. Cities,
2020, 107, 102927.
[22] Ministry of Natural Resources of P. R. China. Official implementation
of Regulations on the compilation of territorial spatial planning for metropolitan
areas [EB/OL]. (2024-04-02) [2025-07-30]. https://www. mnr.gov.cn/dt/ywbb/202404/t20240402_2841150.html.
[23] National Development and Reform Commission of P. R. China. Guiding opinions
on fostering and developing modern metropolitan areas [EB/OL]. (2019-02-19)
[2025-07-30]. https://zfxxgk.ndrc. gov.cn/web/iteminfo.jsp?id=16110.
[24] Shen, M. R., Wang,
Z. Q., Cui, G. H. Metropolitan areas in China: theoretical origin and planning
practice [J]. Urban Planning
Forum, 2023(2): 57?C66.