Hu, Z. W.1 Xu, Y.1 Yin, Y. M.1 Zhang, K. Y.1 Wu, G. F.1 Wang, C.2*
Cui, L. J.3*
1. MNR Key
Laboratory for Geo-Environmental Monitoring of Great Bay Area, Shenzhen
University, Shenzhen 518060, China;
2. Center
for Satellite Application on Ecology and Environment, Ministry of Ecology and
Environment, Beijing 100094, China;
3.
Institute of Wetland Research, Chinese Academy of Forestry, Beijing Key
Laboratory of Wetland Ecological Function and Restoration, Beijing 100091,
China
Abstract:
Coastal tidal flats are ecologically vulnerable regions, susceptible to climate
change, sea level rises and human activities. Using time-series satellite
images and field survey data, we developed a supervised classification method
for mapping tidal flats on Google Earth Engine (GEE) and then obtained the
Tidal flats dataset covers coastal region in north of 18??N
latitude of China (1989–2020). This dataset is on an annual basis for
over 30 years and has a spatial resolution of 30 m. It consists of 256 data
files in the format of .shp with the data size of 318MB (Compressed to one
single file with 201 MB).
Keywords: coastal zone; tidal flats; China; 1989–2020
DOI: https://doi.org/10.3974/geodp. 2022.01.17
CSTR: https://cstr.escience.org.cn/CSTR:20146.14.2022.01.17
Dataset Availability Statement:
The dataset supporting this paper
was published and is accessible through the Digital Journal of Global Change Data Repository
at: https://doi.org/10.3974/geodb.2021.10.06.V1
or https://cstr.escience.org.cn/CSTR:20146.11.2021.10.06.V1.
1 Introduction
Coastal
tidal flat wetlands are the transition zone between land and sea, maintaining
biodiversity and productivity among various nature ecosystems[1].
Due to an continuous increase in human activities to coastal areas over the
years, substantial coastal tidal flats in China have been degraded and claimed[2].
Mapping and understanding the spatio-temporal distribution of tidal flats are
significant for their management, protection, restoration and sustainable
development. Traditional field surveys are always time-consuming and laborious
as the muddy condition and inaccessibility when flooding, while remote sensing
technology could greatly improve the efficiency for large-scale tidal flat
mapping. Also, repeated satellite
observations over past decades help to represent the historical change of tidal
flats[3].
We deployed a
supervised classification method with time-series satellite images at 30 m
resolution provided in Google Earth Engine (GEE) to generate annual tidal flat
map in the north of China at 18??N latitude during
1989–2020, and now we make this dataset available for public use.
2 Metadata of the Dataset
The
metadata of Tidal flats dataset covers coastal region in north of 18??N latitude
of China (1989–2020)[4] is summarized in Table 1. It mainly includes
full name, short name, authors, years, temporal resolution, spatial resolution,
data format, data size, data files, data publisher and data sharing policy, etc.
3 Materials and Methods
3.1 Data and Methods
The
multispectral images from Landsat 4/5 Thematic Mapper (TM), Landsat 7 Enhanced
Thematic Mapper Plus (ETM+) and Landsat 8 Operational Land Imager (OLI) over
the year of 1989 to 2020 were used as data sources, and training sample points
were selected based on our field survey data. The spectral features of tidal
flats and other land covers were firstly analyzed in terms of training sample
points, and then several key characteristics were worked out from the
time-series satellite images. Random forest (RF) classification algorithm with
the aforementioned characteristics generated as predictor variables was
implemented in the GEE platform to yield annual tidal flat map. Final dataset
was obtained as each annual map was processed by a post-processing.
3.2 Objective and Study
Area
3.2.1 Definition of Tidal Flat Wetland of the Dataset
Taking
the reference in previous studies[5], field samples and remote
sensing images, the tidal flat wetlands in this dataset include intertidal
barren areas and salt marshes. Specifically, the intertidal barren area refers
to the area that is flooded by seawater during high tide and exposed as a sand
or soil at low tide[6]. The salt marsh area refers to undeveloped
natural vegetations adjacent to the intertidal barren areas, such as mangroves,
halophytic herbs and shrubs, etc.[7].
3.2.2 Study Area
According to the China
national surveying of coastal zones and tidal flats[8], with
topography and landscape across the coastal zones in China taken into account,
our study area is defined as the coastal buffer formed from a 10 km buffer
landward and a 40 km buffer seaward along the coastline (Figure 1).The
coastline was derived from Global Self- consistent, Hierarchical, High-resolution
Geography Database (GSHHG[9]).
Table 1 Metadata summary of the Tidal flats dataset covers coastal region in north of 18??N latitude
of China
|
Items
|
Description
|
|
Dataset full name
|
Tidal
flats dataset covers coastal region in north of 18??n latitude of China
(1989–2020)
|
|
Dataset short name
|
DCTF_China_1989_2020
|
|
Authors
|
Hu, Z. W. AAX-7567-2021, MNR Key Laboratory for Geo-Environmental Monitoring of Great Bay
Area, Shenzhen University, zwhoo@szu.edu.cn
Xu, Y. AAX-7694-2021, MNR Key Laboratory for Geo-Environmental Monitoring of Great Bay Area,
Shenzhen University, xuyue19@email.szu.edu.cn
|
|
|
Yin, Y. M.
AAC-1460-2022, MNR Key Laboratory for Geo-Environmental Monitoring of Great
Bay Area, Shenzhen University, yinyumeng2021@email.szu.edu.cn
Zhang, K. Y. Y-7203-2018,
MNR Key Laboratory for Geo-Environmental Monitoring of Great Bay Area,
Shenzhen University, zhangkangyong2016@email.szu.edu.cn
Wu, G. F. B-8735-2018, MNR Key Laboratory for Geo-Environmental Monitoring of Great Bay Area,
Shenzhen University, guofeng.wu@szu.edu.cn
Wang, C. AAX-7615-2021, Ministry of Ecology and Environment Center for Satellite Application
on Ecology and Environment, wangchen_ch@163.com
Cui, L. J.
AAX-7996-2021, Institute of Wetland Research, Chinese Academy of Forestry,
Beijing Key Laboratory of Wetland Ecological Function and Restoration, wetlands108@126.com
|
|
Geographical
region
|
Coastal
zones of China
|
|
Year
|
1989–2020
|
|
Temporal
resolution
|
annual
|
|
Spatial
resolution
|
30 m
|
|
Data format
|
.shp
|
|
|
|
Data size
|
201 MB
|
|
|
|
Data files
|
The dataset
consists of 32 .shp files. The fine name is composed of DCTF_China_year, and
the latest four digits are the year
|
|
Foundations
|
Ministry
of Science and Technology of P. R. China (2017YFC0506200); the Joint
Research Project of NSFC, NWO, and EPSRC (51761135022, ALWSD.2016.026,
EP/R024537/1)
|
|
Data publisher
|
Global Change Research Data Publishing & Repository,
http://www.geodoi.ac.cn
|
|
Address
|
No. 11A, Datun
Road, Chaoyang District, Beijing 100101, China
|
|
Data sharing
policy
|
Data from the Global
Change Research Data Publishing & Repository includes metadata, datasets (in the Digital Journal of Global Change Data Repository), and
publications (in the Journal of Global Change Data & Discovery). Data sharing policy includes: (1) Data are openly
available and can be free downloaded via the Internet; (2) End users are
encouraged to use Data subject
to citation; (3) Users, who are by definition also value-added service
providers, are welcome to redistribute Data subject to written permission
from the GCdataPR Editorial Office and the issuance of a Data redistribution
license; and (4) If Data are used to compile new
datasets, the ??ten per cent principal?? should be followed such that Data
records utilized should not surpass 10% of the new dataset contents, while
sources should be clearly noted in suitable places in the new dataset[4]
|
|
Communication and searchable system
|
DOI,
CSTR, Crossref, DCI, CSCD, CNKI, SciEngine, WDS/ISC, GEOSS
|
3.3 Algorithms
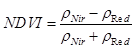
3.3.1 Feature Extraction
The
pixels of clouds, cloud shadows and snows were masked in terms of the Pixel_QA
band[10], and spectral indexes of the remaining pixels were then
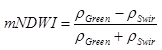
calculated (Table 2). The pixels within different tide levels show different
periodic time-series characteristics[11]. For examples, mNDWI value
increases with the increase of tide level, while the bare soil index decreases.
NDVI value changes seasonally with the growth of plants. In order to reflect
the periodic changes of different land
covers, the spectral index series were sorted ascendingly and then, the mean,
standard deviation and 5th, 25th, 75th and 95th
percentiles of annual spectral indexes were obtained. Finally, six
statistical metrics for each spectral index were computed in each pixel
position, and a total of 42 features were calculated for seven spectral
indexes.
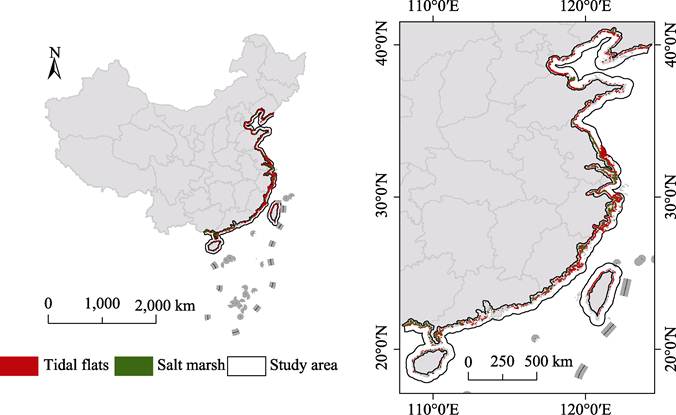
Figure
1 Location of study area (Tidal flat
wetland distribution map in 2020)
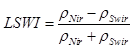
Table 2 Spectral indexes used in this study
|
Spectral index
|
Equation
|
|
Normalized Difference Vegetation Index (NDVI)[12]
|
|
|
Modified Normalized Difference Water Index (mNDWI)[13]
|
|
|
Land Surface Water Index (LSWI)[14]
|
|
|
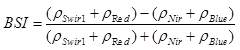
Bare Soil Index (BSI)[15]
|
|
|
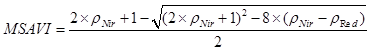
Modified Soil-Adjusted Vegetation Index (mSAVI)[16]
|
|
|
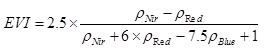
Enhanced Vegetation Index (EVI)[17]
|
|
|
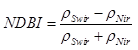
Normalized Difference Buildup Index (NDBI)[18]
|
|
Note: ??Red, ??Green, ??Blue,
??Nir and ??Swir are the reflectance values of red, green,
blue, near infrared and shortwave infrared channels.
3.3.2 Random Forest Algorithm
Random Forest is an
ensemble algorithm based on classification and regression tree (CART)[18]
where overall structure is a tree structure, consisting of root nodes, decision
nodes, decision tree branches and leaf nodes. The implementation of RF is as
follows:
Input
data: N
training samples with M-dimensional
feature vectors;
Parameters: The number of samples for every subset (n), the feature dimension to construct every decision tree (F) and the number of trees (NTree);
Step
1: A subset of the training set is obtained by
randomly selecting n samples from training samples via the method of
Bagging;
Step
2: F
features (F??M) are randomly selected
from M features, and a classification
tree is constructed using the randomly selected subset;
Step
3: The Step 1 and Step 2 are conducted repeatedly
to construct NTree
classification trees;
Step
4: An unlabeled object is predicated by all the NTree decision trees, and the
category with the most votes is regarded as the final classified label.
3.4 Technical Workflow
All the image
pre-processing and classification processes were conducted on the GEE platform
(Figure 2).
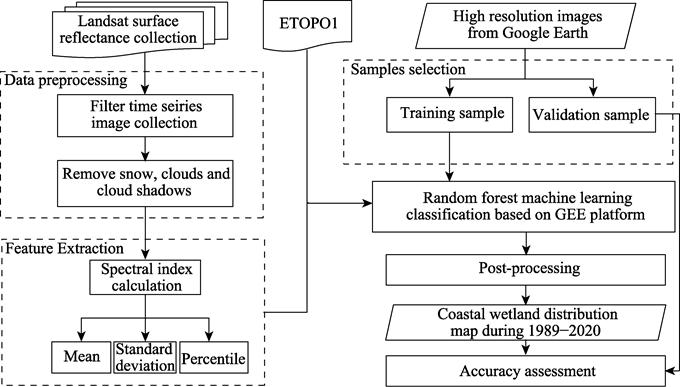
Figure 2 Technique workflow of the classification
algorithm
3.4.1 Training Sample Selection
We conducted field campaigns in Jiangsu, Guangxi,
Guangdong and Shanghai, but more sample points were selected from Google Earth
Pro (GEP). A total 12,704 sample points were selected in four years for
training the RF classifier and validation (Table 3). We labeled each sample
point in four land covers (Table 3) and some typical
ones are presented in Figure 3.
Table 3 The descriptions of land covers and the
number of training samples
|
Category
|
Descriptions
|
Training samples
|
|
2000
|
2005
|
2010
|
2016
|
Total
|
|
Tidal flats
|
Supratidal
flats that are not often flooded by tidal water and muddy intertidal flats
that are often flooded by water
|
814
|
276
|
215
|
446
|
1,751
|
|
Salt Marshes
|
Coastal wetlands that consist of
salt marshes and mangrove forests
|
249
|
101
|
75
|
180
|
605
|
|
Land
|
Built-up areas, agriculture areas,
aquaculture areas and terrestrial forests
|
727
|
234
|
183
|
510
|
1,654
|
|
Water
|
Permanent water bodies, including
sea surfaces, rivers, lakes and aquaculture water
|
945
|
336
|
308
|
753
|
2,342
|
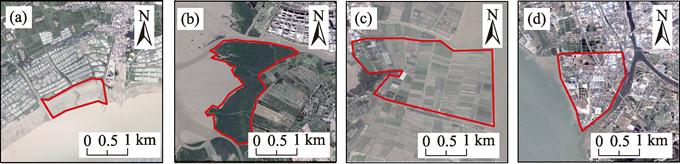
Figure 3 Typical land covers: (a) intertidal
barren flat, (b) mangrove forest, (c) agriculture field and (d) built-up area
3.4.2 Random Classification on GEE Platform
The GEE platform
uses Google??s computing infrastructure to implement parallel geospatial data
processing, and it greatly reduces the time for data processing. The platform
integrates a variety of machine learning methods, among which the random forest
algorithm is a good choice for large scale land cover mapping with high
accuracy.
In this study, 42 spectral variables plus
land topography and ocean bathymetry (ETOPO1) data were used to train the RF
classifiers. The number of classification trees was set to 100, and 43
predictor variables were randomly combined to construct every single
classification tree. The default settings of other parameters provided by GEE
platform were applied in this study.
3.4.3 Post-Processing
The majority
filter was adopted to eliminate salt-and-pepper noises of each classification
map. Considering that the tidal flats and salt marshes are normally spatially
adjacent, isolated salt marsh patches far from tidal flats were automatically
removed by analyzing the adjacency relationship. Moreover, the digital
elevation model provided by Shuttle Radar Topography Mission (SRTM) was utilized
to remove the misclassified pixels with the threshold set at 35 m. Some
remaining misclassification patches were further corrected manually, whilst
some holes were filled. Finally, 32 annual tidal flats maps were obtained.
4 Data Results
and Validation
4.1 Data Components
The dataset
contains 32 vector maps in the format of .shp over 1989–2020 which were derived
from 30 m resolution raster maps.
4.2 Data Products
A 30 m tidal
flat map (Figure 4) covering the coastal region in North of 18??N
latitude of China by using RF machine learning algorithm with Landsat
time-series images via GEE. In 1989, the total area of coastal tidal wetlands
is 13,653.7 km2, including 12,840.7 km2 bare tidal flats
and 813.0 km2 salt marsh wetlands. And in 2020, the total area of
coastal tidal wetland in China is about 8,100.8 km2, including
7,135.9 km2 bare tidal wetlands and 964.9 km2
salt marsh wetlands. From the comparison between 1989 and 2020, the area of
bare tidal flats decreased by 44.4%, but salt marshes increased by 18.7%.
Tidal wetlands mainly occur in gently sloping
coastal zones and estuaries. For example, total coastal wetlands in Jiangsu
province accounts for about 21.0% across the study area in 2020, whilst the
estuary wetlands of Yangtze River, Pearl River, Yellow River and Liaohe River
totally represent about 22.3%.
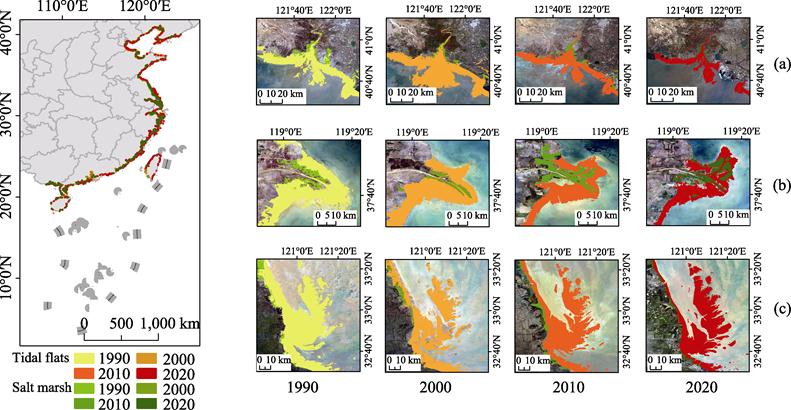
Figure 4 Maps of tidal flat wetlands in three
distinct regions: (a) Liaohe Estuary wetland, (b) Yellow River estuary wetland,
(c) Coastal area of Yancheng, Jiangsu province
4.3 Data Validation
532 random points were
randomly generated within the study area and imported into Google Earth Pro
(GEP) software. The ground truths of these points were manually interpreted on
their corresponding high spatial resolution images in GEP software, including
147 tidal flat points, 103 salt marsh points
and 282 other points. Overall accuracies and Kappa coefficients were
computed (Figure 5) by comparing the mapping results. All the overall
accuracies are higher than 88%, and the Kappa coefficients are higher than
0.80. Average overall accuracy of the 32 annual maps is 90.84%, and average
Kappa coefficient is 0.85. These accuracy metrics indicate the high accuracy of
this dataset.
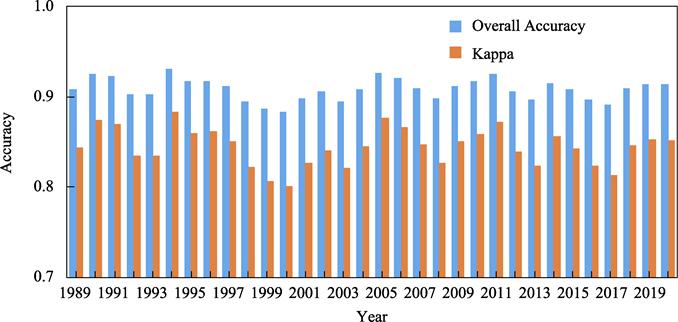
Figure 5 Overall accuracies and Kappa coefficients
of the maps
5 Conclusion
The dataset is annual and has
a spatial resolution of 30 m. The overall accuracies of all the 32 maps show
their reliability. This dataset can be used in the spatio-temporal change
analysis, evaluation of coastal ecosystem services and decision-making of sustainable
developments for tidal flat wetlands in China.
Author Contributions
Cui, L. J., Wang, C. and Wu, G. F. made conceptual
design and provided financial support. Xu, Y. and Zhang, K. Y. collected and
processed sample data and images. Hu, Z. W. and Zhang, K. Y. designed
algorithms. Yin, Y. M. contributed to dataset validation. Hu, Z. W. and Xu, Y.
prepared the paper, and Cui, L. J., Wang, C. and Wu, G. F. revised the paper.
Conflicts of Interest
The authors declare no conflicts of interest.
References
[1]
Zhang,
X., Li, P. Y., Li, P., et al. Present
conditions and prospects of study on coastal wetlands in China [J]. Advances
in Marine Science, 2005, 23(1): 87–95.
[2]
Yao,
H. Characterizing landuse changes in 1990–2010 in the coastal zone of Nantong,
Jiangsu province, China [J]. Ocean & Coastal Management, 2013, 71: 108–15.
[3]
Wen,
Q., Zhang, Z., Xu, J., et al. Spatial
and temporal change of wetlands in Bohai rim during 2000–2008: an analysis based on satellite images [J]. Journal of Remote
Sensing, 2011, 15(1): 183–200.
[4]
Hu,
Z. W., Xu, Y., Yin, Y. M., et al.
Tidal flats dataset covers coastal region in north of 18??N latitude of China
(1989–2020) [J/DB/OL]. Digital Journal of
Global Change Data Repository,
2021. https://doi.org/10.3974/geodb.2021.10.06.V1. https://cstr.escience.org.cn/CSTR:20146.11.2021.10.06.V1.
[5]
Wang, G. Definition of coastal tidal flats
[J]. Chinese Fishery Economy, 2013(1): 99–104.
[6]
GCdataPR
Editorial Office. GCdataPR data sharing policy [OL].
https://doi.org/10.3974/dp.policy.2014.05 (Updated 2017).
[7]
Fang, R, K. Environmental Dictionary [M]. Beijing:
Science Press, 2003.
[8]
Peng, J., Wang, Y, L. Study of coastal
tidalflats in China [J]. Journal of Peking University (Natural Science), 2000,
36(6): 832–839.
[9]
Su, S. J. Comprehensive survey of coastal
zone and tideland resources in China in the past seven years [J]. Marine and
Coastal Zone Development, 1988, (2): 30–32.
[10]
Wessel, P., Smith, W. H. F. A global,
self-consistent, hierarchical, high-resolution shoreline database [J]. Journal
of Geophysical Research Solid Earth, 1996, 101(B4): 8741–8743.
[11]
Foga,
S., Scaramuzza, P. L., Guo, S., et al.
Cloud detection algorithm comparison and validation for operational Landsat
data products [J]. Remote Sensing of Environment, 2017, 194: 379–390.
[12]
Zhang,
K. Y., Dong, X. Y., Liu, Z. G., et al.
Mapping tidal flats with Landsat 8 images and Google Earth Engine: a case study
of the China??s eastern coastal zone circa 2015 [J]. Remote Sensing,
2019, 11(8): 924.
[13]
Cheng,
B., Liu, Y., Liu, X., et al. Research
on extraction method of coastal aquaculture areas on high resolution remote
sensing image based on multi-features fusion [J]. Remote Sensing Technology
and Application, 2018, 33(2): 296–304.
[14]
Gong,
C., Gang, D., Wang, D. Remote sensing monitoring water area of Dongting lake
based on MNDWI [J]. Journal of Water Resources Research, 2015, 4(3): 234–239.
[15]
Dong, Z. Y., Wang, Z. M., Liu, D. W., et al. Mapping wetland areas using
Landsat-derived NDVI and LSWI: a case study of west Songnen Plain, Northeast
China [J]. Journal of the Indian Society of Remote Sensing, 2014, 42(3):
569–576.
[16]
Nguyen,
C. T., Chidthaisong, A., Diem, P. K., et
al. A Modified bare soil index to identify bare land Features during
agricultural Fallow-Period in Southeast Asia using Landsat 8 [J]. Land,
2021, 10(3): 1–18.
[17]
Guo,
B., Zang, W. Q., Zhang, R. Soil salizanation information in the Yellow River
Delta based on feature surface models using Landsat 8 OLI Data [J]. Ieee
Access, 2020, 11(1): 288–300.
[18]
Zhang,
J. H., Feng, L. L., Yao, F. M. Improved maize cultivated area estimation over a
large scale combining MODIS-EVI time series data and crop phenological
information [J]. Isprs Journal of Photogrammetry and Remote Sensing,
2014, 94: 102–113.
[19]
Malik, M., Shukla, J. P., MishraI, S. Relationship of
LST, NDBI and NDVI using Landsat-8 data in Kandaihimmat Watershed,
Hoshangabad, India [J]. Indian Journal of Geo-Marine Sciences, 2019,
48(1): 25–31.
[20]
Breiman,
L. Random forests [J]. Machine Learning, 2001, 45(1): 35–32.