Development of Time Series of Nighttime Light Dataset of
China (2000-2020)
Zhong, X. Y1,2 Yan, Q. W1,3* Li, G. E1,3
1. Observation and Research Station of Ministry of
Education for Resource Exhausted Mining Area Land Restoration and Ecological
Succession, China University of Mining and Technology, Xuzhou 221116, China;
2. School of Environment and Spatial Informatics, China
University of Mining and Technology, Xuzhou 221116, China;
3. School
of Public Policy and Management School of Emergency Management, China
University of Mining and Technology, Xuzhou 221116, China
Abstract: Nighttime light image
data are a reflection of the brightness of the earth??s surface light at night
and represent the intensity of human activity. The long time series of
nighttime light data provide an important reference for urban development.
Based on version 4 of the Defense Meteorological Satellite Program Operational
Linescan System (DMSP/OLS) nighttime light data and monthly Suomi National
Polar-orbiting Partnership Visible Infrared Imaging Radiometer Suite
(NPP/VIIRS) nighttime light data, the long time series nighttime light dataset
of China (2000-2020) has been developed based on the use of data pretreatment,
data correction and data fusion from the annual DMSP/OLS (2000-2013) nighttime light data and the monthly NPP/VIIRS (April 2012
to December 2020) nighttime light data. The dataset consists of four parts: (1)
the revised EANTLI nighttime data from 2000 to 2013; (2) the processed monthly
NPP/VIIRS nighttime light data from April 2012 to December 2020; (3) the annual
NPP/VIIRS nighttime light data from 2012 to 2020; (4) the annual EANTLI_Like
nighttime light data from 2000 to 2020. The spatial resolution of the monthly
and annual NPP/VIIRS nighttime light data is 500 m, and for the others it is 1
km. The dataset is archived in .tif data format and consists of 750 data files
of data size 2.21 GB (compressed into 1.71 GB in 6 files).
Keywords: DMSP/OLS;
NPP/VIIRS; nighttime light remote sensing; data fusion
DOI: https://doi.org/10.3974/geodp.2022.03.12
CSTR: https://cstr.escience.org.cn/CSTR:20146.14.2022.03.12
Dataset Availability Statement:
The dataset
supporting this paper was published and is accessible through the Digital Journal of
Global Change Data Repository at: https://doi.org/10.3974/geodb.2022.06.01.V1 or
https://cstr.escience.org.cn/CSTR:20146.11.2022.06.01.V1.
1 Introduction
Nighttime
light data offer the ability to measure the intensity of light emitted by
sources on the earth??s surface at night such as urban lighting and natural
fires, which reflect the characteristics of urban lighting and natural sources[1].
Nighttime light data are large-scale and multi-temporal, and they may serve to
characterize the intensity of human activities. Nowadays, nighttime light data
from global satellite observations have been used widely as the geospatial data
product[2]. As the most common nighttime light data, the DMSP/OLS and
NPP/VIIRS data are widely used to assess urban sprawl, air pollution, and serve
as an estimation of socio-economic indicators[3–5].
Given the differences in the sensors, the temporal-spatial resolution, the data
processing methods, and the meaning of the pixel values between DMSP/OLS and
NPP/VIIRS data, it is difficult to realize a reliable integration of long time
series nighttime light data[6]. The aforementioned
issues seriously limit the potential applications of nighttime light data and
can impact on the research based on night light data.
The dataset
described in this study was based on the collection of DMSP/OLS (2000-2013) and monthly NPP/VIIRS (April 2012-December 2020) data. The EANTLI data and the annual NPP/VIIRS data
were obtained by procession of annually DMSP/OLS data correction and annual
NPP/VIIRS data synthesis from monthly data. The long time series EANTLI_Like
data were obtained by fusion of the EANTLI data and the annual NPP/VIIRS data.
This dataset can be used as a research tool for research in urban development
and provide basic support for research on urban planning, urban expansion, urban
contraction, and urban structure.
2 Metadata of the Dataset
The
metadata of the Long time series nighttime light dataset of China (2000-2020)[7] are summarized in Table 1. The metadata include
the full name of the dataset, the short name, the authors, the year of the
dataset, the temporal resolution, the spatial resolution, the data format, the
data size, the data files, the publisher of the data, and the data sharing
policy, etc.
3 Methods
3.1 Data Collection
The DMSP/OLS data
selected for this study were obtained from 22 stable sources of light data from
different sensors over the period 2000 to 2013 (e.g., F14, F15, F16, and F18),
and were downloaded from the National Centers for Environmental Information of
National Geophysical Data Center (NGDC)[1].
The monthly NPP/VIIRS data were produced by the Earth Observation Group (EOG)
at the Payne Institute for Public Policy at the Colorado School of Mines and
downloaded from the website of the EOG[2].
The mean annual
enhanced vegetation index (EVI) data were used for correction of the saturation
of the DMSP/OLS to minimize the saturation problem. The mean annual EVI data
were produced from the MOD13A1 EVI data using Google Earth Engine.
3.2 Algorithm Principle
In
this study, the DMSP/OLS and NPP/VIIRS data were used mainly to produce
multiple nighttime light data over the period 2000 to 2020 by data
preprocessing, correction and fusion.
Table
1 Metadata summary of the Long time
series nighttime light dataset of China (2000-2020)
|
Items
|
Description
|
|
Dataset full name
|
Long time series
nighttime light dataset of China (2000-2020)
|
|
Dataset short
name
|
NTLChina_2000-2020
|
|
Authors
|
Zhong, X. Y.,
School of Environment and Spatial Informatics, China University of Mining and
Technology, 851676389@qq.com
Yan, Q. W.,
Observation and Research Station of Ministry of Education for Resource
Exhausted Mining Area Land Restoration and Ecological Succession, China
University of Min-ing and Technology, yanqingwu@cumt.edu.cn
|
|
Geographical
region
|
China
|
|
Year
|
2000-2020
|
|
|
Temporal
resolution
|
Monthly, annually
|
Spatial resolution
|
500 m, 1,000 m
|
|
Data format
|
.tif
|
Data size 2.21 GB (1.71 GB
after compression)
|
|
Data files
|
EANTLI nighttime
data from 2000 to 2013; monthly NPP-VIIRS nighttime light data from April
2012 to December 2020; annual NPP-VIIRS nighttime light data from 2012 to
2020; annual EANTLI-Like nighttime light data from 2000 to 2020
|
|
Foundations
|
The Fundamental
Research Funds for the Central Universities (2021ZDPY0205); The National
Special Project for Basic Science and Technology (2014FY110800); National
Natural Science Foundation of China (42101459)
|
|
Computing environment
|
ArcGIS, Google
Earth Engine, Origin
|
|
Data publisher
|
Global Change Research Data Publishing & Repository,
http://www.geodoi.ac.cn
|
|
Address
|
No. 11A, Datun
Road, Chaoyang District, Beijing 100101, China
|
|
Data sharing
policy
|
Data from the Global
Change Research Data Publishing & Repository includes metadata, datasets (in the Digital Journal of Global Change Data Repository), and
publications (in the Journal of Global Change Data & Discovery). Data sharing policy includes: (1) Data are openly
available and can be free downloaded via the Internet; (2) End users are
encouraged to use Data subject to citation; (3) Users, who are by definition
also value-added service providers, are welcome to redistribute Data
subject to written permission from the GCdataPR Editorial Office and the
issuance of a Data redistribution license; and (4) If Data are used to
compile new datasets, the ??ten per cent principal?? should be followed such that
Data
records utilized should not surpass 10% of the new dataset contents, while
sources should be clearly noted in suitable places in the new dataset[8]
|
|
Communication and searchable system
|
DOI, CSTR, Crossref, DCI, CSCD,
CNKI, SciEngine, WDS/ISC, GEOSS
|
3.2.1 DMSP/OLS Data Procession
The
EANTLI data of 2000–2013 were obtained by data preprocessing, mutual correction
and correction for saturation of the DMSP/OLS data. Mutual correction includes multi-sensor correction[9], annual fusion, and comparable
correction for the time series data[10]. To alleviate
the saturation effect of the DMSP/OLS, the enhanced vegetation index adjusted
NTL index (EANTLI) [11] was used after mutual correction of
the DMSP/OLS data of 2000 to 2013. The index can be expressed mathematically by
the following equation:
 (1)
(1)
where
NTL represents the DN value of the DMSP/OLS data and nNTL
is the normalized NTL, and EVI indicates the mean annual EVI
value. The differences between the monthly dark images and the average annual
number of dark images at the 95% split points in the NPP / VIIRS monthly data
dark pixel histogram coincide.
3.2.2 NPP/VIIRS Data Procession
The
monthly NPP/VIIRS data of April 2012 to December 2020 and the annual NPP/VIIRS
data of 2012-2020 were compiled using data
preprocessing, outlier processing and annual synthesis based on the median
values. Outlier processing included noise reduction and treatment of extreme
values.
During the noise
reduction of the monthly NPP/VIIRS data, it was found that the difference
between the dark pixel (values below 1 nW·cm−2·sr−1) of
the monthly NPP/VIIRS data and the average annual NPP/VIIRS in the 95% split
point of the histogram was found to be consistent. Due to this, Noise Reduction
Based on Flexible Threshold (NRBFT) was adopted to remove the noise whereby the
95% split point in the dark pixel histogram was taken as the minimum threshold
for the dark pixel.
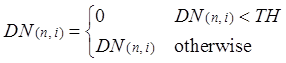 (2)
(2)
where
DN(n,i) represents the pixel radiance of the NPP/VIIRS data,
and TH indicates the minimum threshold (the 95% split point in the dark pixel
histogram) between normal dark pixel and the noise.
Taking the NPP/VIIRS data of December 2020
as an example, the difference between the dark pixels of the NPP/VIIRS data of
December 2020 and the average NPP/VIIRS data of 2020 at the 95% split point of
histogram was consistent (Figure 1a). This meant that the
95% split point
of histogram can separate most of the noise. This also showed that the dark
pixels within 95% of the histogram points contain most of the noise and rest of
the dark pixels are normal pixels distributed around the bright pixels (Figure
1b).
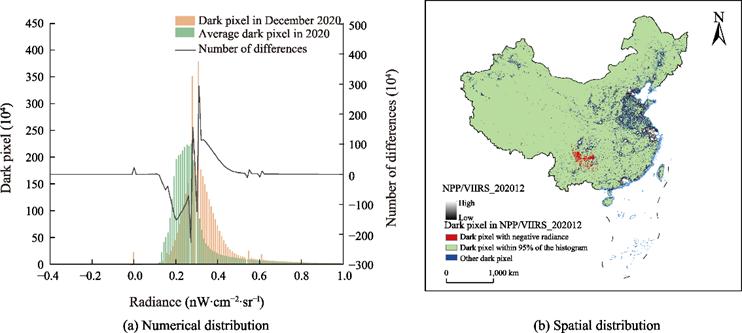
Figure
1 Distribution of dark pixels of the
NPP/VIIRS image in China in December 2020
|
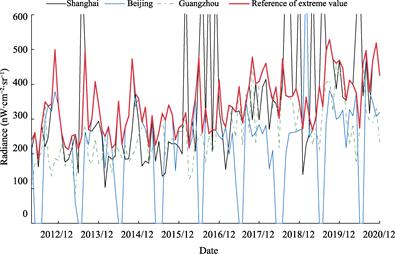
Figure 2 Monthly
maximum value of NPP/VIIRS
|
The monthly
NPP/VIIRS data have some extremely high brightness pixels due to the influence
of abnormally high reflective surface. Therefore, it is necessary to include
extremely high values in the image. It is presumed that the nighttime light in
other urban areas do not exceed the maximum nighttime light emanating from the
center of megacities (Shanghai, Beijing, and Guangzhou)[12]. Abnormal pixels whose intensity values exceeded extreme values were
removed dynamically using 5 ?? 5 mean filtering. Figure 2 showed that the
monthly maximum value in Shanghai, Beijing and Guangzhou and extreme value
reference values used in extreme value treatment.
3.2.3 Data Fusion of Long Time Series Nighttime Light Data
In
traditional research, it is difficult to combine both the accuracy and high
dynamic range of the values at different data. Long time series nighttime light
data fusion has been proposed based on the EANTLI and NPP/VIIRS data. First,
the annual NPP/VIIRS synthetic data were resampled spatially based on the
kernel density[13]. This data treatment can make uniform
the spatial resolution of the different nighttime light data. Then, the
brightness value attributes of the nighttime light data were unified by
logarithmic transformation, construction of the fitting model and exponential
transformation. Finally, the long time series EANTLI_like data were obtained by
continuity correction of the time series nighttime light data of 2000 to 2020[10].
As shown in Figure 3, a characteristic ??S??-shaped curve between the EANTLI data
and the annual NPP/VIIRS data may be obtained after logarithmic transformation.
Therefore, the logistic model with ??S??-shaped curve characteristics can be used
for the fitting model, and the Boltzmann function (Equation 3) gives the best
fit.
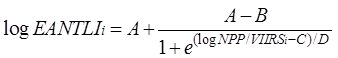 (3)
(3)
where
logNPP/VIIRS represents the pixel value of the NPP/VIIRS data after
logarithmic transformation, and logEANTLI is the pixel value of the
EANTLI_Like data after logarithmic transformation, and which were obtained by
fitting the Boltzmann function to the NPP/VIIRS data after logarithmic
transformation. A, B, C and D are parameters in the Boltzmann function, the
values being ‒1.395,1, 6.966,3, 1.125,7, and 1.304,4 after fitting,
respectively.

Figure 3 Scatter
density plots of nighttime light image in China in 2013
3.3 Technical Route
As
outlined in Figure 4, the main development process for the dataset consists of
the following. First, the annual DMSP/OLS data (annual EANTLI data) are
obtained by data preprocessing, mutual correction, and saturation correction of
the DMSP/OLS image (2000-2013). At
the same time, the annual NPP/VIIRS data (2012-2020) are composed by data preprocessing, outlier processing and
annual synthesis based on the median values. The annual EANTLI data and
NPP/VIIRS data are used in order to combine the long time series nighttime
light data (EANTLI_Like data), including integration of the spatial resolution,
construction of the fitting model and continuity correction of the time series
of the two types of nighttime light data.
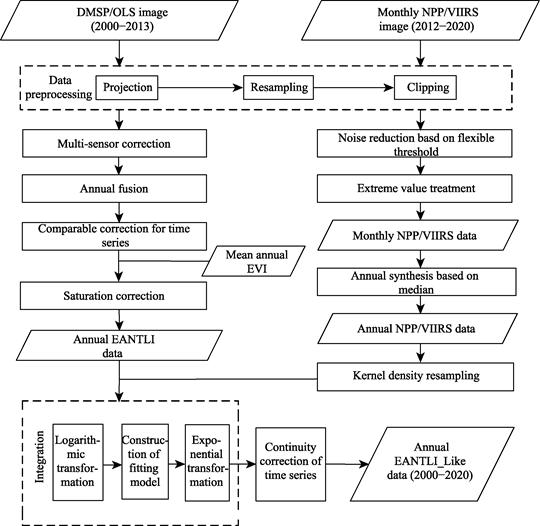
Figure 4 Flowchart for data processing
4 Data Results and Validation
4.1 Data Composition
The long time series nighttime light dataset of
China includes mainly the annual EANTLI dataset of 2000-2013, the monthly NPP/VIIRS dataset of
April 2012-December 2020, the annual NPP/VIIRS dataset of
2012-2020 and the EANTLI_Like dataset of 2000-2020 (Table 2).
Table 2 Composition of dataset and description
|
Folder name
|
Nomenclature
|
Data introduction
|
Data format
|
Data record
|
Data size
|
|
EANTLI_2000-2013
|
EANTLI_yyyy
|
EANTLI data of yyyy
|
.tif
|
14
|
122 MB
|
|
NPP_VIIRS_201204-201412
|
NPP_VIIRS_yyyymm
|
Monthly NPP/VIIRS data of mm, yyyy
|
.tif
|
105
|
1.26 GB
|
|
NPP_VIIRS_2012-2020
|
NPP_VIIRS_yyyy
|
NPP/VIIRS data of yyyy
|
.tif
|
9
|
121 MB
|
|
EANTLI_Like_2000-2020
|
EANTLI_Like_yyyy
|
EANTLI_Like data of yyyy
|
.tif
|
21
|
219 MB
|
Notes: Each
dataset consists of five files. Where .tif is the image file, .tfw is the image
coordinate file, tif.ovr is the pyramid file, tif., .aux, .xml is the auxiliary
image file, and .tif, .xml is the text information of the image.
4.2 Data Results
To
reveal the trend of nighttime light, the total DN values and the total
illuminated pixels in the six regions of China were divided into statistical
groups. Except for northeast China and north China, the total DN values in the
other four regions all showed a continuous upward trend, among which the total
DN value for east China which had a more developed economic level increased the
most. The combined total DN value in northeast China and north China both
declined somewhat during 2011-2014,
probably due to a decreased population and a decrease in the urban night
vitality in the northern region of China during this period (Figure 5a). In
addition to northeast China, the total lit pixels in the other five regions
showed an increasing trend, among which the total lit pixels in northwest China
and southwest China increased significantly between 2012 and 2013 (Figure 5b).
This may have been caused by the rise of infrastructure construction in the
western region. In addition, because the spatial resolution for the NPP/VIIRS
raw data is higher than that for the DMSP/OLS data, more small nighttime light
areas in the western region may have been retained. The total number of lit
pixels in Northeast China dropped significantly for many times, which indicates
that there was not only a loss of population, but also the phenomenon of urban
contraction, whereby the nighttime light in some areas had become dimmer or
even disappeared.

Figure 5 Nighttime light changes in the six regions of China
4.3 Data Validation
The
time series of nighttime light data (EANTLI_Like data) obtained in this study
were compared with that of Chen[14]. Due to the different spatial
resolutions of the EANTLI_Like data and the NPP/VIIRS_Like data, more attention
needs to be paid to the change rather than the size of the values. It was shown
that the mean value, the standard deviation, the information entropy, and the
average gradient of the EANTLI_Like data were larger than those for the
NPP/VIIRS_Like data. The trend for the various indicators of the EANTLI_Like
data was relatively smooth, and shows a stable upward trend, while the
indicators for the NPP/VIIRS_Like data have certain fluctuations, and the
changes are irregular (Figure 6).
The nighttime
light data are highly correlated with the socio-economic data, and Figure 7
shows the comparison between the EANTLI_Like data and the NPP/VIIRS_like data
and including the linear regression coefficients R2 for the GDP and electricity consumption at the
provincial level. Except for 2018-2020, the
R2 value for EANTLI_like and GDP was better than that for the
NPP/VIIRS_Like data. The mean R2
values for both datasets were 0.851,6 and 0.787,7, respectively. This means
that compared to the NPP/VIIRS_Like data, the correlation between the
EANTLI_Like data and the GDP at the provincial scale was increased
significantly (Figure 7a). The R2
value for the EANTLI_Like data and power consumption was always higher than
that for the NPP/VIIRS_Like, with average values of 0.859,7 and 0.768,9,
respectively. This means that the EANTLI_Like data are more relevant for
gauging the socioeconomic parameters at the provincial level (Figure 7b).
5 Discussion and Conclusion
The long time series
nighttime light dataset for China was obtained by image correction and
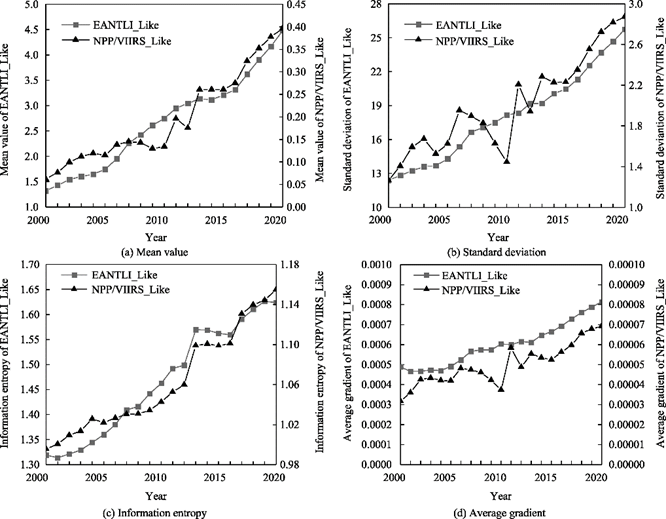
Figure 6 Statistical attributes of
time-series of nighttime light images
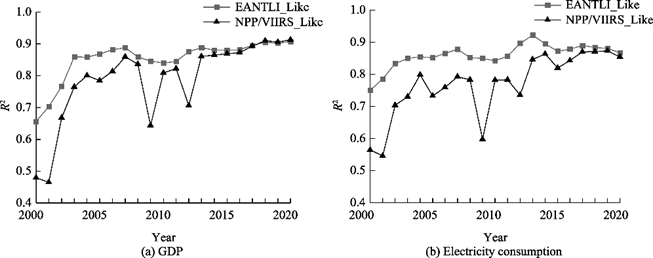
Figure 7 Determinations
of the linear regression coefficients for GDP, electricity consumption and
time-series of nighttime light data at the provincial scale
data
fusion based on processing the annual DMSP/OLS data and the monthly NPP/VIIRS
data. The EANTLI data, and the monthly and annual NPP/VIIRS data were uploaded
to share as interim development. The dataset covered all the annual nighttime
light images for 2000-2020 and
the monthly nighttime light images for April 2012-December 2020. The NRBFT was adopted for processing outliers in the
monthly NPP/VIIRS data. This method can remove most of the noise and retain the
normal dark pixels without other auxiliary data.
When
constructing the long time series nighttime light data, existing studies have
mostly built models based on DMSP/OLS and NPP/VIIRS data and achieved
DMSP/OLS_like data with low resolution[13],
or combined EVI data to obtain NPP/VIIRS_like data using machine learning with
high resolution[14]. The former does not deal with the
saturation effect of the DMSP/OLS data but does reduce the range of brightness
of the NPP/VIIRS data. It is difficult to take full advantage of the high
dynamic range of the brightness values of the NPP/VIIRS data. The latter uses
machine learning to improve the spatial resolution and the range of brightness
values of the DMSP/OLS, however, it is unable process unstable pixels in the
time series, and it will have an impact on the temporal continuity of the data.
The EANTLI data were realized by combining the EVI data for saturation
correction of the DMSP/OLS data, which have a lower saturation effect and a
higher dynamic range of brightness values. Continuity correction of the time
series was applied after integration of the temporal and spatial resolution
between the DMSP/OLS data and the NPP/VIIRS data, which can ensure the
consistency of the pixel brightness and remove unstable pixels in the time
series.
The time series of
nighttime light data of this dataset has strong temporal continuity, and strong
correlation with socioeconomic data. Verification of accuracy demonstrates that
the dataset is reliable. The dataset can be used to analyze the evolution of
urban night light in China and serve in supporting research on urban
development, including evaluation of topics such as urban vitality, urban
expansion, and urban contraction.
Author Contributions
Zhong,
X. Y. was responsible for data processing and analysis and wrote the paper;
Yan, Q. W. planned the experimental design and preparation of the final
dataset; Li, G. E. was responsible for verification of the data.
Conflicts of Interest
The
authors declare no conflicts of interest.
References
[1] Zheng, Q. Nighttime light data processing methodologies and
polycentric city monitoring [D]. Hangzhou: Zhejiang University, 2020.
[2] Chen, Y., Zheng, Z., Wu, Z.,
et al. Review and prospect of application of nighttime light remote sensing
data [J]. Progress in Geography,
2019, 38(2): 205‒223.
[3] Dong, H., Li, R., Li, J., et
al. Study on urban spatiotemporal expansion pattern of three first-class
urban agglomerations in China derived from integrated DMSP-OLS and NPP-VIIRS
nighttime light data [J]. Journal of
Geo-information Science, 2020, 22: 1161‒1174
[4] Zhao, X., Xia, X., Liu, X., et
al. Combining DMSP/OLS nighttime light with Echo State Network for
prediction of daily PM2.5 average concentrations in Shanghai, China
[J]. Atmosphere, 2015, 6: 1507-1520.
[5] Elvidge, C. D. A fifteen year record of global natural gas flaring
derived from satellite data [J]. Energies,
2009, 3: 595‒622.
[6] Levin, N., Kyba, C., Zhang, Q., et
al. Remote sensing of night lights: a review and an outlook for the future
[J]. Remote Sensing of Environment,
2020, 237(C): 111443.
[7] Zhong, X., Yan, Q., Li, G. Long time series nighttime light dataset
of China (2000-2020) [J/DB/OL]. Digital Journal of Global Change Data Repository,
2022. https://doi.org/10.3974/geodb.2022.06.01.V1. https://cstr.escience.org.cn/CSTR:20146.11.2022.06.01.V1.
[8] GCdataPR Editorial Office. GCdataPR data sharing policy [OL].
https://doi.org/10.3974/dp.policy.2014.05 (Updated 2017).
[9] Cao, Z., Wu, Z., Mi, S., et al.
A method for classified correction of stable DMSP/OLS nighttime light imagery
across China [J]. Journal of
Geo-information Science, 2020, 22: 246‒257.
[10] Zhong, X., Yan, Q., Li, F., et
al. A continuous correction method for years of DMSP/OLS nighttime light
images in urban shrinkage area [J].
Geography and Geo-Information Science, 2021, 37: 46-51.
[11] Zhuo, L., Zhang, X., Zheng, J., et
al. An EVI-based method to reduce saturation of DMSP/OLS nighttime light
data [J]. Acta Geographica Sinica,
2015, 70: 1339‒1350.
[12] Li, M., Cai, W. Calibration for multi-temporal
NPP/VIIRS nighttime light remote sensing images [J]. Bulletin of surveying and mapping, 2019(7): 122‒126.
[13] Zhao, M., Zhou, Y., Li, X., et
al. Building a series of consistent night-time light data (1992-2018) in Southeast Asia by integrating DMSP-OLS and NPP-VIIRS [J]. IEEE Transactions on Geoscience and Remote
Sensing, 2019, 99: 1‒14.
[14] Chen, Z., Yu, B., Yang, C., et
al. An extended time series (2000–2018) of global NPP-VIIRS-like nighttime
light data from a cross-sensor calibration [J]. Earth System Science Data, 2021, 13: 889‒906.