Dataset Development of Global Railway Length in Operation
(1825?C2021)
Li, Y. L. Yu, Y. H.* Cai, J.
School of Architecture and Fine
Arts, Dalian University of Technology, Dalian 116023, China
Abstract: As the backbone of modern transportation
infrastructure, railways not only embody the level of transport development in
different countries, but also capture the profound transformations in economic,
social, and geopolitical structures. To address the gaps in historical data on
the global length of railways in operation, this study integrates data from
Brian Mitchell??s International historical statistics, the World Bank, the
International Union of Railways, and national statistical offices to construct
a dataset of the global length of railways in operation for the period from
1825 to 2021. The missing data were systematically categorized into 3 types:
mid-series gaps, end-period gaps, and gaps caused by national boundary
adjustments. To complete the dataset, we apply linear interpolation,
regression-based forecasting, and static/dynamic weighting methods tailored to
each type. Building on the reconstructed dataset, we conduct a spatiotemporal
analysis of global railway development at regional as well as national scales.
The findings reveal that: (1) global railway development can be divided into 5
distinct stages with clear phases and fluctuations; (2) significant regional
disparities exist, with Europe and North America leading in the early stages,
and Asian countries emerging as key growth engines in the 21st century; and (3)
railway development has been shaped significantly by geopolitical and
geo-economic dynamics, with shifting patterns of interaction across historical
periods that determine the trajectory of global railway evolution. This study
provides systematic data support for understanding the historical evolution of
global infrastructure, establishing a solid foundation for exploring the
interplay between transportation and socioeconomic changes.
Keywords: global; railway operating length; stage division;
evolution trajectory; regional differentiation
DOI: https://doi.org/10.3974/geodp.2025.03.03
Dataset Availability Statement:
The dataset
supporting this paper was published and is accessible through the Digital Journal of
Global Change Data Repository at:
https://doi.org/10.3974/geodb.2025.08.07.V1.
1 Introduction
As a core component of modern
transportation systems, railways play a vital role in national, economic, and
social development. Since the advent of modern railway technology in the 19th
century, railway networks have expanded rapidly, forming highly interconnected
transport systems on a global scale. Railways have profoundly influenced urban
systems, regional development, national spatial organization, and the global
transport network by improving accessibility, reducing transport costs, and
strengthening the connectivity of key cities and regions. The length of
operational railways serves as a key indicator of railway development, directly
reflecting the scale of infrastructure construction and service capacity in a
given country or region. Analyzing long-term trends not only reveals the
overall patterns and evolutionary paths of global transport infrastructure but
also deepens our understanding, through cross-country comparisons, of how
factors such as economic stage, geographic conditions, and institutional
settings shape railway construction. Moreover, such analysis elucidates shifts
in global infrastructure investment priorities and highlights the persistent
issue of regional imbalances. Thus, systematically examining the spatiotemporal
evolution of the length of operational railways and its driving forces is of
significant theoretical and practical value for advancing our understanding of
the interaction between transportation infrastructure and socio-economic
development.
However, integrating historical data on the length of operational
railways on a global scale presents several challenges. Wars, economic
disruptions, and technological constraints have frequently resulted in missing
data for certain historical periods, undermining the continuity of the time
series. Additionally, profound geopolitical transformations, such as the
dissolution of multinational states, including the Soviet Union and the
Austro-Hungarian Empire, have made it difficult to reconcile historical records
with current national borders, further complicating data integration. These
issues have constrained systematic, long-term, and cross-regional comparative
research on railway development. Consequently, building a consistent and
comparable historical data framework is crucial for advancing the global
railway research.
To address these challenges, this study systematically compiles data
on the global length of railways in operation from 1825 to 2021 (covering
conventional railways but excluding high-speed railways). The primary data
source is Brian Mitchell??s International historical statistics, 1750?C2010[1],
while the post-2010 data are drawn from the World Bank, International Union of
Railways (UIC), and official publications of national statistical offices. The
resulting dataset covers 133 countries and regions across 5 continents.
2 Metadata of the Dataset
The
metadata of the Global dataset on the length of railways in operation
(1825?C2021)[2], including the title, authors, geographic coverage, temporal
resolution, data format, dataset composition, etc., are summarized in Table 1.
3 Methods
3.1 Data Sources
The
dataset is primarily compiled from International historical statistics,
1750?C2010[1], the World Bank[4], and official publications of national statistical offices. It
covers the annual data on the length of railways in operation for the period
from 1825 to 2021. Given that some countries have not yet developed railway
infrastructure and that historical archives are incomplete or not publicly
accessible in certain cases, data acquisition proved to be challenging. The
final dataset includes 133 countries and regions worldwide, accounting for
approximately 56.7% of all countries and territories. These are distributed
across the 5 continents: 29 in the Americas, 36 in Europe, 30 in Asia, 36 in
Africa, and 2 in Oceania.
Table 1 Metadata summary of Global dataset on the
length of railways in operation (1825?C2021)
|
Items
|
Description
|
|
Dataset full name
|
Global dataset on the length of railways in operation (1825?C2021)
|
|
Dataset short name
|
Railway1825-2021
|
|
Authors
|
Li,
Y. L., School of Architecture and Fine Arts, Dalian University of
Technology, yongling1004@hotmail.com
Yu,
Y. H., School of Architecture and Fine Arts, Dalian University of Technology,
937952896@qq.com
Cai,
J., School of Architecture and Fine Arts, Dalian University of Technology,
caimans@dlut.edu.cn
|
|
Geographical region
|
133 countries and regions in 5 continents globally (90??N?C60??S)
|
|
Year
|
1825?C2021
|
|
Temporal resolution
|
Year
|
|
Data format
|
.xlsx
|
|
Data size
|
1.43 MB
|
|
Data files
|
Length of railways in operation; Growth rate of the length of railways in
operation
|
|
Foundations
|
National Natural Science Foundation of China (42201186, 42371177)
|
|
Data publisher
|
Global Change Research Data Publishing & Repository,
http://www.geodoi.ac.cn
|
|
Address
|
No. 11A, Datun Road, Chaoyang District, Beijing 100101, China
|
|
Data
sharing policy
|
(1) Data
are openly available and can be free downloaded via the Internet; (2) End
users are encouraged to use Data subject to citation; (3) Users, who
are by definition also value-added service providers, are welcome to
redistribute Data subject to written permission from the GCdataPR
Editorial Office and the issuance of a Data redistribution license;
and (4) If Data are used to compile new datasets, the ??ten percent
principal?? should be followed such that Data records utilized should
not surpass 10% of the new dataset contents, while sources should be clearly
noted in suitable places in the new dataset[3]
|
|
Communication and searchable system
|
DOI,
CSTR, Crossref, DCI, CSCD, CNKI, SciEngine, WDS, GEOSS, PubScholar, CKRSC
|
3.2 Missing Data Treatment
The
dataset spans 1825?C2021, covering 133 countries and regions across 5
continents. Owing to incomplete historical archives, approximately 17.07% of
the data were missing. Missing data can be classified into 3 categories: (1)
mid-series gaps, where data for a given country are missing for one or several
consecutive years within an otherwise continuous time series; (2) end-period
gaps, where data are missing toward the end of the time series, requiring
extrapolation of trends; and (3) boundary-related gaps, where geopolitical
changes, such as national boundary adjustments, necessitate the redistribution
of historical records to align with present-day borders.
To enhance
completeness and usability, we adopted different strategies for each type:
linear interpolation for mid-series gaps, linear regression forecasting for
end-period gaps, and static/dynamic weighting methods for boundary-related
gaps. Additional adjustments and optimizations were performed to ensure
consistency.
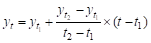
3.2.1 Mid-series Missing Data
For
cases where the length of railways in operation is missing for one or several
consecutive years within a country??s time series, we apply a linear
interpolation method. This approach uses observed values from adjacent years,
assuming that the railway length evolves linearly within the missing interval.
Compared with more complex interpolation or fitting techniques, linear
interpolation requires no additional parameter assumptions, ensuring the
continuity of the time series while maintaining simplicity and
interpretability. It is particularly suitable in contexts where railway
development is relatively stable and the differences between pre- and post-gap
values are not substantial. This helps avoid biases that may arise from
overfitting or inappropriate parameterization. The Equation is as follows:
 (1)
(1)
where
 denotes the
length of the railways in operation (km) for the target year t;
denotes the
length of the railways in operation (km) for the target year t;  and
and  represent the 2
adjacent years with known values, and
represent the 2
adjacent years with known values, and and
and are the corresponding railway lengths (km). For each missing
year within the interpolation interval, the value can be estimated recursively
using this equation. This method not only demonstrates strong numerical
stability and logical consistency, but also maintains controllability and
transparency in reconstructing data when historical records are incomplete or
gaps are extensive. Consequently, it is widely employed for the restoration and
completion of historical statistical time-series data.
are the corresponding railway lengths (km). For each missing
year within the interpolation interval, the value can be estimated recursively
using this equation. This method not only demonstrates strong numerical
stability and logical consistency, but also maintains controllability and
transparency in reconstructing data when historical records are incomplete or
gaps are extensive. Consequently, it is widely employed for the restoration and
completion of historical statistical time-series data.
3.2.2 End-period Missing Data
For
missing data occurring at the end of the time series, requiring extrapolation
of railway length in operation for future years, we applied a linear regression
method to fit recent observations and construct a predictive model. In most
countries, recent trends in railway length indicate relative stability. Railway
systems in developed countries have largely matured, whereas the expansion of
railways in developing countries is typically constrained by policies and
funding, resulting in slow year-to-year changes. Therefore, linear regression
is well-suited for short-term forecasting, offering both applicability and
interpretability.
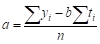
Specifically, we
fit a linear regression model using observations from the 5 years immediately
preceding the missing period. The slope extracted from the fitted trend was
then used for extrapolation. The parameters of the linear regression model??the
intercept a and slope b??were estimated using the following Equations:
 (2)
(2)
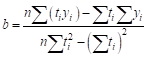 (3)
(3)
where and
and represent the year and corresponding length of the railways
in operation (km), respectively, and n denotes the number of years used
for model fitting (here, n=5). Based on this model, the value of the kth
future year can be predicted as follows:
represent the year and corresponding length of the railways
in operation (km), respectively, and n denotes the number of years used
for model fitting (here, n=5). Based on this model, the value of the kth
future year can be predicted as follows:
 , (4)
, (4)
where
k denotes the forecasting horizon in years (e.g., k=1 indicates a
one-year-ahead prediction).
3.2.3 Data Splitting and Allocation for Countries with Boundary
Reconstructions
Historical
changes in national boundaries pose significant challenges to the attribution
of railway length data. The processes of political disintegration, mergers, and
repeated boundary adjustments often result in historical records being compiled
under the jurisdiction of larger political entities, which cannot be directly
mapped to the present-day system of nation-states. Such spatial inconsistencies
undermine both the temporal continuity of railway statistics and cross-country
comparability. To address this issue, we distinguished 2 types of
boundary-related cases based on the structure of historical data:
The first
scenario is early aggregate data with later disaggregated national statistics.
In situations where only aggregate data for a larger political entity were
available in earlier periods and separate national records appeared after
disintegration or boundary stabilization, we employed a static weight
back-casting method. Specifically, the aggregate data were retroactively
disaggregated according to each country??s share of the regional total after the
borders were stabilized, thereby estimating the historical railway lengths for
individual countries.
The second
scenario is aggregate data during specific periods with independent statistics
before and after. This case typically arises when states undergo cycles of
merger and separation. In such situations, we adopted a dynamic weight
interpolation method. Here, the aggregate data were disaggregated through a
year-by-year linear interpolation of country-level shares observed at the
preceding and subsequent time points, allowing for a more accurate
reconstruction of structural changes in railway development.
(1) Static
weight retrospective method
For regions
lacking separate national railway data during historical periods and possessing
only modern national statistics after a country??s dissolution or border
demarcation, this study employed a static weight retrospective method for data
disaggregation. The specific procedure is as follows: first, obtain the railway
operating mileage data for each country after its borders have stabilized, and
calculate each country??s proportion of the total regional mileage. This
proportion was used as a weight to allocate the overall historical statistical
data retrospectively, thereby estimating each country??s contribution to the
historical total.
Taking the
Soviet Union as an example, this study selected the average annual railway
operating mileage of each member republic from the decade following its
dissolution (1992?C2001). This was used to calculate the respective weights of
the total regional mileage, which were then applied to disaggregate the overall
data from the Soviet era into individual countries. By constructing an average
weight from a stable period, this method effectively smoothened short-term data
fluctuations. Furthermore, considering the path-dependent nature of railway
networks ensured reasonable consistency between the disaggregation of
historical data and the actual spatial layout, thereby enabling a retrospective
estimation of each country??s historical railway data.
Assuming the
total railway operating mileage for a given year t before a change was  (km), and the
average railway operating mileage for the present-day country j in the
decade following the completion of border adjustments is
(km), and the
average railway operating mileage for the present-day country j in the
decade following the completion of border adjustments is  , the corresponding allocation
weight for country j is:
, the corresponding allocation
weight for country j is:
 (5)
(5)
where
J is the set of all the newly formed national units. Based on this, the
estimated railway operating mileage for country j in historical year t
can be calculated as:
 (6)
(6)
(2) Dynamic
weight interpolation method
For some
regions, historical railway data is only available as a regional total without
country-specific breakdowns; however, independent national railway data exists
both, before and after this period. To address this issue, we proposed a dynamic
weight interpolation method. This method uses the proportions of railway
mileage at two distinct time points (before and after the period of combined
data) to create a smoothly changing year-by-year weight series, enabling the
disaggregation of historical data by country.
Consider the
cases of Uganda, Kenya, and Tanzania, from 1948 to 1974, the railway systems of
the three countries were unified under the British East African Railways and
Harbors Corporation, with data recorded only in aggregate form. However,
country-specific railway data are available for 1947 (before unified
management) and 1975 (after countries began independent operations). Based on
the mileage proportions at these two time points, it was assumed that each
country??s share of the railway system gradually changed linearly during the
unified management period. This approach generates dynamic weights for each
year, which are then used to disaggregate the data into country-specific
figures. This method not only maintains consistency with regional totals but
also reflects the evolving structure of the railway system, aligning the
disaggregated results more with actual development trends.
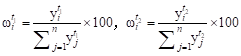
Specifically,
let the total regional railway operating mileage for a given year t be , which needs to be disaggregated into n national
units. Assuming that independent country-specific data are available for both
the year before disaggregation, , and the year after, , the weights for these two time points can be calculated
as:
 (7)
(7)
where
 is the railway
operating mileage (km) of country i in year t, i=1,2,
is the railway
operating mileage (km) of country i in year t, i=1,2, , n are the indices for all countries involved in the
allocation, and
, n are the indices for all countries involved in the
allocation, and  is the proportion
of country i in the regional total (%).
is the proportion
of country i in the regional total (%).
Based on this,
we constructed a linear weight function for each year t ,
,  within the time
period [, ]:
within the time
period [, ]:
 (8)
(8)
Then, the merged
total for that year, , was allocated according to the weight to obtain the
estimated value for country i:
 (9)
(9)
The dynamic weight
interpolation method is suitable for groups of countries where historical
statistics lack country-specific data for an intermediate period; however,
comparable independent data were available both before and after this period.
This method was particularly well suited for regions with relatively stable
railway development and a clear evolutionary pattern in each country??s
proportion of the total. Compared to the static weight retrospective method,
the dynamic interpolation method is better at reflecting how each country??s
share changes over time, thus improving the time sensitivity and accuracy of
historical data disaggregation.
4 Data Results and Validation
4.1 Dataset Composition
The
Global dataset on the length of railways in operation (1825?C2021) was archived
in an .xlsx format. It contained 27,186 data entries, comprising 1.43 MB of
data. The dataset included country names, continents, years, length of railway
in operation, railway operating growth rates, and data sources.
|
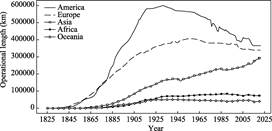
Figure
1 The trend of length of railways in
operation across the 5 continents
|
4.2 Data Results
4.2.1 Regional Level
Figure
1 shows the evolutionary trajectory of the railway operating mileage across the
five continents from 1825 to 2021. Based on developmental characteristics and
major historical events, the evolution of the global railway network can be
divided into 5 distinct phases, each exhibiting significant regional
differentiation.
Phase 1 (1825?C1870):
The period of emergence and diffusion. Driven by the Industrial Revolution and
the demands of colonial expansion, railways emerged first in Europe and North
America as a key transport mode for industrialization. Railway construction on
both continents demonstrated synchronous and rapid growth.
Phase 2 (1870?C1913):
The golden age of railway construction. The railway network in the Americas
experienced explosive expansion; Europe maintained stable growth; and Asia,
Africa, and Oceania successively launched their own railway construction booms,
propelling global railway mileage into an unprecedented period of high-speed
growth.
Phase 3 (1913?C1945):
The slump. Severely impacted by the two world wars and the Great Depression of
1929, global railway development fell into a slump. The length of the railway
in operation of the Americas shrank significantly because of the widespread
bankruptcy of US railway companies. Asia, Africa, and Oceania also experienced
varying degrees of decline as war-related destruction and economic depression
collectively constrained network expansion.
Phase 4 (1945?C2000): Regional differentiation. This phase
exhibited clear regional differences. While Asia maintained its
expansion momentum driven by government-led infrastructure projects, railway
operating mileage in other continents generally showed a downward trend.
Phase 5 (2000?C2021):
New growth cycle. Global railway development entered a new growth cycle with
Asia becoming its primary engine. The region achieved a remarkable 24.8%
increase in its railway operating mileage and its share of the global total
reached 26.5%. This growth was primarily fueled by China??s railway network
upgrades through large-scale new-line construction and the renovation of
existing lines.
4.2.2 National Level
Analyzed
at the national level, Figures 2?C6 illustrate the typical characteristics of
railway development in major countries across each continent.
In Europe
(Figure 2), the United Kingdom, as a pioneer of the railway revolution, rapidly
built a national network after completing the world??s first railway in 1825.
Its technical standards, management systems, and construction experience
profoundly impacted global railway development, with its length of railways in
operation reaching over 30,000 km before World War I. In contrast, Russia
exhibited a continental-style railway development model. The construction of
trunk lines, such as the Trans-Siberian Railway, in the late 19th century
established one of the world??s longest railway networks, which further expanded
to over 80,000 km during the Soviet era, becoming a core infrastructure
supporting national development and economic planning.
Western and
Central European regions showed differentiated development paths: Germany,
after unification, accelerated network integration through railway
nationalization, boosting heavy industry, and the formation of a unified
national market; France, conversely, adhered to state-led centralized planning,
constructing a radial network centered on Paris. Notably, despite its small
size, Belgium maintained a leading position in Europe for a long time because
of its early railway construction and high-density network.
|
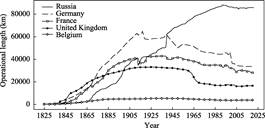
Figure 2 The trend of length of railways in
operation in typical European countries
|
|
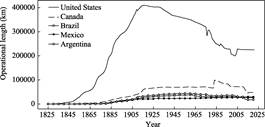
Figure 3 The trend of length of railways in
operation in typical American countries
|
The two world wars caused widespread destruction
of European railways, and post- war, they faced fierce competition from road
transport, leading to a continuous reduction in the length of railways in
operation for most countries. This trend reversed with the advent of the
high-speed rail era. The railway development trajectories of these countries
reflect the inherent logic of technological evolution and profoundly embody the
interactive relationship between national governance models and geopolitical
patterns.
In the Americas (Figure 3), railway development
exhibits distinct regional characteristics. The United States, a benchmark for
global railway development, saw its railway network peak in the early 20th
century, with the length of railways in operation exceeding 400,000 km, setting a world record. This remarkable achievement was due to a
period of rapid expansion in the latter half of the 19th century, when railways
were seen as critical infrastructure for connecting the east and west coasts
and promoting westward expansion. However, the Great Depression in 1929 was a
turning point. With the rise in road and air transport, the dominance of
railways in the transportation system gradually weakened, leading to a
continuous reduction in the length of operational railways[5].
Canada, as North
America??s second-largest railway nation, shares similarities with the US but
also has unique aspects in its development trajectory. Throughout the 20th
century, Canada??s railway network experienced stable growth, a trend that
shifted only after the Canadian National Railway implemented line optimization
adjustments in 1983.
|
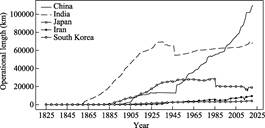
Figure 4 The trend of length of
railways in operation in typical Asian countries
|
Railway
development in Latin America exhibits a different pattern. The railway networks
of major countries, such as Brazil, Mexico, and Argentina, have been
constrained by factors, such as economic development levels, industrial policy
adjustments, and geographical conditions, generally exhibiting progressive
development characteristics, with the length of railways in operation
fluctuating within a relatively stable range over the long term. This
developmental disparity not only reflects the unique paths of industrialization
in each country but also profoundly illustrates the far-reaching impact of
changes in transportation modes on infrastructure development.
In Asia (Figure
4), railway development exhibits the distinct dual characteristics of the
colonial legacy and modern transformation. As a product of the British Empire??s
colonial system, Indian railways began in the mid-19th century, building a vast
network of over 60,000 km by the eve of independence in 1947. This colonial
legacy ensured its status as having the longest operational railway network in
Asia. During the Meiji Restoration (1868?C1912), Japan incorporated railway
construction into its national modernization strategy through technology
introduction and institutional innovation[6], forming a railway
system with both military and economic functions before World War II, and
ranking among the top in Asia in terms of operational efficiency and
technological level.
China??s railway
development has undergone a unique evolutionary trajectory: development was
slow from the late Qing Dynasty to the Republic of China period due to control
by foreign powers and wartime disruptions. After 1949, China gradually achieved
independent construction and entered an accelerated development phase after the
reform and opening up. Since 2008, the implementation of the high-speed rail
strategy has caused leapfrog development in China??s railways. In just over a
decade, the completion of the ??four vertical and four horizontal?? high-speed
rail backbone network made China the global leader in high-speed rail length[7].
This development not only reshaped the Asian railway landscape but also marked
a historic shift in global railway development, moving the focus from Europe
and North America to East Asia. The distinct railway development paths of these
three countries reflect the complex influences of colonial history, state
capacity, and developmental strategies on infrastructure construction.
|
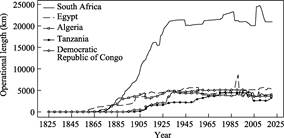
Figure 5 The trend of length of
railways in operation in typical African countries
|
On the African
continent (Figure 5), railway development exhibits a deep colonial imprint and
an unbalanced character. As a typical representation of the colonial transport
system, the construction of the African railway network began in the mid-to-late
19th century, with its layout entirely serving the resource import needs of the
European powers. South African railways were oriented towards gold and diamond
transport, Congolese railways focused on copper and rubber exports, and East
African railways became part of Britain??s ??Cape to Cairo?? colonial scheme[8].
This distorted
development led to Africa??s railways exhibiting ??three highs and three lows??:
high density of resource export lines but low inland connectivity, high
accessibility to coastal ports but low regional interconnectivity, and high
single-line transport capacity but low network coverage. South Africa was an
exception, with its railway network exceeding 20,000 km in the mid-20th century
owing to abundant mineral resources and a relatively mature industrial base.
Despite an early start, North African countries, such as Egypt and Algeria,
experienced long-term stagnation in railway development owing to their colonial
economic structure. Central African countries, such as the Democratic Republic
of Congo, witnessed severe decline in their railway systems due to
post-independence political instability, with some lines built during the
colonial period falling into complete disuse.
In Oceania,
railway development shows significant national differences (Figure 6).
Australia, the dominant force in the region??s railway development, began
railway network construction in the mid-19th century and experienced a
construction boom around the time of the Federation (1901). The peak length of
railways in operation exceeded 45,000 km in the 1920s. In the mid-to-late 20th
century, influenced by competition from road transport and fiscal tightening,
some branch lines were abandoned, while major trunk lines remained operational.
Notably, since the 21st century, with the boom in mining and the development of
urban rail transit, some regional railways have experienced a resurgence. In
contrast, New Zealand??s railway development is characterized by being ??small
and stable??, with its network size peaking at 5,700 km in the 1950s before
slowly contracting to approximately 4,000 km currently.
|
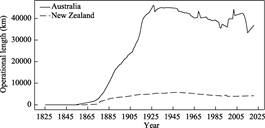
Figure
6 The trend of length of railways in
operation in typical Oceanian countries
|
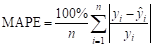
4.3 Data Validation
To
assess the accuracy of the imputed data, this dataset employed the hold-out
method for validation, and 20% of the known data were randomly sampled from the
original dataset and treated as pseudo-missing values. These values were then
imputed using the methods described above and compared with their original
values. The Mean Absolute Percentage Error (MAPE) was used as the evaluation
metric using the following equation:
 , (10)
where
n is the number of pseudo-missing points; is the true value of length of railways in operation (km);
and
is the true value of length of railways in operation (km);
and is the predicted value of the pseudo-missing points (km).
The results
showed that the mean absolute percentage error for the relevant data of each
country was within 10%, indicating a high level of accuracy of the imputation
methods (Figure 7).
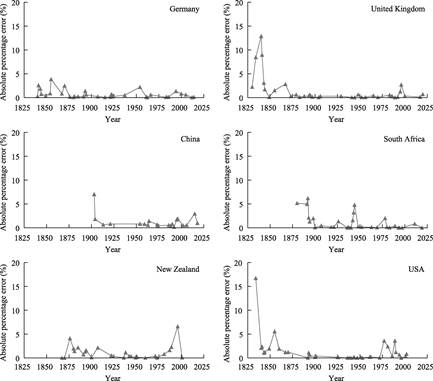
Figure
7 Data prediction
error for selected countries
5 Discussion and Conclusion
This study systematically constructed a long-term
dataset of the length of operational railways globally from 1825 to 2021.
Various imputation and validation methods were employed to address missing
historical data, thereby providing systematic and reliable data support for
research on global infrastructure development. Analysis based on these data
indicates that railways are not only a vital mode of transport but also a
crucial lens through which the modernization process of countries can be
observed, with their development trajectory profoundly mirroring the evolution
of the world??s economic and political landscape.
The historical
evolution of the global length of railways in operation exhibits 3 significant
characteristics. First, railway development shows distinct stages, with rapid
growth in the 19th century driven by the Industrial Revolution, a slowdown in
the mid-20th century due to wars and the impact of emerging transport modes,
and a resurgence in the 21st century with the rise of emerging economies.
Second, regional development disparities are significant, with core countries,
such as Europe and North America, dominating early, while peripheral countries,
such as those in Asia, caught up rapidly. Finally, global railway development
is deeply influenced by geopolitical and geoeconomic factors, with interaction
patterns in different historical periods shaping the trajectory of railway
evolution. For example, the international division of labor and colonial
expansion spurred railway construction in Latin America, Africa, and South
Asia.
Despite achieving
relatively comprehensive progress in systematically organizing and imputing
missing data for railway operating mileage, this study has several limitations.
On the one hand, constrained by differences in historical statistical systems,
data for some countries in the early years suffer from missing values or
inconsistent definitions. On the other hand, in disaggregating data for
countries undergoing border restructuring, static and dynamic weighting methods
rely primarily on linear assumptions, making it challenging to fully capture
nonlinear evolution in actual historical processes. Additionally, some
imputation methods demonstrate insufficient adaptability when faced with
limited samples in extreme years. Future research could further introduce
machine learning and multisource data fusion methods and deepen the linked
analysis between railway mileage growth and socio-economic variables. These
efforts would promote the construction of a cross-scale, interdisciplinary
research framework for infrastructure evolution.
Author Contributions
Li,
Y. L. contributed to the data collection and manuscript writing; Yu, Y. H. contributed
to the data processing and visualization; Cai, J. proposed the research idea.
All authors contributed to the development of the research idea, content review
and revision, as well as guidance on statistical analysis.
Conflicts of Interest
The authors declare no conflicts of interest.
References
[1]
Mitchell,
B. R. International Historical Statistics, 1750?C2010 [M]. London: Palgrave
Macmillan, 2013. DOI: 10.1057/9781137305688.
[2]
Li,
Y. L., Yu, Y. H., Cai, J. Global dataset on the length of railways in operation
(1825?C2021) [J/DB/OL]. Digital Journal of Global Change Data Repository,
2025. https://doi.org/10.3974/geodb.2025.08.07.V1.
[3]
GCdataPR
Editorial Office. GCdataPR data sharing policy [OL].
https://doi.org/10.3974/dp.policy.2014.05 (Updated 2017).
[4]
World
Bank. Rail lines (total route-km) [DB/OL].
https://data.worldbank.org/indicator/IS.RRS.TOTL.KM.
[5]
Cohen,
J. Private capital, public credit and the decline of American railways,
1840?C1940 [J/OL]. Journal of Transport History, 2010, 31(1): 42?C68. DOI:
10.7227/TJTH.31.1.4.
[6]
Satya,
L. D. British Imperial Railway in Nineteenth Century South Asia [M]//Nayak, G.
The Railways in Colonial South Asia. London: Routledge, 2021: 85?C113.
[7]
Li,
C. J. The great achievements and future prospects of China??s railway
development [J]. SASAC Report, 2019(6): 26?C29.
[8]
Scott,
M. A. Transcontinentalism: technology, geopolitics, and the Baghdad and
Cape-Cairo railway projects, c.1880?C1930 [D]. Newcastle: Newcastle University,
2018.