Spatial Distribution Datasets for Facility
Agriculture in the Tibetan Plateau and Two
Typical Regions
Wei, H. 1,2 Lv, C. H. 1,2* Yang, K. J. 3 Liu, Y. Q. 1,2
1. Key Laboratory of Land Surface Pattern and Simulation,
Institute of Geographic Sciences and Resources Research, CAS, Beijing 100101,
China;
2. University of Chinese Academy of Sciences, Beijing
10049, China;
3. Forestry College, Fujian Agriculture and Forestry University, Fuzhou 350002,
China
Abstract: During the past decade, facility agriculture has grown quickly in
the Tibetan Plateau and has become a new highlight of the region??s agricultural
development. Identifying the distribution pattern and spatiotemporal change
characteristics of facility agriculture in the Tibetan Plateau is helpful for
understanding trends in its development and providing support for rational
planning of its future development. Using high-resolution
image data obtained from Google Earth in 2018 as the data source, this study
first determined the area used for facility agriculture in the
Tibetan Plateau by visual interpretation and mapped its spatial distribution
with ArcGIS. Then, Xining and Lhasa were selected as two typical regions
and the changes in the areas dedicated to facility agriculture in the decade
between 2008 and 2018 were identified. The results showed that in 2018, the
total area dedicated to facility agriculture in the Tibetan Plateau was
9,426.95 hm2, which was mainly distributed in the major cities and
their surrounding areas in southern Tibet Autonomous Region and eastern Qinghai
Province. Of the total land area dedicated to facility agriculture, about
65.53% was distributed in Qinghai and 29.96% in Tibet, respectively. In the
past ten years, facility agriculture has developed rapidly in Xining and Lhasa,
with the area increasing from 537.32 hm2 and 616.12 hm2
in 2008 to 2,231.68 hm2 and 1,448.30 hm2 in 2018,
respectively. In both cities, facility agriculture land showed a spatial
variation trend spreading from the urban area to the periphery, resulting in a
great change in regional distribution.
Keywords: facility agriculture; the Tibetan Plateau; spatial distribution; high-resolution
imagery
1 Introduction
Facility agriculture
is an agricultural production model that uses artificial technologies to improve
light and temperature conditions in order to realize efficient agricultural
production[1?C4]. China is the country with the largest area under
facility cultivation in the world; the main types of facility agriculture are
plastic greenhouses, solar greenhouses, and terraced greenhouses[4?C5].
In the Tibetan Plateau, traditional alpine agriculture dominated by grassland
animal husbandry and crop production is the main source of income for farmers
and herdsmen and also determines the dietary structure, which is mainly
composed of tsampa, dairy products, beef, and mutton[5-9].
With socioeconomic development, the diet has gradually changed and has promoted
an increase in demand for vegetables and fruits. Therefore, traditional
agriculture based on planting highland barley and wheat has been unable to meet
dietary needs, particularly with respect to vegetables. As greenhouses can
overcome the limitations of low temperatures with respect to vegetable and
fruit production, facility agriculture has emerged and developed rapidly on the
Tibetan Plateau.
Detecting the spatial
distribution of and recent changes in facility agriculture can provide support
for the rational planning and adjustment of facility agriculture. Current
studies of facility agriculture mainly focus on the aspects of engineering
technologies[3,10?C11], benefits[12?C14], research methods[9,15],
and environmental impacts[16-19], while no studies have addressed
the issues of the spatial distribution of and temporal changes in facility
agriculture[5], due mainly to the lack of spatial distribution data
for facility agriculture. Therefore, we obtained and compiled spatial
distribution datasets for facility agriculture for the whole Tibetan Plateau in
2018 and two typical areas of Xining and Lhasa in 2008 and 2018, based on
high-resolution Google Earth satellite images with a resolution of 0.24?C0.48 m.
2 Metadata of the Dataset
The spatial distribution
data set of facility agriculture in the Tibetan Plateau and two typical regions[20]
are shown in Table 1.
Table 1 Metadata Summary of Spatial
Distribution Datasets of Facility Agriculture in the Tibetan Plateau and Two
Typical Regions
|
Items
|
Description
|
|
Dataset full name
|
The Spatial
Distribution Datasets of Facility Agriculture in the Tibetan Plateau
|
|
Dataset short name
|
(??????????)
|
|
Authors
|
Wei, H., X-4306-2019, Institute of Geographic
Sciences and Resources Research, CAS, irene1993weihui@163.com
Lv, C. H., Institute of Geographic Sciences and
Resources Research, CAS, luch@igsnrr.ac.cn
Yang, K. J., AAH-6922-2019, Forestry College, Fujian
Agriculture and Forestry University, kaijieyoung@163.com
Liu, Y. Q., F-6616-2017, Institute of Geographic
Sciences and Resources Research, CAS, yaqun_liu@163.com
|
|
Geographical region
|
The Tibetan Plateau
|
Year
|
2008, 2018
|
Temporal resolution
|
1 Year
|
|
Dataset format
|
.shp
|
Data size
|
2.42 MB
|
Spatial resolution
|
1 m
|
|
Data files
|
Spatial
distribution data for facility agriculture: data in the Tibetan Plateau in
2018; data in Xining in 2008;
data in Xining in 2018; data in Lhasa in 2008; data in Lhasa in 2018
|
|
Foundations
|
Chinese Academy of Sciences (XDA20040301)
|
|
Computing environment
|
ArcGIS
|
|
Data Publisher
|
Global Change Research Data Publishing &
Repository, http://www.geodoi.ac.cn
|
|
Address
|
No. 11A, Datun Road, Chaoyang District, Beijing
100101, China
|
|
Data sharing policy
|
Data from the Global Change Research Data Publishing
& Repository include metadata, datasets (data products), and publications
(in this case, in the Journal of Global Change Data & Discovery).
The data sharing policy includes the following provisions: (1) Data are
openly available and can be downloaded free of charge via the Internet; (2)
End users are encouraged to use the data, subject to citation; (3) Users, who
are by definition also value-added service providers, are welcome to
redistribute data subject to written permission from the GCdataPR Editorial
Office and the issuance of a data redistribution license, and; (4) If data
are used to compile new datasets, the ??ten percent principle?? should be
followed such that the data records utilized should not surpass 10% of the
new dataset contents, while sources should be clearly noted in suitable
places in the new dataset[21].
|
|
Communication and searchable
system
|
DOI, DCI, CSCD, WDS/ISC, GEOSS, China GEOSS
|
3 Data Source and Acquisition
Method
The data used in this study
are high-resolution Google Earth satellite images with resolutions ranging from
0.24m (level 19) to 0.48m (level 18). First of all, we identified the areas
dedicated to facility agriculture in the whole of the Tibetan Plateau in 2018
by visual interpretation. The Tibetan Plateau boundary is based on a vector
diagram[22]; the geographic coordinate system is GCS_WGS_1984, and
the projected coordinate is WGS_1984_ UTM_Zone_47N. The data extraction was
mainly based on November 2017 to November 2018 satellite images, from which
70.47% and 16.40% of the facility agriculture lands were acquired from the
satellite images in 2018 and those from November to December 2017,
respectively. The remaining 13.13% of facility agriculture land is scattered in
the sparsely populated regions of northwest Tibet, northwest Qinghai, and
Xinjiang. As no recent image data were available, the area was extracted from
images from October 2010 to October 2017. The interpretation data obtained
based on Google Earth were stored as a kml file and then transformed into an
shp file using the transformation tool ArcGIS10.5.
Considering the difficulty in obtaining earlier
high-resolution images of the whole Tibetan Plateau and as facility agriculture
is mostly distributed in and around major cities, this study chose Xining and
Lhasa as representative areas and identified the areas dedicated to facility agriculture
in these two cities by visual interpretation to detect temporal changes, based
on high-resolution images (0.24?C0.48 m) from November 2007?CDecember 2008 and
November 2017?CNovember 2018.
4 Results
4.1 Composition of the
Dataset
The spatial distribution dataset for facility
agriculture in the Tibetan Plateau and its typical areas contains five shp
files, as presented in Table 1, including Spatial distribution data
for facility agriculture in the three different places.
4.2 Data Results
4.2.1 Distribution of Facility Agriculture in the Tibetan Plateau
In 2018, the total area of
facility agriculture in the Tibetan Plateau was 9,426.95 hm2, which
was mainly distributed in the major cities and their surrounding areas in the
southern Tibet Autonomous Region and eastern Qinghai Province (Figure 1).
Qinghai had an area of 6,177.48 hm2 dedicated to facility agriculture,
accounting for 65.53% of the total area. Tibet had an area of 2,826.61 hm2
dedicated to facility agriculture, accounting for 29.96% of the total area.
Gansu and Sichuan had areas of 228.01 hm2 and 154.35 hm2
dedicated to facility agriculture, accounting for 2.42% and 1.64% of the total
area, respectively. Yunnan had the smallest area dedicated to facility
agriculture: only 42.49 hm2, accounting for 0.45% of the total area
dedicated to facility agriculture.
4.2.2 Spatiotemporal Variation of
Facility Agriculture in Lhasa and Xining
From 2008 to 2018, facility agriculture in Lhasa
developed rapidly, with the land dedicated to facility agriculture increasing
from 616.12 hm2 to 1,448.30 hm2 (Figure 2). In 2008, facility
agriculture in Lhasa was mainly concentrated in the urban area, covering an
area of 401.61 hm2, accounting for 65.18%, and the rest was
distributed in Qushui 27.72 hm2
|
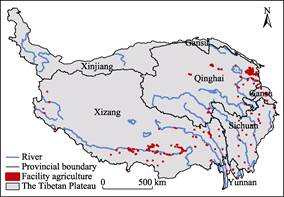
Figure 1 Spatial distribution of facility agriculture
land in the Tibetan Plateau in 2018[22]
|
(4.50%), Dazi 10.86 hm2
(1.76%), and Linzhou 3.99 hm2 (0.65%). After 2008, facility agriculture
in Lhasa spread outside the urban area. By 2018, the proportion of facility
agriculture in the urban area dropped to 29.82%, while it increased rapidly in
Qushui and Dazi counties, reaching 27.01% and 22.49%, respectively. The area
dedicated to facility agriculture in Linzhou County increased from 3.99 hm2
to 24.85 hm2, and in Mozhugongka and Nimu counties, the area was
20.99 hm2 and 0.20 hm2, respectively (Table 2).
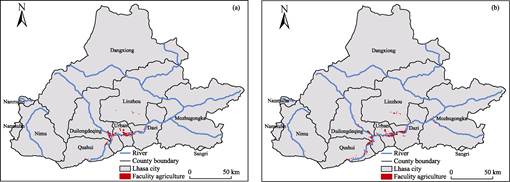
Figure 2 Spatial
distribution of facility agriculture land in Lhasa in 2008 (a) and 2018 (b)
Table 2 The area of
facility agriculture land in Lhasa in 2008 and 2018
|
County
|
2008
|
2018
|
|
Area (hm2)
|
Proportion (%)
|
Ranking
|
Area (hm2)
|
Proportion (%)
|
Ranking
|
|
Dazi
|
10.86
|
1.76
|
4
|
325.77
|
22.49
|
3
|
|
Duilongdeqing
|
171.95
|
27.91
|
2
|
253.42
|
17.50
|
4
|
|
Urban area
|
401.61
|
65.18
|
1
|
431.89
|
29.82
|
1
|
|
Linzhou
|
3.99
|
0.65
|
5
|
24.85
|
1.72
|
5
|
|
Qushui
|
27.72
|
4.50
|
3
|
391.19
|
27.01
|
2
|
|
Mozhugongka
|
0.00
|
0
|
6
|
20.99
|
1.45
|
6
|
|
Nimu
|
0.00
|
0
|
6
|
0.20
|
0.01
|
7
|
The area dedicated to facility agriculture in Xining
increased from 537.32 hm2 in 2008 to 2,231.68 hm2 in
2018. Similar to the trend in the development of facility agriculture in Lhasa,
facility agriculture also spread from the urban area to the periphery. The
proportion of facility agriculture in the urban area decreased from 48.83% in
2008 to 16.07% in 2018, and that in the area increased from 251.61 hm2
to 358.69 hm2. The area dedicated to facility agriculture in Datong
increased from 169.71 hm2 in 2008 to 630.39 hm2 in 2018,
while the proportion decreased from 31.58% to 28.25%. Huangzhong showed the
fastest development of facility agriculture, with the area dedicated to it
increasing by 1,083.75 hm2 (accounting for 63.96% of the newly
increased area in the whole city) compared with 2008; it reached 1,183.75 hm2
or 53.04% of the total area in Xining. Due to the relatively long distance from
the urban area, the proportion of facility agriculture in Huangyuan decreased
from 2.98% in 2008 to 2.64% in 2018 (Table 3).
Table 3 The area of facility agriculture land in
Xining in 2008 and 2018
|
County
|
2008
|
2018
|
|
Area (hm2)
|
Proportion (%)
|
Ranking
|
Area (hm2)
|
Proportion (%)
|
Ranking
|
|
Datong
|
169.71
|
31.58
|
2
|
630.39
|
28.25
|
2
|
|
Huangyuan
|
16.00
|
2.98
|
4
|
58.85
|
2.64
|
4
|
|
Huangzhong
|
100.00
|
18.61
|
3
|
1183.75
|
53.04
|
1
|
|
Urban area
|
251.61
|
48.83
|
1
|
358.69
|
16.07
|
3
|

Figure 3 Spatial distribution of facility
agriculture land in Xining in 2008 (a) and 2018 (b)
5 Discussion and Conclusion
The
meter-resolution dataset for facility agriculture built in this study reveals
the spatial distribution of facility agriculture in the Tibetan Plateau. It is
the first high-resolution spatial dataset of facility agriculture and can be
used to support the development of facility agriculture in the Tibetan Plateau.
To use the dataset, the year of the Google Earth image should be adjusted to
the year corresponding to the dataset so as to avoid inaccurate data correspondences.
The spatiotemporal changes in facility agriculture and
the causes were analyzed in detail in our paper[5] published in Resource
Science in 2019, so no further analyses are given. It
should be noted that in the process of data publishing, we have made further
interpretations, and thus the data are modified and improved. Therefore, this
dataset has some differences from the data published in the early paper[5];
we suggest using this dataset instead.
Author contributions
Lu, C. H. promoted this research, designed the structure
of the dataset, and revised the paper; We, H. interpreted the data for facility
agriculture in the Tibetan Plateau in 2018 as well as in Xining and Lhasa in
2008, processed and compiled the dataset, and wrote the paper; Yang, K. J.
interpreted the data for some facility agriculture in Tibet Autonomous Region
in 2018; Liu, Y. Q was involved in the data processing.
References
[1]
Zhang, N. M. Theory and
Practice of Facility Agriculture [M]. Beijing: Chemical Industry Press, 2006.
[2]
He, F., Ma, C. W. Analysis of
the development status and countermeasures of facility agriculture in China
[J]. Bulletin of Chinese Agronomy,
2007, 23(3): 462?C465.
[3]
Fao, F., Yu, L., Lu, S. Q., et
al. Status quo and development trend of facility agriculture in foreign
countries [J]. Journal of Zhejiang
Forestry College, 2009, 26(2): 279?C285.
[4]
Zhang, F. R., Zhang, X. J.,
Zhou, J. Spatial changes of greenhouse land and policy enlightenment in metropolitan
areas [J]. Resources Science, 2015,
37(4): 637?C644.
[5]
Wei, H., Lv, C. H., Liu, Y. Q.,
et al. Spatial distribution and temporal changes of facility agriculture
on the Tibetan Plateau [J]. Resources Science, 2019, 41(6):
1093?C1101.
[6]
Deng, A. Research on the
Ecological Economy of Grassland Pastoral Areas on the Qinghai?CTibet Plateau
[M]. Beijing: The Ethnic Publishing House, 2005.
[7]
Gao, Y. J., Deng, A. Tibetan
nomads?? sedentary living and the construction of new pastoral areas: with two
communities of Gannan Tibetan Prefecture as the case [J]. Ethno-National Studies, 2007, (5): 28?C37.
[8]
Yu, C. Q., Zhong, Z. M.
Discussion on development transformation strategies and path choices of agriculture
and animal husbandry in Tibet [J]. Bulletin
of Chinese Academy of Sciences, 2015, (3): 313?C321.
[9]
Wen, J. Functions, patterns,
and countermeasures combining farming with stockbreeding on the Qinghai?C Xizang Plateau [J]. Journal of National Resources, 2000,
15(1): 56?C60.
[10]
Qi, F., Zhou, X. Q., Ding, X.
M., et al. Study on the classification method of facility agricultural
engineering technology [J]. Chinese
Society of Agricultural Engineering, 2012, 28(10): 1?C7.
[11]
Dai, Q. W., Cao, J., Fan, Y., et
al. Systemic design of internet of things for application in modern
facility agriculture
[J]. Jiangsu Journal of Agricultural
Sciences, 2012, 28(5): 1173?C1180.
[12]
Li, Z. M., Shen, J., Wang, Z., et
al. Production efficiency analysis of solar greenhouse and plastic big-arch shelter in
Beijing [J]. China Vegetables, 2011,
(22?C24): 13?C19.
[13]
Zhang,
G. Y., Liu, G. Y., Cui, L. N., et al. A Study of facility agriculture
land use efficiency in northwestern China ?? a case study of the Turpan city in
Xinjiang [J]. Xinjiang Agricultural
Sciences, 2011, 48(6): 1157?C1161.
[14]
Zhang, Z. M., Zhou, L. J.,
Qian, W. R. Research on the relationship between facility agriculture operation
scale and agricultural
productivity??based on the investigation and analysis in Zhejiang province [J]. Issues in Agricultural Economy, 2011,
(12): 23?C29.
[15]
Zou, L. D., Guo, H., Zhu, X.
F., et al. Automatically extracting the spatial distribution information
of facility agriculture [J]. Remote
Sensing Technology and Application, 2014, 29(4): 669?C674.
[16]
Wang, J., Luo, Y. M., Ma, W.
T., et al. Pollution characteristics and health risk assessment of
phthalate esters in typical intensive agricultural soils [J]. China Environmental Science, 2013,
33(12): 2235?C2242.
[17]
Gu, J. Y., Gu, W., Zhang, H., et
al. Biological measures for soil improvement of facility agriculture in China [J]. Journal
of Beijing Normal University (Natural
Science), 2016, 52(1): 70?C75.
[18]
Chen, D. Y., Yang, Z. C., Kong,
Z., et al. Current situation and prospect of carbon sequestration
facility agriculture
[J]. Journal of Agricultural Science and
Technology, 2018, 20(2): 122?C128.
[19]
Shi, J., Zhang, N. M., Bao, L.
Research progress on soil degradation and regulation of facility agriculture in China [J]. Chinese Journal of Eco-Agriculture,
2013, 21(7): 787?C794.
[20]
Wei, H., Lu, C. H., Yang, K.
J., et al. Spatial distribution dataset of facility agriculture in the
Tibetan Plateau and its typical area [DB/OL]. Global Change Research Data
Publishing & Repository, 2019. DOI: 10.3974/geodb.2019.05. 10.V1.
[21]
GCdataPR Editorial Office.
GCdataPR data sharing policy [OL]. DOI: 10.3974/dp.policy.2014.05 (Updated
2017).
[22]
Zhang, Y. L., Li, B. Y., Zheng,
D. On the scope and area of Qinghai?CTibet Plateau[J]. Geographical Research, 2002, 21(1): 1?C8.