NDVI Change Trend and Impact Factors Dataset in
Inner Mongolia (2000?C2015)
Chen, K. Chao, L.
M.*
College of Ecology and Environment, Inner Mongolia
University, Hohhot 010021, China
Abstract: Based on monthly 1 km SPOT/VEGETATION NDVI
data from 2000 to 2015, a dataset of annual NDVI data was generated using the
maximum value synthesis method. Then statistical yearbook data, trend analyses,
and a geographical detector model were used to calculate the trend of change in
the NDVI and to assess the impact factors for Inner Mongolia. The dataset is
categorized into GIS 1 km raster data; information on the degree of change in
the NDVI; data on natural phenomena such as precipitation, average temperature,
slope aspect, and so on; and human-related components such as changes in rural
populations, labor force, grain output, and per capita net income of farmers
and herdsmen, among others. Some data are also provided in table format,
including the area and proportion of change in vegetation and the main impact
factors.
Keywords: geographical
detector; vegetation NDVI; Inner Mongolia; human factors; natural factors
Dataset Available Statement:
The dataset supporting this paper
was published at: Chen, K., Chao, L.
M. Dataset of NDVI change trends and impact factors in Inner Mongolia
(2000?C2015) [J/DB/OL]. Digital Journal of
Global Change Data Repository, 2020. DOI: 10.3974/geodb.2020.05.07.V1.
1 Introduction
Vegetation is a vital part of terrestrial ecosystems that
serves as a hub of material circulation, energy flow, and information
transmission[1?C2]. Changes in vegetation coverage can indicate
fluctuations or changes in whole ecosystems to a certain degree[3].
Particularly in arid and semi-arid areas, changes in vegetation coverage are an
important indicator for monitoring and evaluating changes in ecology[4].
Therefore, it is of great significance to quantitatively analyze changes in
regional vegetation coverage and explore the driving factors.
Inner
Mongolia is a vast territory with a high diversity of ecosystems, although the
main landform is the Mongolian Plateau[5]. Due to this plateau,
Inner Mongolia is an important ecological barrier in northern China. The region
has an arid and semi-arid climate, and has been reported to be particularly
sensitive to global climate change[4].
Regarding
human industry, the counties in the Inner Mongolia autonomous region are mainly
divided into pastoral, agricultural, semi pastoral, semi agricultural and urban
areas. Pasture area is dominated by grazing, where natural grassland is the
main vegetation type. Non-animal husbandry is the main vegetation type in other
counties, and farmland is the main land use type[6].
The dataset is developed based on the SPOT/VEGETATION
NDVI database. Then we calculated the trend of change in the NDVI for 2000 to
2015 and assessed the natural and human factors using statistical data, trend
analyses, and a geographical detector model[7]. The dataset provides
a useful reference on the vegetation in this region, how it has changed, and
the main driving factors, and may serve as a guide for urban and rural
developmental decisions.
2 Metadata of the
Dataset
The metadata summary of the ??Dataset of NDVI change
trends and impact factors in Inner Mongolia (2000?C2015)?? is shown in Table 1.
Table 1 Metadata
summary of the dataset
|
Items
|
Description
|
|
Dataset full name
|
Dataset of NDVI change trends and
impact factors in Inner Mongolia (2000?C2015)
|
|
Dataset short name
|
NDVIChange.InnerMongolia_2000-2015
|
|
Authors
|
Chen, K., College of
Ecology and Environment, Inner Mongolia University, im_chk@163.com
Chao, L. M., College of Ecology
and Environment, Inner Mongolia University, colmvn@aliyun.com
|
|
Geographical region
|
Inner Mongolia
Year 2000?C2015
|
|
Data format
|
.tif, .xlsx, .shp Data
size 51.7 MB (after compression)
|
|
Data files
|
Spatial data include (1) annual
variation trend of NDVI in Inner Mongolia from 2000 to 2015, 1 km raster
data; (2) Categorize 1 km raster data based on the degree of
change annual variation trend of NDVI from 2000 to 2015; (3) Natural factor data, including 2000?C2015 precipitation,
average temperature change trend, slope aspect, slope classification and
vegetation type 1 km grid data; (4) Human-factor GIS data based on
county units, including six attribute data from 2000 to 2015, including the
trend of change in rural population, the trend of change in rural household
number, the trend of change in rural labor force, the trend of change in
grain output, the trend of change in per capita net income of farmers and
herdsmen, and the trend of change in livestock quantity. Tabular data include the (1) area
and proportion of vegetation change grade divided based on vegetation NDVI
change. (2) Main impact factors and q values of vegetation NDVI change in
Pastoral banner county and non-pastoral banner county in Inner Mongolia.
|
|
Foundations
|
Ministry
of Science and Technology of P. R. China (2016YFC050604?C4); National
Natural Science Foundation of China (31060117)
|
|
Data publisher
|
Global Change Research Data
Publishing & Repository, http://www.geodoi.ac.cn
|
|
Address
|
No. 11A, Datun Road, Chaoyang
District, Beijing 100101, China
|
|
Data sharing policy
|
Data from
the Global Change Research Data Publishing & Repository includes metadata, datasets (in the Digital Journal of Global Change Data Repository), and publications
(in the Journal of Global Change Data & Discovery). Data sharing policy includes: (1) Data
are openly available and can be free downloaded via the Internet; (2) End
users are encouraged to use Data subject to citation; (3)
Users, who are by definition also value-added service providers, are welcome
to redistribute Data subject to written permission from the GCdataPR Editorial
Office and the issuance of a Data redistribution license; and (4)
If Data
are used to compile new datasets, the ??ten per cent principal?? should be
followed such that Data records utilized should not
surpass 10% of the new dataset contents, while sources should be clearly
noted in suitable places in the new dataset[9]
|
|
Communication
and searchable system
|
DOI, DCI, CSCD, WDS/ISC, GEOSS,
China GEOSS, Crossref
|
3 Data Development
This study used time series SPOT/VEGETATION NDVI data
from 2000?C2015[10] with the maximum synthesis method to generate an
annual NDVI. The natural factors considered were climate, elevation, and vegetation.
The climate data included annual precipitation and annual average temperature
with 1 km resolution calculated by interpolation. Elevation with 1 km
resolution was generated by resampling based on the latest SRTM V4.1 data. Vegetation
types were derived from 1:1 million vegetation maps of China with a resolution
of 1 km. Slope and aspect were calculated from DEM data with a resolution of 1
km[11]. Data on human factors were taken from the ??Inner
Mongolia Statistical Yearbook??[12]. The components included data on
rural population, rural labor force, number of rural households, grain production,
per capita income of farmers and herdsmen, and number of livestock (in ??sheep
units??, where a camel, horse, and cow are equivalent to five sheep each, and a
goat is the same as one sheep).
3.1 Algorithm
The trend line analysis method was used to analyze the
trend of change in the NDVI as well as climate and human factors for the study
period[6]. In other words, taking time as an independent variable,
the NDVI, annual average temperature, annual precipitation, and six individuals
were analyzed by univariate linear regression. The correlation coefficient (R) between NDVI sequence and time (Year)
was used to judge the degree and nature of change in vegetation cover, and the
magnitude of the coefficient was used to judge the significance[6].
The critical value of significance was obtained from the critical value table
of correlation coefficient test (when the number of samples was 16, the critical
value of significance level was 0.468 and 0.590 at 0.01 and 0.05). Vegetation
change was divided into five categories, according to the trend slope and
critical value of NDVI: extremely significant degradation, significant
degradation, no significant change, significant improvement, and extremely significant
improvement.
The
influences of natural and human factors on the NDVI were analyzed using the geographical
detector model[7].
4 Data Results and Verification
4.1 Data Composition
The dataset includes 11 spatial data files (Table 2) and
one statistical table data (including the area and proportion data of NDVI of
different grades in Inner Mongolia; the main impact factors and q value of NDVI changes in pastoral and
non pastoral counties of Inner Mongolia). Table 2 explains the data and describes the file or field names corresponding
to the data.
4.2 Data Results
Because the geographical detector model employs an
algorithm for discrete data, continuous variables (all data except vegetation
type and slope aspect) were discretized using the natural breakpoint method[13].
The slope was divided into 9 categories and the other factors were divided into
10 categories (Figure 1).
Table 2 Natural and human
factors affecting variation in NDVI
in Inner Mongolia (2000?C2015)
|
Category
|
Factors
|
Details
|
File or field
|
|
Natural factors
|
Annual precipitation
|
Variation in precipitation from 2000
to 2015
|
IM_pre00_15slope.tif
|
|
Annual mean temperature
|
Average change in temperature from
2000 to 2015
|
IM_tem00_15slope.tif
|
|
Slope
|
Calculated from DEM data with a
resolution of 1 km
|
IM_slope.tif
|
|
Aspect
|
Calculated from DEM data with a
resolution of 1 km
|
IM_aspect.tif
|
|
Vegetation type
|
In 1995, a 1:1 million vegetation
map of China was digitally generated with a resolution of 1 km
|
IM_vegatation_
type.tif
|
|
Human
factors
|
Change in rural population
|
Rate of change in the rural
population from 2000 to 2015
|
Rp_slope
|
|
Change in number of rural households
|
Rate of change in number of rural
households from 2000 to 2015
|
house_slope
|
|
Change in rural labor force
|
Rate of change in rural labor force
from 2000 to 2015
|
labor_slope
|
|
Change in grain yield
|
Rate of change in grain output from
2000 to 2015
|
grain_slope
|
|
Change in per capita net income of
farmers and herdsmen
|
Rate of change in per capita net
income of farmers and herdsmen from 2000 to 2015
|
Rgdp_slope
|
|
Change in number of livestock
|
Rate of change in livestock number
from 2000 to 2015
|
sheep_slope
|
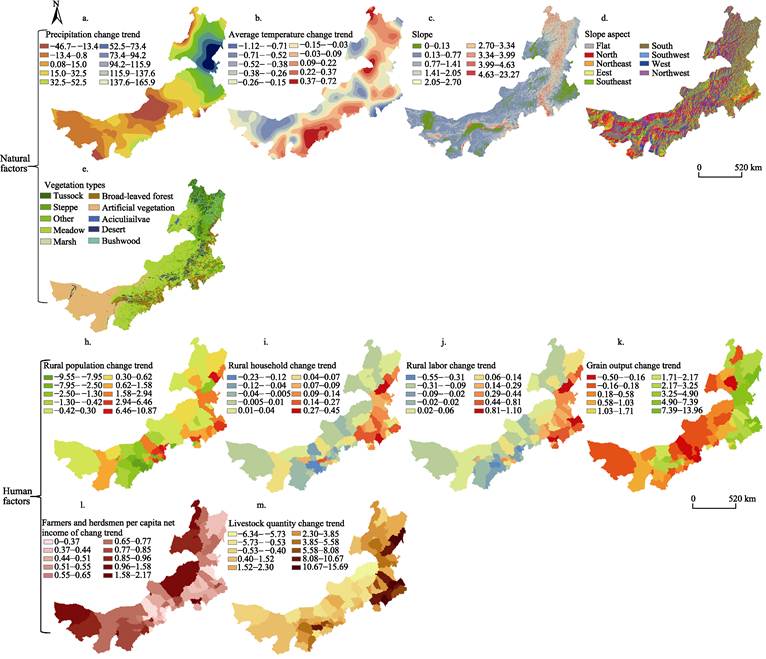
Figure 1 Map of natural and
human factors affecting
the NDVI for Inner Mongolia during
2000?C2015
During the 16 years from 2000 to 2015, the NDVI showed an
overall increasing trend. In general, it tended to decrease in the west and
increase in the east and south; in other areas, it changed very little (Figure
2). Overall, an area of about 249,842.65 km2 showed improved
vegetation coverage, accounting for 21.88% of the total area of Inner Mongolia;
about 64.38%, 10.88%, 1.88%, and 1.00% of the area experienced no change, a significant
improvement, significant degradation, and extremely significant degradation,
respectively (Table 3). These results indicate that the area of vegetation
improvement was significantly greater than that of vegetation degradation.
Furthermore, degraded areas were mainly distributed
in the northwestern region around individual towns. NDVI varying grade is shown
in Table 3. The vegetation of animal husbandry banner (county) was improved
very significant, accounting for 9.65% of the total area (significant
improvement: 7.24%; no change: 79.34%; significant degradation: 2.56%; very
significant degradation 1.20%). The proportion of vegetation degradation area
in animal husbandry banner (county) exceeds that of the whole study area, which
indicates that vegetation degradation is more serious (and vegetation improvement
is lower) in pastoral counties than in other areas. The vegetation of
non-pastoral counties was improved very significant, accounting for 47.54% of
the total area (significant improvement: 18.52%, no change: 33.00%;
significant degradation: 0.35%; very significant degradation: 0.57%). Improved areas were mainly distributed in
non-pastoral counties.
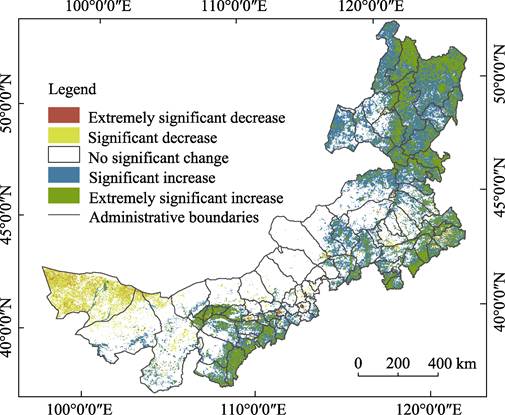
Figure 2 Spatial
distribution of vegetation change in Inner Mongolia from 2000 to 2015 based on
the interannual variation trend of NDVI and its significance
The
factor detection of geographic detector model was used to assess the influences
of natural and human factors on the NDVI, expressed using q values. The core rationale of the factor detection
module is that geographic phenomenon always exists in a certain
place in space and is affected by environmental factors. If certain
environmental factors change with geographic phenomenon in a remarkably consistent spatial pattern, then it indicates these environment
factors have great effect on the occurrence and development of geographic phenomenon[7]. Across the whole study area, the order of the degree of
influence on NDVI was as follows: annual precipitation > soil type >
vegetation type > grain yield > number of livestock > per capita net
income of farmers and herdsmen > number of rural households > rural
population > landform type > rural labor force > annual average
temperature > slope > slope aspect. The first three factors are natural
factors and the following two are human factors, which suggests that the influence
of natural factors is greater than that of human factors. Similarly, for
non-pastoral counties, the order was annual precipitation > soil type >
vegetation type > grain yield > per capita net income of farmers and
herdsmen > number of livestock > number of rural households > landform
type > rural population > rural labor force > annual average
temperature > slope > slope (Figure 3), again showing that natural factors had a greater impact. In contrast, the
order for non-pastoral counties was grain output > rural labor force > annual
average temperature > soil type > annual precipitation > number of
rural households > per capita net income of farmers and herdsmen > number
of livestock > total rural population > landform type > slope >
vegetation type > slope aspect (Figure 3). These results indicate that human
factors were dominant in such areas.
Table 3 Area
and proportion of NDVI varying grades
|
Region
|
Classification
|
Very
significant degradation
|
Significant degradation
|
No change
|
Significant improvement
|
Very significant improvement
|
Total
|
|
All counties
|
Area (km2)
|
11,458.14
|
21,105.13
|
734,992.38
|
124,233.05
|
249,842.65
|
1,141,631.35
|
|
Percentage (%)
|
1.00%
|
1.84%
|
64.38%
|
10.88%
|
21.88%
|
100%
|
|
Pastoral counties
|
Area (km2)
|
9,335.95
|
19,785.55
|
613,648.39
|
56,000.29
|
74,631.31
|
773,401.50
|
|
Percentage (%)
|
1.20%
|
2.56%
|
79.34%
|
7.24%
|
9.65%
|
100%
|
|
Non-pastoral counties
|
Area (km2)
|
2,118.41
|
1,312.53
|
121,529.47
|
68,199.76
|
175,069.49
|
368,032.66
|
|
Percentage (%)
|
0.57%
|
0.35%
|
33.00%
|
18.52%
|
47.54%
|
100%
|
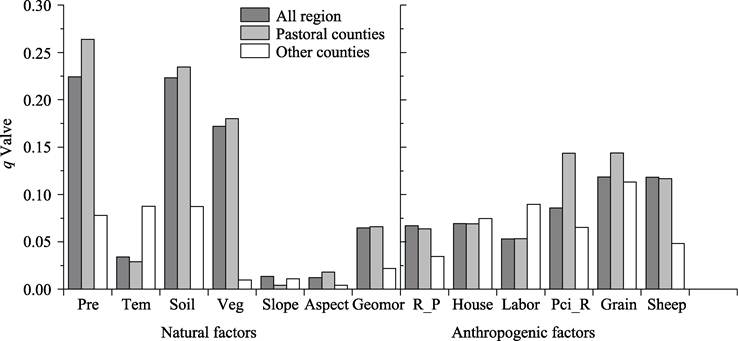
Figure 3 q values of seven natural factors and six
human factors leading to variation in
the NDVI in Inner Mongolia??Note??In natural factors, Pre, Tem, Soil, Veg, Slope, Aspect and Geomor
respectively refer to annual precipitation, annual average temperature, soil
type, vegetation type, slope, aspect and geomorphic type; In
anthropogenic factors, R_P, House, Labor, Pci_R, Grain and Sheep respectively
refer to rural population, rural household number, rural labor, per capita net
income of farmers and herdsmen, grain output and livestock number??
4.3
Data Validation
The precision of VEGETATION coverage
represented by NDVI lies in the spatial resolution of the source data used. In
this paper, the SPOT/VEGETATION NDVI data with a resolution of 1 km is
consistent with the research results of the former[14].
Geographic detector method is useful for detecting
spatial differentiation and revealing the driving forces behind it. It is
widely used in analyzing the evolution of geographical element pattern and
regional spatial differentiation[7]. However, it should be pointed
out that, as the maximum number of rows of data in the research area exceeds
the upper limit of the operation of the geographic detector model, the use of
the Create Random Points function of ArcGIS software to randomly extract
appropriate samples in proportion for factor detection may have a certain
impact on the final research results.
5 Discussion
It is of great significance to understand not only
changes in regional vegetation coverage but also their driving factors over
time. We used linear trend analyses and a geographical detector method to
explore the impact of natural and human factors on changes in the NDVI from
2000 to 2015. Our results reveal obvious changes with an overall increasing
trend in vegetation coverage. Regionally, vegetation tended to decrease in the
west and increase in the east and south, with other areas showing little
change. Across the entire region, about 32.76% of the area showed improvement,
whereas only 2.88% showed degradation. The NDVI was affected more by natural factors
than by human factors, with precipitation and soil type having the main
effects. However, in non-pastoral counties, human factors had a greater impact,
with grain yield being the main effect. Our dataset provides a useful reference
on the vegetation in this region, how it has changed, and the main driving
factors, and should help guide urban and rural developmental decisions.
Author Contributions
Chao, L. M. designed the dataset and Chen, K. collected
and processed the data, and wrote the paper.
References
[1]
Gong, Z.,
Zhao, S., Gu, J. Correlation analysis between vegetation coverage and climate
drought conditions in North China during 2001?C2013 [J]. Journal of Geographical Sciences, 2017, 27(2): 143‒160.
[2]
Peng, W., Kuang, T., Tao, S. Quantifying influences of natural factors
on vegetation NDVI changes based on geographical
detector in Sichuan, western China [J]. Journal
of Cleaner Production, 2019, 233: 353‒367.
[3]
Parmesan, C.,
Yohe, G. A globally coherent fingerprint of climate change impacts across natural
systems [J]. Nature, 2003, 421(6918):
37‒42.
[4]
Mu, S. J.,
Li, J. L., Chen, Y. Z., et al.
Spatial differences of variations of vegetation coverage in Inner Mongolia during
2001?C2010 [J]. Acta Geographica Sinica,
2012, 67(9): 1255‒1268.
[5]
Bao, G.,
Bao, Y. H., Qin, Z. H., et al.
Vegetation cover changes in Mongolian Plateau and its response to seasonal
climate changes in recent 10 years [J]. Scientia
Geographica Sinica, 2013, 33(5): 613‒621.
[6] Li, S., Sun, Z., Tan, M., et
al. Effects of rural-urban migration on vegetation greenness in fragile
areas: a case study of Inner Mongolia in China [J]. Journal of Geographical Sciences, 2016, 26(3): 313‒324.
[7]
Wang,
J. F., Xu, C. D. Geodetector: principle and prospective [J]. Acta Geographica Sinica, 2017, 72(1):
116‒134.
[8]
Chen, K., Chao, L. M.
Dataset of NDVI change trends and impact factors in Inner Mongolia (2000?C2015) [J/DB/OL]. Digital Journal of Global
Change Data Repository, 2020. DOI:
10.3974/geodb.2020.
05.07.V1.
[9]
GCdataPR
Editorial Office. GCdataPR data sharing policy [OL]. DOI:
10.3974/dp.policy.2014.05 (Updated 2017).
[10] Xu, X. L. China annual vegetation index (NDVI) spatial
distribution dataset [DB]. Data Registration and publishing System of Resources
and Environmental Sciences Data Center, Chinese Academy of Sciences, 2018. DOI:
10.12078/2018060601.
[11] Resource and Environmental Science and Data Center, Chinese
Academy of Sciences. http: //www.resdc.cn.
[12] Inner Mongolia Bureau of Statistics. Inner Mongolia Statistical Yearbook [M].
Hohhot: China Statistical Press, 2000-2015.
[13] Liu, Y. S., Li, J. T. Geographical detection and optimization
decision making of differentiation mechanisms of rural poverty in China [J]. Acta Geographica Sinica, 2017, 72(1): 161‒173.
[14]
Qin, F. Y. Vegetation patterns and dynamics in response to climate change
across the Mongolian Plateau [D]. Hohhot: Inner Mongolia University,
2019.