Dataset of Spatial Pattern in the Forest Water Retention in
China Based on Meta-analysis
Wu, X.1,2 Shi, W. J.1,3* Tao, F. L.1,3*
1. Key Laboratory of Land Surface Pattern and Simulation,
State Key Laboratory of Resources and Environmental Information System,
Institute of Geographic Sciences and Natural Resources Research, Chinese
Academy of Sciences, Beijing 100101, China;
2. Jiangsu Province Surveying & Mapping Engineering
Institute, Nanjing 210013, China;
3. College of Resources and
Environment, University of Chinese Academy of Sciences, Beijing 100049, China
Abstract: Water retention of
forest ecosystem plays important roles in interception, storage and
redistribution of precipitation. The spatial pattern dataset of forest water
retention is based on the 1,045 observation sites with the parameters and its
influencing factors across China. We used empirical model to estimate canopy
interception capacity, litter maximum water-holding capacity, and soil water
storage capacity. Then, we applied the random forest model to predict the
spatial pattern of forest water retention. The results show that the random
forest model based on observation sites has credible results in predicting the
spatial pattern of forest water retention of China. Our results revealed that
the forest water retention capacity in China increased from north to south. The
total forest water retention amount in Sichuan, Tibet and Yunnan are relatively
high. The dataset includes forest water retention capacity divided by forest
types based on a 10 km x 10 km grid, and data of 1,045 observation sites of
forest water retention. The dataset is archived in .xlsx and .shp data formats,
and consists of 9 data files with data size of 118 MB.
Keywords: China; forest water retention; national scale; spatial
pattern
DOI: https://doi.org/10.3974/geodp.2023.01.02
CSTR:
https://cstr.escience.org.cn/CSTR:20146.14.2023.01.02
Dataset Availability Statement:
The dataset
supporting this paper was published and is accessible through the Digital Journal of Global Change Data Repository at: https://doi.org/10.3974/geodb.2022.03.06.V1
or https://cstr.escience.org.cn/CSTR:20146.11.2022.03.06.V1.
1 Introduction
Under
a series of conditions of global climate change, request of restoring the
ecological environment and terrestrial water storage depletion, a series of
ecological problems such as water pollution, land desertification, and soil
erosion in China are needed to be urgently solved[1,2]. These
problems are closely related to water retention volumes. Forest ecosystems play
a decisive role in global ecosystems and are one of the most important
terrestrial ecosystems[3,4]. The forest water retention service is
an important process of regulating climate and water resources. It promotes
rainfall redistribution, moderates surface runoff, and increases soil runoff
and underground runoff through the interception, retention and accumulation of
rainfall[5]. China has a vast territory and diverse climatic
characteristics. The capacity and volumes of forest water retention in have
large variety in different regions. It is urgent to explore patterns of forest
water retention in different regions across China.
The methods for
water retention estimation are mainly based on water-balance theory or
empirical models. The water-balance model has been widely applied to simulate
the forest water retention capacity at a large scale, but there is a lack of
observation sites to validate model results in various regions[6].
Empirical models are usually applied at small spatial scales for estimating
water retention. Due to the difficulty in obtaining observational data,
empirical models are difficult to practically measure at a national scale.
Methods of forest water retention spatial pattern based on observation sites in
previous studies include assignment method, regression method, machine learning
and geostatistical method, among which machine learning and geostatistical
method are more suitable for large scale research[6].
The empirical
model is used to estimate canopy interception capacity (CIC), litter maximum
water-holding capacity (LWHC), soil water storage capacity (SSC) and forest
water retention capacity (WRC) of 1045 observation sites. Then, the random
forest model is used to predict the spatial distribution characteristics and
further analyze the spatial pattern of forest water retention.
2 Metadata of the Dataset
The
metadata of the Dataset of spatial pattern in the forest water retention in
China based on meta-analysis[9] is summarized in
Table 1. It includes the dataset full name, short name, authors, year of the
dataset, temporal resolution, spatial resolution, data format, data size, data
files, data publisher, and data sharing policy, etc.
3 Methods
Based
on the 1,045 water retention observation sites across China (Figure 1), the
maximum capacity of precipitation intercepted and stored by the forest can be
simulated by the empirical model of WRC as the sum of CIC, LWHC and SSC. The 1,045
observation sites selected in this paper are based on meta-analysis to collect
articles reporting on the parameters related to water retention, including
canopy interception rate, litter storage, litter maximum water-holding rate,
soil depth and soil non-capillary porosity or three components related to
forest water retention function, including CIC, LWHC and SSC.
Then, the CIC, LWHC, and SSC values of 1,045 observation sites are
calculated by the empirical model, which are used as the training samples and
verification dataset of the random forest model to construct spatial pattern
models of the CIC, LWHC and SSC.
Table 1 Metadata summary of the Dataset of
spatial pattern in the forest water retention in China based on meta-analysis
|
Items
|
Description
|
|
Dataset full name
|
Dataset of spatial pattern
in the forest water retention in China based on meta-analysis
|
|
Dataset short name
|
ForestWaterRetentionChina
|
|
Authors
|
Wu, X., Jiangsu Province
Surveying & Mapping Engineering Institute, wux@lreis.ac.cn
Shi, W. J. S-3255-2018, Institute
of Geographic Sciences and Natural Resources Research, Chinese Academy of Sciences,
shiwj@lreis.ac.cn
|
|
|
Tao, F. L., Institute of
Geographic Sciences and Natural Resources Research, Chinese Academy of
Sciences, taofl@igsnrr.ac.cn
|
|
Geographical region
|
China (excluding Shanghai, Hainan, Macao and Taiwan )
|
|
Year
|
1987-2017
|
|
Temporal resolution
|
Year
|
|
Spatial resolution
|
10 km
|
|
Data format
|
.shp, .xlsx
|
|
|
|
Data size
|
118 MB
|
|
|
|
Data files
|
.shp (including 12 fields), .xlsx
(including 2 tables)
|
|
Foundations
|
Ministry of Science and
Technology of P. R. China (2017YFA0604703); Chinese Academy of Sciences
(XDA20010202, XDA23100202, 2018071); National Natural Science Foundation of
China (41930647)
|
|
Data publisher
|
Global
Change Research Data Publishing & Repository, http://www.geodoi.ac.cn
|
|
Address
|
No. 11A, Datun Road,
Chaoyang District, Beijing 100101, China
|
|
Data sharing policy
|
Data
from the Global Change Research Data Publishing & Repository includes metadata,
datasets (in the Digital Journal of Global Change Data Repository),
and publications (in the Journal of Global Change Data & Discovery).
Data
sharing policy includes: (1) Data are openly
available and can be free downloaded via the Internet; (2) End users are
encouraged to use Data subject to citation; (3) Users, who are by definition
also value-added service providers, are welcome to redistribute Data
subject to written permission from the GCdataPR Editorial Office and the
issuance of a Data redistribution license; and (4) If Data are used to
compile new datasets, the ??ten per cent principal?? should be followed such
that Data records utilized should not surpass 10% of the new
dataset contents, while sources should be clearly noted in suitable places in
the new dataset[7]
|
|
Communication
and searchable system
|
DOI, CSTR, Crossref, DCI, CSCD, CNKI,
SciEngine, WDS/ISC, GEOSS
|
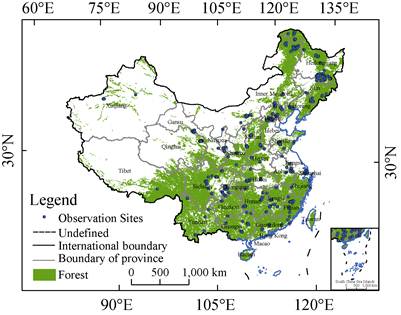
Figure 1 Map of forest and observation sites distribution
in China
Finally, the
empirical model is used to calculate the spatial WRC, canopy interception
amount (CIA), litter maximum water-holding amount (LWHA), soil water storage
amount (SSA) and forest water retention amount (WRA).
3.1 Data Processing
3.1.1 Random
Forest Model
China
covers an area of approximately 9.6 million km2, so it is difficult
to extract observation sites for measuring water retention, which are uneven
distributed. The relationships between parameters and driving factors of forest
water retention are complex and mostly nonlinear. A random forest model is a
nonparametric decision tree classifier that can be used to process complex and
nonlinear variables[11, 12], and it is powerful for spatial prediction
over complex terrain, which is suitable for spatial prediction of WRC and WRA
at a large scale[13]. In this study, the spatial prediction of water
retention is based on the "Random Forest" module in the R software.
The water retention value of 1,045 observation sites are the input data, and
the significant factors affecting the forest water retention are used as
auxiliary information to predict the CIC, LWHC and SSC[13].
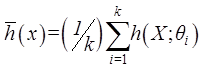
In random forest
prediction, the predicted value is the average of the output results of all
regression trees, and the expression is:
 (1)
(1)
where is predictor;
  are independent
identically distributed random vectors; X is an input vector;
are independent
identically distributed random vectors; X is an input vector;  is the output
result of the ith regression tree; k is the number of regression tree.
is the output
result of the ith regression tree; k is the number of regression tree.
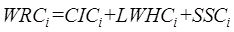
3.1.2 Empirical model
An empirical model of the
forest water retention capacity, representing the sum of CIC, LWHC and SSC and
considering the canopy, litter and soil layers based on observation data, is a
relatively comprehensive method for estimating WRC and WRA[6]. Then, the WRC and WRA are calculated according to Equations
(2) ?C (6), respectively:
 (2)
(2)
 (3)
(3)
 (4)
(4)
 (5)
(5)
 (6)
(6)
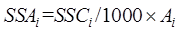
where
WRCi, CICi, LWHCi
and SSCi are the WRC, CIC,
LWHC, and SSC in the ith forest sublot
(mm), respectively; WRAi, CIAi , LWHAi, and SSAi are the WRA, CIA,
LWHA, and SSA (m3) in the ith
forest sublot (m3), respectively; Ai is the area of the ith forest
sublot (m2).
3.2 Technical Route
Based
on forest water retention observation sites, the random forest model is used to
predict the spatial pattern of forest water retention in China. The steps are
as follows (Figure 2).
Firstly, the China
National Knowledge Infrastructure (CNKI) and Web of Science Core Collection
Databases were used to search the observation data in the forest water
retention articles based on a meta-analysis method. A total of 1045 observation
sites were collected for obtaining water retention parameters, basic forest
information and site conditions.
Then, the
empirical model was used to calculate the CIC, LWHC and SSC of observation sites[14].
Taking the observation data calculated by the empirical model as the input data
and the significant influencing factors as the auxiliary data, the spatial
pattern models of the CIC, LWHC and SSC were constructed based on the random
forest model.
Finally, according
to the CIC, LWHC and SSC predicted by the random forest model, the empirical
model was used to calculate the spatial WRC, CIA, LWHA, SSA and WRA. Due to the
significant spatial heterogeneity of forest water retention in China, spatial
pattern characteristics of CIC, LWHC, SSC, WRC, CIA, LWHA, SSA and WRA were
analyzed. However, because Shanghai, Hainan, Macao and Taiwan did not collect
water retention observation sites, the spatial pattern characteristics of their
forest water retention were not analyzed.
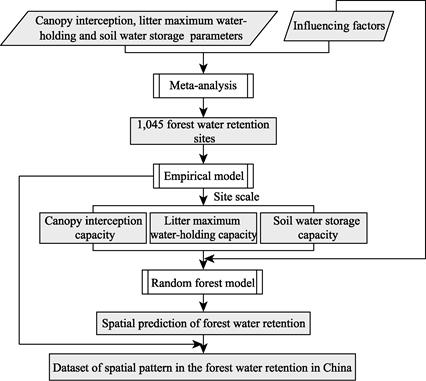
Figure 2 The framework of forest water retention
spatial dataset in China based on the meta-analysis
4 Data Results and Validation
4.1 Data Composition
The
Dataset of spatial pattern in the forest water retention in China based on meta-analysis
is composed of forest water retention data and statistical tables. The
statistical tables include the statistical table of forest water retention in
various provinces based on the random forest model prediction, and the data of
1,045 observation sites of forest water retention. The relevant fields of
forest water retention vector data are shown in Table 2.
4.2 Data Products
4.2.1 Spatial
Patterns of the CIC and CIA
The
CIC values were in the range of 0?C37 mm, which were lower in northern China than
in southern China (Figure 3). The CIC values less than 14 mm were mainly
distributed in Heilongjiang, northern Inner Mongolia and Shanxi, and the CIC
values larger than 26 mm were mostly distributed in Guangdong, Guangxi, Yunnan.
The average CIC value varied widely among provinces, ranging from 13.35 to
26.67 mm (Figure 4).
Due to the large
differences in the distribution area and forest types in various provinces, the
CIA varied greatly, ranging from 73.36?C488,871??104 m3.
The CIAs of Beijing, Tianjin, Jiangsu and Ningxia were less than 10,000??104
m3, and the CIAs of Sichuan, Yunnan and Tibet were higher than other
provinces (Figure 4). The CIA of various forest type per 100 km2 was in the range of 0?C275??104 m3. CIAs of various forest type per 100 km2 higher than
150??104 m3 were mostly distributed in the Guangdong,
Guangxi and Fujian (Figure 3).
Table 2 Forest water
retention dataset parameters and their definitions
|
Parameter
|
Definition
|
Unit
|
|
CIC
|
Canopy
interception capacity
|
mm
|
|
LWHC
|
Litter
maximum water-holding capacity
|
mm
|
|
SSC
|
Soil
water storage capacity
|
mm
|
|
WRC
|
Forest
water retention capacity
|
mm
|
|
ForestArea
|
The
area of various forest types within per 100 km2
|
m2
|
|
CIA
|
Canopy
interception amount
|
m3
|
|
LWHA
|
Litter
maximum water-holding amount
|
m3
|
|
SSA
|
Soil
water storage amount
|
m3
|
|
WRA
|
Forest
water retention amount
|
m3
|
|
ForestCode
|
Forest
type code
|
|
|
Prov_CN
|
Province
name in Chinese
|
|
|
Prov_EN
|
Province
name in English
|
|
Note: The
corresponding relationship between forest type codes and forest types is as
follows: 1?C16 represent cold and temperate mountainous
needleleaf forest; 17?C22 represent temperate needleleaf forest; 23?C31
represent subtropical needleleaf forest; 32?C33 represent
tropical needleleaf forest; 34?C62 represent subtropical and
tropical mountainous needleleaf forest; 63 represents temperate needleleaf and
broadleaf mixed forest; 64?C66 represent subtropical
needleleaf and broadleaf mixed forest; 67?C90 represent
temperate deciduous broadleaf forest; 91?C93 represent
temperate deciduous lobular forest; 94?C105 represent subtropical
deciduous broadleaf forest; 106?C112 represent subtropical
broadleaf mixed forest; 113?C135 represent subtropical
evergreen broadleaf forest; 136?C141 represent subtropical
sclerophyllous evergreen broadleaf forest; 142?C146 represent tropical
monsoon rainforest; 147?C161 represent tropical
rainforest; 162?C175 represent subtropical and tropical bamboo
forest; 176?C264 represent shrubland.
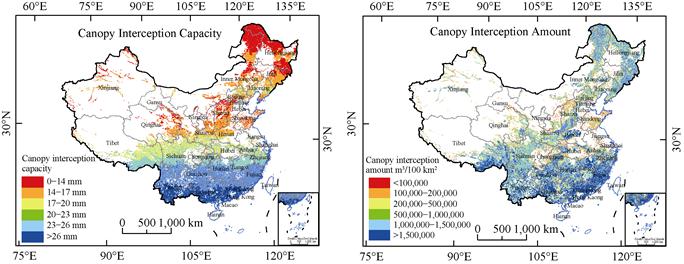
Figure 3 Maps of spatial patterns of CICs and CIAs
in China
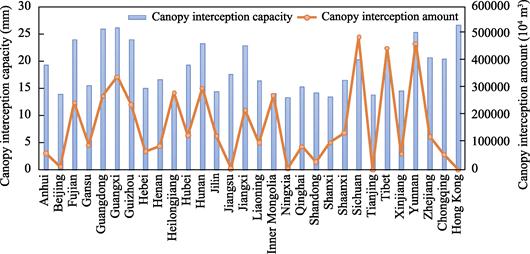
Figure 4 Distribution characteristics of CICs and
CIAs in various provinces in China
4.2.2 Spatial Patterns of the LWHC and
LWHA
Contrary
to the spatial trend of CIC, the LWHC values gradually decreased from north to
south in China, ranging from 0 mm to 17 mm (Figure 5). The LWHC values in the
Heilongjiang and northern Inner Mongolia, which were concentrated from 7?C16 mm,
were higher in China. The LWHC values in the southern provinces of China
(Yunnan, Guizhou, Guangdong, Guangxi, and Fujian) mostly ranged from 0 to 5 mm.
The average LWHC value had a small difference among provinces, ranging from
2.42 mm to 6.54 mm (Figure 6).
The LWHAs ranged
from 6.5??104 m3 to 139,315.43??104 m3 in
each province in China. The LWHAs of Tianjin, Jiangsu and Ningxia were less
than 2,000??104 m3, and the LWHAs of Heilongjiang and
Inner Mongolia were higher than other provinces, above 100,000??104 m3
(Figure 6). The LWHA of various
forest type per 100 km2 was in the
range of 0?C109??104 m3. LWHAs of various forest type per
100 km2 higher than 30??104 m3 were mostly distributed
in the Heilongjiang and northern Inner Mongolia (Figure 5).

Figure 5 Maps of spatial patterns of LWHCs and
LWHAs in China.
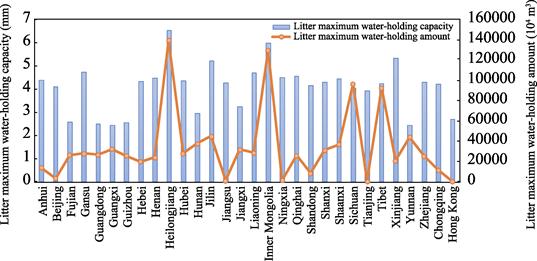
Figure 6 Distribution characteristics of LWHCs and
LWHAs in various provinces in China
4.2.3 Spatial Patterns of the SSC and SSA
The spatial pattern in the SSC values showed an increasing trend
from north to south in China, ranging from 0 mm to 104 mm (Figure 7). The SSC values higher than 65 mm were
mostly located in the southeastern Tibet, the junction of Hubei and Chongqing,
northern Jiangxi and Zhejiang. The SSC values ranged from 0 mm to 45 mm mostly in the Heilongjiang, Inner
Mongolia, Liaoning and Hebei. The average SSC value ranged from 43.95 mm to 68.14 mm in various province. Tianjin and
Heilongjiang were lower than other provinces, and the average SSC value of
Tibet, Zhejiang and Chongqing were higher (Figure 8).
The SSAs ranged from 182.24??104 m3 to 1,578,417.90??104 m3 in each province in China. The
SSAs of Tianjin, Jiangsu and Ningxia were less than 20,000??104 m3,
and the SSAs of Sichuan, Tibet and Yunnan were higher than other provinces,
above 1,000,000??104 m3 (Figure
8). The SSA of various forest type per 100 km2 was in the range of 0?C685??104 m3.
LWHAs of various forest type per 100 km2 higher
than 400??104 m3 were mostly distributed
in the Guangdong, Fujian, Shanxi and Henan (Figure 7).
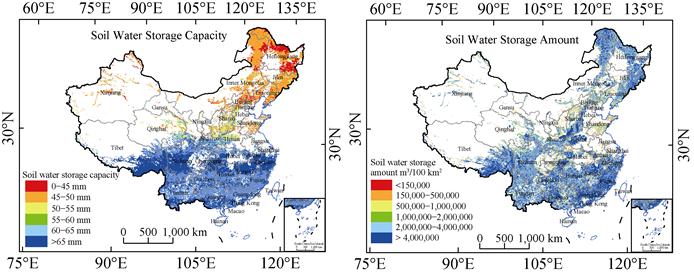
Figure 7 Maps of spatial patterns of SSCs and SSAs in China.

Figure 8 Distribution characteristics of SSCs and SSAs in various provinces in
China
4.2.4 Spatial Patterns of the WRC and WRA
The SSC values and SSAs explained most of the WRC values and
WRAs, respectively, and their distribution trends were consistent. The spatial pattern in the WRC values showed an increasing trend from north
to south in China, ranging from 0 mm to 130 mm (Figure 9). The WRC values
higher than 90 mm were mostly located in the Southeast Tibet, Hubei, Sichuan
and the provinces to the south. The WRC values ranged from 0 mm to 65 mm mostly in the
Heilongjiang. The average WRC value in various
province ranged from 61.70 mm to 95.04 mm. Beijing and Tianjin were lower than
other provinces, and the average SSC value of Guangxi, Jiangxi, Zhejiang and
Chongqing were higher (Figure 10).
The WRAs ranged from 262.71??104 m3 to 2,163,771.88??104 m3 in each province in China. The
WRAs of Tianjin, Jiangsu and Ningxia were less than 20,000??104 m3,
and the SSAs of Sichuan and Tibet were higher than other provinces, above 2,000,000??104 m3 (Figure
10).
The WRA of various forest type per 100 km2 was in the range of 0?C966??104 m3.
WRAs of various forest type per 100 km2 higher
than 500??104 m3 were mostly distributed
in all provinces (Figure 9).
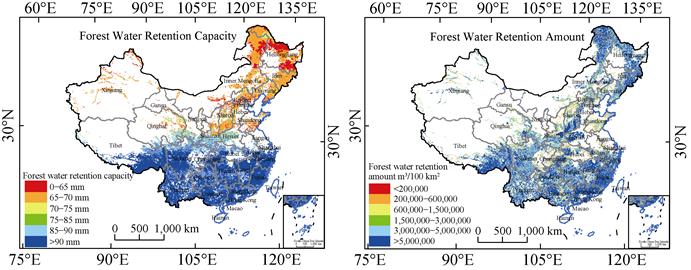
Figure 9 Maps of spatial patterns of WRCs and WRAs in China
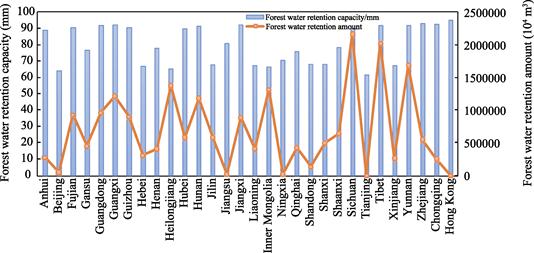
Figure 10 Distribution characteristics of WRCs and WRAs in various provinces in
China
4.3 Data Validation
An independent dataset including 30% sampling points
was randomly selected from the original canopy, litter and soil layer samples
as the validation samples to assess model performance. The root mean square
error (RMSE) and mean absolute
error (MAE) were
calculated for 30 times to assess the accuracy of the predicted CIC, LWHC and
SSC values based on the random forest model. In addition, the standard
deviations (SD) of the performance indicators RMSE and MAE for
the CIC, LWHC, SSC values were also presented.
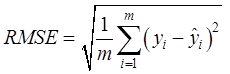 (7)
(7)
 (8)
(8)
where is the observed
CIC, LWHC or SSC value in the ith sample;
is the observed
CIC, LWHC or SSC value in the ith sample; is the simulated
CIC, LWHC or SSC value in the ith sample; m is the total number of samples.
is the simulated
CIC, LWHC or SSC value in the ith sample; m is the total number of samples.
The RMSEs and MAEs of random forest for spatial prediction of
CIC, LWHC and SSC in China were shown in Table 3. The RMSE and MAE for
CIC were 7.19??0.14 mm and 4.64??0.06 mm, respectively. For the predicted LWHC values, the
random forest model produced the lowest RMSE and MAE (RMSE = 3.50??0.07 mm and MAE = 1.97??0.05 mm). For the predicted SSC values, the values of these two indices were 35.05??0.43 mm for RMSE and
22.56??0.18 mm for MAE.
Table
3 The RMSEs and MAEs of random forest for
spatial prediction of CIC, LWHC and SSC in China
|
Indicators
|
CIC
|
LWHC
|
SSC
|
|
RMSE??SD
/mm
|
7.19??0.14
|
3.50??0.07
|
35.05??0.43
|
|
MAE??SD /mm
|
4.64??0.06
|
1.97??0.05
|
22.56??0.18
|
5 Discussion and Conclusion
In order to estimate forest water retention services
at the national scale, the 1,045 observation sites were collected to construct
a forest water retention parameter dataset. The
random forest model was used to predict the spatial distribution
characteristics. Finally, we further analyzed the spatial pattern of forest
water retention.
The results showed that the random forest model based on
observational sites had good results in predicting the spatial pattern of
forest water retention in China. The SSC values and SSAs explained most of the
WRC values and WRAs, respectively, accounting for about 54%?C97%, followed by
CIC values and CIAs, LWHC values and LWHAs. Contrary to the spatial trend of
LWHC, the CIC, SSC and WRC gradually increased from north to south in China. The
CIAs, SSAs and WRAs of Sichuan, Tibet, and Yunnan were higher than other
provinces, and the LWHAs of Heilongjiang and Inner Mongolia were higher.
However, the observation data collected based on
meta-analysis had a large age span (1987-2017), and the observation
time was also inconsistent. There was a lack of research on the spatial pattern
of forest water retention in different time series. In addition, natural
factors, such as meteorological factors, terrain factors, soil factors, etc.,
were taken into account when constructing the random forest model. However,
with the continuous expansion of human footprints on land, the original forest
had been destroyed, the forest area had decreased, and China has attached great
importance to the construction of ecological civilization. A series of major
decision-making arrangements have been issued, and a series of ecological
protection and restoration projects have been carried out. In the future, the
impact of human activities and policy implementation on forest ecosystems
should be considered.
Author Contributions
Shi, W. J. and
Tao, F. L. made the overall design for the development of dataset; Wu, X.
collected and processed the data; Shi, W. J., Tao, F. L. and Wu, X. designed
the model and algorithm of the dataset. Wu, X. did data verification; Wu, X.
wrote the data paper.
Conflicts of Interest
The
authors declare no conflicts of interest.
References
[1]
Lang,
Y., Song, W., Zhang, Y. Responses of the water-yield ecosystem service to
climate and land use change in Sancha River Basin, China [J]. Physics and Chemistry of the Earth, Parts
A/B/C, 2017, 101: 102‒111.
[2]
Moiwo,
J. P., Tao, F., Lu, W. Analysis of satellite-based and in situ hydro-climatic
data depicts water storage depletion in North China Region [J]. Hydrological Processes, 2013, 27(7):
1011‒1020.
[3]
Zhang,
B. A., Li, W. H., Xie, G. D., et al.
Water conservation of forest ecosystem in Beijing and its value [J]. Ecological Economics, 2010, 69(7):
1416‒1426.
[4]
Feng,
J. G., Ding, L. B., Wang, J. S., et al.
Case-based evaluation of forest ecosystem service function in China [J]. Chinese Journal of Applied Ecology,
2016, 27(5): 1375‒1382.
[5]
Julian,
J. P., Gardner, R. H. Land cover effects on runoff patterns in eastern Piedmont
(USA) watersheds [J]. Hydrological
Processes, 2014, 28(3): 1525‒1538.
[6]
Wu,
X., Shi, W. J. Spatial simulation methods of regional forest water conversation
based on observed data: A review [J]. Journal
of Ecology and Rural Environment, 2019, 35: 1505‒1515.
[7]
Tang,
Y. Z., Shao, Q. Q. Water conservation capacity of forest ecosystem and its
spatial variation in the upper reaches of Wujiang River [J]. Journal of Geo-information Science,
2016, 18, 987‒999.
[8]
Liu,
L. L., Shao, Q. Q., Liu, J. Y., et al.
Estimation of forest water conservation capacity in Qiongjiang River Watershed
[J]. Ecology and Environmental Sciences,
2013, 22, 451‒457.
[9]
Wu,
X., Shi, W. J., Tao, F. L. Spatial dataset of forest water retention in China
based on meta-analysis [J/DB/OL]. Digital
Journal of Global Change Data Repository, 2022.
https://doi.org/10.3974/geodb.2022. 03.06.V1.
https://cstr.escience.org.cn/CSTR:20146.11.2022.03.06.V1.
[10]
GCdataPR
Editorial Office. GCdataPR data sharing policy [OL].
https://doi.org/10.3974/dp.policy.2014.05 (Updated 2017).
[11]
Zhang,
L., Wang, L. L., Zhang, X. D., et al. The basic principle of random
forest and its applications in ecology: a case study of Pinus yunnanensis [J]. Acta
Ecologica Sinica, 2014, 34(3): 650‒659.
[12]
Breiman,
L. Random forests [J]. Machine learning, 2001, 45: 5‒32.
[13]
De??ath,
G., Fabricius, K. E. Classification and regression trees: a powerful yet simple
technique for ecological data analysis [J]. Ecology,
2000, 81(11): 3178‒3192.
[14]
Wu,
X., Shi, W. J., Guo, B., et al. Large
spatial variations in the distributions of and factors affecting forest water
retention capacity in China [J]. Ecological
Indicators, 2020, 113: 106152.
[15]
Wu,
X. Spatial distributions and factors affecting of forest water conservation in
mainland China [D]. Qingdao: Shandong University of Science and Technology,
2019.
[16]
Li,
H., Li, Z., Li, Z., et al. Evaluation
of ecosystem services: A case study in the middle reach of the Heihe River
Basin, Northwest China [J]. Physics and
Chemistry of the Earth, Parts A/B/C, 2015, 89: 40‒45.
[17]
Laino-Guanes,
R., Gonz??lez-Espinosa, M., Ram??rez-Marcial, N., et al. Human pressure on water quality and water yield in the upper
Grijalva river basin in the Mexico-Guatemala border [J]. Ecohydrology & Hydrobiology, 2016, 16(3): 149‒159.
[18]
Fan,
Y. N., Liu, K., Chen, S. S., et al.
Spatial pattern analysis on water conversation functionality of land ecosystem
in northern slope of Qinling Mountains [J]. Bulletin
of Soil and Water Conservation, 2017, 37(2): 50‒56.
[19]
Ouyang,
Z., Zheng, H., Xiao, Y., et al.
Improvements in ecosystem services from investments in natural capital [J]. Science, 2016, 352(6292): 1455‒1459.