Methodology and Development for the Thermal
Stress Prediction Dataset of Coral Reefs in South China Sea Islands (1982?C2100)
Chen, Z. K.1,2 Yu, K. F. 1,3 Su, F. Z.4 Zuo, X. L.1*
1. Guangxi Laboratory on the Study of Coral Reefs in the
South China Sea, School of Marine Sciences, Guangxi University, Nanning 530004,
China;
2. Beijing Tongbolian Water Consulting Co., Ltd, Beijing 101200,
China;
3. Southern Marine Science and Engineering Guangdong
Laboratory (Zhuhai), Zhuhai 519080, China
4. State Key Laboratory of Resources and Environmental
Information System, Institute of Geographic Sciences and Natural Resources
Research, Chinese Academy of Sciences, Beijing 100101, China
Abstract: The thermal stress prediction dataset of
coral reefs in the South China Sea Islands (1982?C2100) has been developed based
on the NOAA-AVHRR SST data from 1982?C2009 and the simulated data by the CanESM2
model at CMIP5 for 2006?C2100 in the RCP4.5 and RCP8.5 scenarios. The spatial
patterns produced by chronic and acute thermal stress on the coral reefs of the
South China Sea Islands were extracted by a linear regression method and the
Degree Heating Weeks (DHW) index. The dataset includes (1) chronic thermal
stress data, which consist of the summer SST rise rate (ºC/10a) observed by the AVHRR satellite
from 1982?C2009 and the summer SST rise rate (ºC/10a) simulated by the CanESM2 model
for 2006?C2100 in the RCP4.5 and RCP8.5 scenarios; (2) acute thermal stress
data, which consist of the accumulated recovery time during which coral reefs
have reduced ecosystem functions following acute thermal stress events for all
reef cells according to AVHRR-observed SST data from 1982?C2009, monthly DHW
data, and the years in which reef locations start to experience bleaching
conditions annually (annual bleaching year) for 2006?C2100. The dataset is
archived in .tif and .img data format, consisting of 6,862 data files with a
data size of 57.5 MB (compressed to one single 12.0 MB file).
Keywords: chronic thermal
stress; acute thermal stress; coral reef; South China Sea
Dataset Availability Statement:
The dataset supporting this paper was published and is accessible
through the Digital
Journal of Global Change Data Repository at:
https://doi.org/10.3974/geodb.2020.09.07.V1.
1 Introduction
Since the industrial revolution, the greenhouse effect
caused by the large-scale burning of fossil fuels and other substances has
caused the earth??s surface temperature and ocean temperature to rise[1].
In recent years, the increase in ocean temperature has exceeded the corals
survival temperature range of 25?C29 ºC, and has led to worldwide
large-scale coral bleaching and coral death[2?C4]. In addition,
rising ocean temperatures enhance the possibility of coral disease outbreaks
and affect coral embryo survival, coral larvae attachment, coral growth, and
calcification[5?C9]. Fortunately, historical evidence shows that
corals can migrate to more favorable environments to cope with climate change[10,11].
Under the global changes, the present and future temporal and spatial patterns
of thermal stress on coral reefs can help reveal the evolution of thermal
stress and predict areas of temporary refuge for coral reefs. This has great
significance for the monitoring of coral reef ecosystem resilience and the
construction of protected areas.
Abnormally
high Sea Surface Temperatures (SSTs) in coral reef areas can be divided into
chronic thermal stress and acute thermal stress. Chronic thermal stress refers
to the long- term warming rate of seawater, which exhibits a certain pattern of
change with latitude[12,13]. Acute thermal stress refers to an
abnormal SST rise that occurs within a short period of time, quickly inducing
coral bleaching and affecting ecosystem functions[2], such as the El
Niño- Southern Oscillation (ENSO) event[14].
The ENSO event in 1997?C1998 induced large-scale coral bleaching and caused 27%
of the global coral reefs to disappear[14]. Additionally, thermal
stress can affect the resilience of coral reef ecosystems. Field investigations
have found that thermal stress events
can increase the adaptability of corals to higher SSTs. Therefore, reefs located in areas of lower SST rises and
larger SST fluctuations suffered less severe bleaching during the large-scale
coral bleaching event of 2010 in Southeast Asia[15,16].
In addition, corals undergo rapid species selection after severe acute thermal
stress events, and the survival of species with high resistance can improve the
resilience of coral reef ecosystems[17,18].
More than 200 coral
reefs are widely distributed around the South China Sea Islands, only a few of
them were observed by weather stations. Therefore, SST data obtained by
satellites still constitute the main source of data for analyzing the thermal
stress intensity of coral reefs in the South China Sea Islands. The FilledSST
data in the Coral Reef Anomaly Database
(CoRTAD)
are generated by interpolating the mean day and night SST data from the AVHRR
satellite, with weekly a spatial resolution of 4 km[19]. The
historical SSTs simulated by the Canadian Earth System Model of the CCCma
(CanESM2) for CMIP5 can also be used, as can the linear trend of the SST over
the next 100 years as estimated by CanESM2 in the South China Sea[20,21].
This study adopts the widely used SST rise rate index and the Degree Heating
Weeks (DHW) index to analyze the chronic and acute thermal stress intensities
over the past 30 years and for the next 80 years for the coral reefs of the
South China Sea Islands. Our analysis is based on the satellite-observed SST in
the CoRTAD database for the period 1982?C2009 and the SST data simulated by the
CMIP5 CanESM2 model in the RCP4.5 and RCP8.5 scenarios for 2006?C2100. The
chronic thermal stress dataset includes the SST rise rate. The acute thermal
stress dataset includes three types of data: DHW data, the accumulated recovery
time in which coral reefs have reduced ecosystem functions, and the annual
bleaching year of coral reefs.
2 Metadata of the Dataset
The metadata of the Thermal stress prediction dataset of
coral reefs in South China Sea Islands (1982?C2100) is in Table 1[22].
Table 1
Metadata summary of the Thermal
stress prediction dataset of coral reefs in South China Sea Islands (1982?C2100)
|
Items
|
Description
|
|
Dataset full name
|
Thermal stress prediction dataset of coral reefs in South
China Sea Islands (1982?C2100)
|
|
Dataset short name
|
ThermalStressCoralReefs_SCSIs
|
|
Authors
|
Chen, Z. K. ABG-1644-2020, Guangxi Laboratory on the Study of
Coral Reefs in the South China Sea, School of Marine Sciences, Guangxi
University; Heilongjiang Agricultural Reclamation Survey, Design and Research
Institute, 453699504@qq.com
Su, F. Z. 0000-0003-4972-3595, State Key Laboratory of
Resources and Environmental Information System, Institute of Geographic
Sciences and Natural Resources Research, Chinese Academy of Sciences, sufz@lreis.ac.cn
Zuo, X. L. ABF-9658-2020, Guangxi Laboratory on the Study of
Coral Reefs in the South China Sea, School of Marine Sciences, Guangxi
University, zuoxl@gxu.edu.cn
|
|
Geographical region
|
2??N?C27??N, 107??E?C122??E
Year 1982?C2009, 2006?C2100
|
|
Temporal resolution
|
monthly (2006‒2100) Spatial
resolution 4 km (1982‒2009),
1??(2006‒2100)
|
|
Data format
|
.tif,
.img
Data size
57.5 MB (12.0 MB in compression)
|
|
Data files
|
6,862 data files in two folders,
compressed into one file
(1) ChronicThermalStress folder. This contains the SST rise
rate extracted by the linear regression method. There are 12 files in total,
including three .tif data files.
(2) AcuteThermalStress folder. This contains the DHW data,
the accumulated recovery time data specifying how long coral reefs spend with
reduced ecosystem functions, and the annual bleaching year data. There are five
folders in total. The RCP4.5DHW_200603-210012 and the RCP8.5DHW_200603-210012
folders contain the DHW data. There are 6836 files in total, including 1138
.img data files in each folder. The AccumulatedRecoveryTime_1982-2009 folder contains
the accumulated recovery time data. There are 4 files in total, including one
.tif data file. The YearsStartBleachingAnnually_CanESM2_RCP4.5_2006-2100 and
the YearsStartBleachingAnnually_CanESM2_RCP8.5_2006-2100 folders contain the
annual bleaching year data. There are 10 files in total, including one .tif
data file in each folder.
|
|
Foundations
|
National Natural Science Foundation of
China (41801341); Guangxi Natural Science Foundation of China
(2018JJB150030); Chinese Academy of Sciences (XDA13010400)
|
|
Computing environment
|
ArcGIS 10.2
|
|
Data publisher
|
Global Change Research Data Publishing & Repository, http://www.geodoi.ac.cn
|
|
Address
|
No. 11A, Datun Road, Chaoyang District, Beijing 100101, China
|
|
Data sharing policy
|
Data from the Global Change
Research Data Publishing & Repository includes metadata, datasets (in the Digital Journal of Global Change Data Repository), and
publications (in the Journal of Global Change Data & Discovery). Data
sharing policy includes: (1) Data are openly available
and can be free downloaded via the Internet; (2) End users are encouraged to
use Data subject to citation; (3) Users, who are by definition
also value-added service providers, are welcome to redistribute Data subject
to written permission from the GCdataPR Editorial Office and the issuance of
a Data redistribution license; and (4) If Data are
used to compile new datasets, the ??ten per cent principal?? should be followed
such that Data records utilized should not surpass 10% of the
new dataset contents, while sources should be clearly noted in suitable places
in the new dataset[23]
|
|
Communication and
searchable system
|
DOI, DCI, CSCD, WDS/ISC, GEOSS, China GEOSS, Crossref
|
3 Methods
3.1 Algorithm
3.1.1 Data Correction
The CoRTAD
FilledSST data are accurate when compared with the SST data of coral locations
at a depth of at least 10 m[19]. Therefore, no corrections are
required for the FilledSST data. To ensure that the SST data output by the
CanESM2 model are consistent with the observed SST data, the monthly ??tos??
(i.e., SST) data of r1i1p1, given by the CanESM2 model in the RCP4.5 and RCP8.5
scenarios, are resampled to 1????1?? resolution. The mean SST data for 2006?C2011
output by the CanESM2 model is subtracted from the resampled data, and the meteorological
mean data from NOAA??s Optimum Interpolation Sea Surface Temperature (OISST) for
1982?C2005 are then added to obtain the corrected data[3].
3.1.2 Chronic
Thermal Stress
The linear regression method is used to estimate the summer SST rise rate (ºC/10a) of the South
China Sea for the period 1982?C2009 and in the RCP4.5 and RCP8.5 scenarios for
2006?C2100. The calculations are based on the average SST of each pixel in summer
(May?CSeptember) in each year.
3.1.3
Acute Thermal Stress
(1) DHW index:
The DHW data for
1982?C2009 are calculated using Eq. (1) based on weekly SST data[24],
and the DHW data for 2006?C2100 are calculated using Eq. (2) based on monthly
SST data[3].
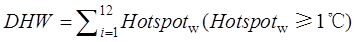 (1)
(1)
Or
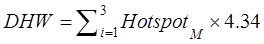 (2)
(2)
 (3)
(3)
where  and
and  denotes the climatological SST anomaly based on weekly
resolution and monthly resolution, respectively. MMM was taken to be the
average CoRTAD SST of the hottest week in this period; for 2006?C2100, MMM
was taken as the average OISST of the hottest month obtained using satellite
data from 1982?C2005 (http://www.esrl.noaa.gov/psd/).
denotes the climatological SST anomaly based on weekly
resolution and monthly resolution, respectively. MMM was taken to be the
average CoRTAD SST of the hottest week in this period; for 2006?C2100, MMM
was taken as the average OISST of the hottest month obtained using satellite
data from 1982?C2005 (http://www.esrl.noaa.gov/psd/).
(2) Recovery time in which coral reefs
have reduced ecosystem functions (capacity to grow, repair, and reproduce) from
1982?C2009:
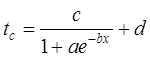 (4)
(4)
where tc is the
estimated time of reduced ecosystem function following exposure to an annual
maximum DHW of x for each
year. Scientific evidence indicates
that coral reefs that have experienced severe acute thermal stress events with
coral mortality (DHW = 8 ??Cžweeks) require at least 5 years to return to their
original status; 20 years is defined as the longest time required for shifting
back to an unaltered state when coral mortality has caused the complete
degradation of the reef ecosystem[25]. The values of the parameters a and b were calculated by an experimental curve-fitting procedure; c is the asymptotic value or maximum
observed time for a coral reef to fully return to its original condition after
bleaching caused massive mortality; d
= −c/1+a.
The accumulated recovery time is
calculated as the sum of recovery time in which coral reefs have reduced ecosystem
functions in each coral reef pixel from 1982 to 2009.
(3) Annual bleaching year in 2006?C2100:
The DHW threshold is
set to six to indicate that coral bleaching will be occurred above this value,
which is regarded as the optimal bleaching threshold for global coral reefs[26].
Based on the time series DHW data in the RCP4.5 and RCP8.5 scenarios for
2006?C2100, the starting year in which bleaching events (>6DHWs) occurred for
10 consecutive years was extracted using the coral reef pixels; this is also
defined as the annual bleaching year.
3.2 Technology
Route
The methods used
to generate the data described in this paper can be divided into the following
major phases. First, the chronic thermal stress for 1982?C2009 was calculated
based on the linear regression method using the satellite-observed CoRTAD
FilledSST data, and that for 2006?C2100 was calculated under the RCP4.5 and
RCP8.5 scenarios using the SST data output by the CanESM2 model. Second, the
DHW data for 1982?C2009 and 2006?C2100 were calculated based on Equations
(1)?C(3). On this basis, an index for the accumulated recovery time during which
coral reefs have reduced ecosystem functions was calculated for 1982?C2009 based
on Equation (4) and the annual bleaching year index under the RCP4.5 and RCP8.5
scenarios was calculated for 2006?C2100. The four types of data described above
constitute the thermal stress dataset for coral reefs in the South China Sea
Islands. The data include the SST rise rate, DHW, the accumulated recovery time
during which coral reefs have reduced ecosystem functions, and the annual
bleaching year. The technical route is shown in Figure 1.

Figure 1 Technology route of the dataset
development
4 Data Results
and Validation
4.1 Dataset Composition
The ??Thermal stress prediction dataset of coral reefs in
South China Sea Islands (1982?C2100)?? includes the SST rise rate data
(1982?C2100), DHW data (2006?C2100), the accumulated recovery time during which
coral reefs have reduced ecosystem function data (1982?C2009), and the annual
bleaching year data (2006?C2100). The name, data description, data format, number
of files and data volume are listed in Table 2.
(1) Chronic thermal stress data. These
data include the satellite-observed summer SST rise rate for 1982?C2009 given by
the linear regression method and the modeled summer SST rise rate under the
RCP4.5 and RCP 8.5 scenarios for 2006?C2100 according to the CanESM2 model,
which are named SSTIncreasing_1982-2009.tif, SSTIncreasing_CanESM2_ RCP4.5_2006-2100.tif
and SSTIncreasing_CanESM2_RCP8.5_2006-2100.tif.
(2) Acute thermal stress data. These data
include the accumulated recovery
time during which coral reefs have reduced ecosystem functions, as calculated
by the DHW index (1982?C2009), DHW data (2006?C2100), and the annual bleaching
years of coral reefs (2006?C2100). The accumulated recovery time during which
coral reefs have reduced ecosystem functions for 1982?C2009 is named
AccumulatedRecoveryTime_1982-2009.tif. Annual bleaching years calculated by the
DHW data in the CanESM2 model under the RCP4.5 and RCP8.5 scenarios are named
YearsStartBleachingAnnually_CanESM2_RCP4.5_2006- 2100.tif and YearsStartBleachingAnnually_CanESM2_RCP8.5_2006-2100.tif.
The DHW data of the coral reef pixels for the South China Sea Islands under the
RCP4.5 and RCP8.5 scenarios for 2006?C2100 are estimated based on the SST data
output by the CanESM2 model, and they are stored in the RCP4.5DHW and RCP8.5DHW
folders, which are named RCP45_yyyy_mmDHW.img and RCP85_yyyy_mmDHW.img
respectively, where yyyy represents a four-digit year and mm represents a
two-digit month.
Table 2 List
of data files in the Thermal Stress Prediction Dataset of Coral Reefs in South
China Sea Islands (1982‒2100)
|
Composition Folder
|
Composition File and
Naming method
|
Description
|
Format
|
Number of files
|
Data size
|
|
ChronicThermalStress
|
SSTIncreasing_1982-2009.tif
|
Satellite-observed SST rise rate(??/10a) from
1982‒2009
|
.tif
|
4
|
1.36 MB
|
|
SSTIncreasing_CanESM2_ RCP4.5_2006-2100.tif
|
Modelled SST rise rate (??/10a) in
RCP4.5 scenario for 2006‒2100 according to CanESM2 model
|
.tif
|
4
|
67 KB
|
|
SSTIncreasing_CanESM2_ RCP8.5_2006-2100.tif
|
Modelled SST rise rate (??/10a) in
RCP8.5 scenario for 2006‒2100 according to CanESM2 model
|
.tif
|
4
|
67 KB
|
|
AcuteThermalStress
|
AccumulatedRecoveryTime_1982-2009 folder
|
AccumulatedRecoveryTime_1982-2009.tif
|
Accumulated recovery time during which coral reefs have reduced
ecosystem functions for 1982?C2009 calculated based on DHW data
|
.tif
|
4
|
1.37 MB
|
|
RCP4.5DHW_200603-210012 folder
|
RCP45_yyyy_mmDHW.img
|
DHW data in RCP4.5 scenario for 2006?C2100 predicted using SST
data output by CanESM2 model (yyyy represents a four-digit year and mm represents
a two-digit month)
|
.img
|
3,418
|
27.3 MB
|
|
RCP8.5DHW_200603-210012 folder
|
RCP85_yyyy_mmDHW.img
|
DHW data in RCP8.5 scenario for 2006?C2100 predicted using SST
data output by CanESM2 model (yyyy represents a four-digit year and mm represents
a two-digit month)
|
.img
|
3,418
|
27.3 MB
|
|
YearsStartBleach-ingAnnual-ly_CanESM2_RCP4.5_2006-2100 folder
|
YearsStartBleachingAnnually_ CanESM2_RCP4.5_2006-2100.tif
|
Annual bleaching year predicted for 2006?C2100 in RCP4.5 scenario
according to CanESM2 model
|
.tif
|
5
|
36 KB
|
|
YearsStartBleach-ingAnnual-ly_CanESM2_RCP8.5_2006-2100 folder
|
YearsStartBleachingAnnually_ CanESM2_RCP8.5_2006-2100.tif
|
Annual bleaching year predicted for 2006?C2100 in RCP8.5 scenario
according to CanESM2 model
|
.tif
|
5
|
37 KB
|
|
|
|
|
|
|
|
|
4.2 Data
Product
Description of the data product is in two parts covering
chronic thermal stress and acute thermal stress, respectively. The chronic
thermal stress includes the summer SST rise rate observed by satellites from
1982?C2009, and simulated by the CanESM2 model in the RCP4.5 and RCP8.5
scenarios for 2006?C2100. Acute thermal stress includes the accumulated recovery
time during which coral reefs have reduced ecosystem functions estimated based
on satellite-observed SSTs from 1982?C2009 and the annual bleaching years of
coral reefs based on the CanESM2 model in the RCP4.5 and RCP8.5 scenarios for
2006?C2100. The DHW data based on the CanESM2 model in the RCP4.5 and RCP8.5
scenarios for 2006?C2100 are only provided in the dataset, and this data product
is not included.
4.2.1 Chronic Thermal
Stress Data for 1982?C2100
The satellite
observed summer SST rise rate from 1982?C2009 is higher in the northern South
China Sea (>0.2 ??C/10a), where the Xisha Islands and Dongsha Islands
are located, than in the southern South China Sea (<0.2 ??C/10a), where
the Zhongsha Islands and Nansha Islands are located. The sea areas of the
Dongsha Islands and the southeastern part of the Nansha Islands have the
highest summer SST rise rates, at 0.3?C0.4 ??C/10a (Figure 2a).
The summer SST rise rate for 2006?C2100, as
simulated by the CMIP5 CanESM2 model in the RCP4.5 scenario, does not exceed
0.2 ??C/10a in the sea area where the coral reefs of the South China Sea
Islands are located. The sea area of the Nansha Islands has the highest summer
SST rise rate of 0.16?C0.20 ??C/10a, with the summer SST rise rate of other
coral reef sea areas ranging from 0.14?C0.16 ??C/10a (Figure 2b). In the
RCP8.5 scenario, the summer SST rise rate in the sea areas of the coral reefs
of the South China Sea Islands exceeds 0.2 ??C/10a, ranging from
0.34?C0.40 ??C/10a. In particular, it is slightly higher (at
0.38?C0.40 ??C/10a) in the southwestern part of the Nansha Islands, and
varies from 0.34?C0.38 ??C/10a at other coral reef sea areas (Figure 2c).
4.2.2 Acute
Thermal Stress Data for 1982?C2100
|
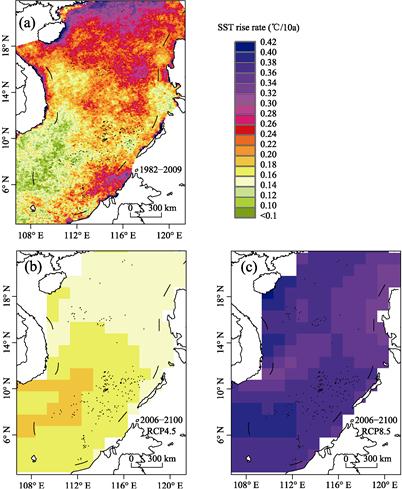
Figure 2 Chronic thermal stress intensity map in
the South China Sea Islands for 1982?C2100
(a. Summer SST rise rate
observed by satellite from 1982?C2009; b. Summer SST rise rate simulated by
CMIP5 CanESM2 model in RCP4.5 scenario for 2006?C2100; c. Summer SST rise rate
simulated by CMIP5 CanESM2 model in RCP8.5 scenario for 2006?C2100)
|
The
satellite-observed acute thermal stress from 1982?C2009 is most serious around
the Dongsha Islands, Yitong Shoal, and Zhongnan Shoal of the Zhongsha Islands,
and the accumulated recovery time during which coral reefs have reduced ecosystem
functions is 20?C30 years. The acute thermal stress in the northern,
southeastern, and southernmost parts of the
Nansha Islands is moderate, and the accumulated recovery time during which
coral reefs have reduced ecosystem functions is 10?C20 years. The acute thermal
stress in other sea areas containing coral reefs is lower, and the accumulated
recovery time is 0?C10 years (Figure 3a).
The acute thermal stress intensity of the
coral reefs in the South China Sea Islands under the RCP4.5 and RCP8.5
scenarios for 2006?C2100, as simulated by the CMIP5 CanESM2 model, shows that
the annual bleaching year in the southeast of the Nansha Islands occurs earlier
than that of other coral reefs. In the RCP4.5 scenario, coral reefs with an
annual bleaching year no later than the global average annual bleaching year
(Figure 3b, 2047, blue) are distributed in the central, southeast, and southern
parts of the Nansha Islands (Figure 3b). In the RCP8.5 scenario, coral reefs
with an annual bleaching year no later than the global average annual bleaching
year (Figure 3c, 2040, blue) are distributed in the southeast and south of the
Nansha Islands (Figure 3c).
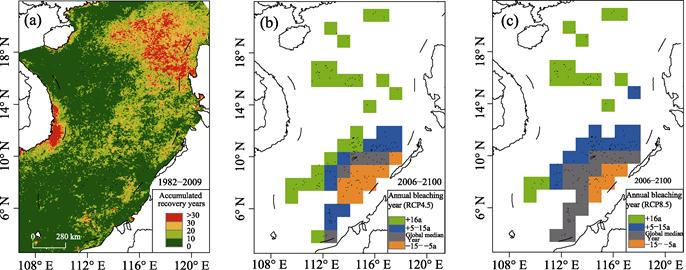
Figure 3 Acute thermal stress intensity map in the
South China Sea Islands for 1982?C2100
(a. Satellite-observed
acute thermal stress on coral reefs from 1982?C2009, expressed as the accumulated
recovery time during which coral reefs have reduced ecosystem functions; b.
acute thermal stress predicted by CanESM2 model in RCP4.5 scenario for
2006?C2100, expressed as the annual bleaching year (the global average year in
the figure is 2047); c. acute thermal stress predicted by CanESM2 model in
RCP8.5 scenario for 2006?C2100, expressed as the annual bleaching year (the
global average year in the figure is 2040)
4.2.3 Data Accuracy
Evaluation
The summer SST rise rate in the RCP4.5 and RCP8.5 scenarios
for 2006?C2100, as simulated by the CMIP5 CanESM2 model, shows a decreasing
trend from low to high latitudes. This trend is consistent with the most
significant ocean warming areas in the fifth assessment report of the IPCC,
which are located in the tropical and subtropical sea areas of the northern
hemisphere[27]. As the satellite-observed summer SST rise rate in
the South China Sea from 1982?C2009 may be affected by changes in SST over short
period, such as ENSO events, the abnormal SST rise during the ENSO event is
very important to the coral reef ecosystem. In the SST simulation, the model??s
ability to predict ENSO is vital to the coral reefs of the South China Sea
Islands, as it influences the accuracy of future predictions of the intensity
of chronic thermal stress and acute thermal stress. In addition, the
accumulated recovery time during which coral reefs have reduced ecosystem
functions and the annual bleaching year are comprehensive assessment indexes of
ecosystem degradation based on the DHW data observed by satellite and simulated
by the CanESM2 model. However, the accuracy of the two indexes varies at each
coral reef, and is independent of the model accuracy. Different coral reefs,
corals in different locations on the same reef, and different coral species at
the same location have distinct abilities to resist thermal stress. Therefore,
a comprehensive evaluation can be made according to the distribution and species
of corals when these results are used in applications.
5 Discussion and Conclusion
The summer SST rise rate of the
South China Sea Islands from 1982?C2009 was 0.2??C/10a, significantly higher than
the global SST rise rate of 0.11??C/10a from 1971?C2010[1]. This indicates
that the coral reefs of the South China Sea Islands are experiencing a high
intensity of chronic thermal stress. At the same time, the summer SST rise rate
of the South China Sea Islands for 2006?C2100, as simulated by the CanESM2
model, shows that these reefs will continue to face chronic thermal stress
under the effects of global climate change, and the thermal stress intensity is
related to the greenhouse gas emission scenario. According to the acute thermal
stress results, the coral reefs near the Dongsha Islands experienced the
highest acute thermal stress intensity from 1982?C2009, while the Nansha Islands
will face the highest and Dongsha Islands will face the lowest acute thermal
stress intensity under the RCP4.5 and RCP8.5 scenarios for the period
2006?C2100. This is of great significance to the restoration of coral reefs in
the Dongsha Islands.
At present, there is a lack of available chronic thermal
stress and acute thermal stress data for the coral reefs of the South China Sea
Islands. The data publicly released in this article are the thermal stress data
obtained by the AVHRR sensor from 1982?C2009 and simulated by the CMIP5 CanESM2
model for 2006?C2100. The thermal stress of coral reefs observed by satellite
from 1982?C2009 was mainly measured by the SST rise rate and the accumulated
recovery time during which coral reefs spend have reduced ecosystem functions.
The thermal stress of coral reefs simulated for 2006?C2100 was measured by the
SST rise rate and the annual bleaching year. These data have filled a gap in
our knowledge of the thermal stress that has been experienced in recent years
and will be faced in the future by coral reefs in the South China Sea Islands.
The DHW data simulated by the CanESM2 model for 2006?C2100 have also been
publicly released. This dataset is suitable for determining the temporal and
spatial evolution of thermal stress on coral reefs, predicting temporary
refuges for thermal stress on coral reefs, assisting in monitoring the
resilience of coral reef ecosystems, and serving coral reef management and
protection area construction.
Author Contributions
Zuo, X. L., Yu, K. F., and Su, F. Z.
contributed to the design of the research framework of the dataset, Zuo, X. L.
and Chen, Z. K. contributed to the collecting
and processing sea surface temperature data, as well as designing data models
and algorithms; Zuo, X.
L. contributed to the evaluating of the data. Chen, Z. K. contributed to the writing of the data paper.
Conflicts of Interest
The
authors declare no conflicts of interest.
References
[1] Stocker, T. F., Qin, D.,
Plattner, G. K., et al. IPCC, 2013:
technical summary [R]. In: Climate Change 2013: the physical
science basis. Contribution of Working
Group I to the Fifth Assessment Report of the Intergovernmental Panel on
Climate Change, 2013: 533‒535.
[2] Hoegh-Guldberg, O. Climate
change, coral bleaching and the future of the world??s coral reefs[J]. Marine
and Fresh Water Research, 1999, 50(8): 839‒866.
[3] Hooidonk, R. V., Maynard, J. A.,
Planes, S. Temporary refugia for coral reefs in a warming world [J]. Nature
Climate Change, 2013, 3(5): 508‒511.
[4] Sheppard, C., Sheppard, A.,
Mogg, A., et al. Coral bleaching and
mortality in the Chagos Archipelago [J].
Atoll Research Bulletin, 2017(613):
1‒26.
[5] Ferreira, B. P., Costa, M. B. S.
F., Coxey, M. S., et al. The effects
of sea surface temperature anomalies on oceanic coral reef systems in the
southwestern tropical Atlantic [J]. Coral Reefs, 2013, 32(2): 441‒454.
[6] Worum, F. P.,
Carricart-Ganivet, J. P., Benson, L., et
al. Simulation and observations of annual density banding in skeletons of
Montastraea (Cnidaria: Scleractinia) growing under thermal stress associated
with ocean warming [J]. Limnology and Oceanography, 2007, 52(5):
2317‒2323.
[7] Randall, C. J., Szmant, A. M.
Elevated temperature affects development, survivorship, and settlement of the
elkhorn coral, Acropora palmata (Lamarck 1816) [J]. The Biological Bulletin,
2009, 217(3): 269‒282.
[8] Carricart-Ganivet, J. P.,
Cabanillas-Teran, N., Cruz-Ortega, I., et
al. Sensitivity of calcification to thermal stress varies among genera of
massive reef-building corals [J]. PLoS One, 2012, 7(3): e32859.
[9] Chen, T., Li, S., Yu, K., et al. Increasing temperature
anomalies reduce coral growth in the Weizhou Island, northern South China Sea [J]. Estuarine,
Coastal and Shelf Science, 2013, 130: 121‒126.
[10] Wallace, C. C., Rosen, B. R.
Diverse staghorn corals (Acropora) in high-latitude Eocene assemblages:
implications for the evolution of modern diversity patterns of reef corals [J]. Proceedings
of the Royal Society B-Biological Sciences, 2006, 273(1589): 975.
[11] Greenstein, B. J., Pandolfi, J.
M. Escaping the heat: range shifts of reef coral taxa in coastal Western
Australia [J]. Global Change Biology, 2010, 14(3): 513‒528.
[12] Mumby, P. J., Wolff, N. H.,
Bozec, Y. M., et al. Operationalizing
the resilience of coral reefs in an era of climate change [J]. Conservation
Letters, 2014, 7(3): 176‒187.
[13] McWilliams, J. P., Côt??, I. M.,
Gill, J. A., et al. Accelerating
impacts of temperature-induced coral bleaching in the Caribbean [J]. Ecology,
2005, 86(8): 2055‒2060.
[14] Lough, J. 1997?C98:
Unprecedented thermal stress to coral reefs? [J]. Geophysical Research
Letters, 2000, 27(23): 3901‒3904.
[15] Meissner, K. J., Lippmann, T.,
Gupta, A. S. Large-scale stress factors affecting coral reefs: open ocean sea
surface temperature and surface seawater aragonite saturation over the next 400
years [J]. Coral Reefs, 2012, 31(2): 309‒319.
[16] Oliver, T. A., Palumbi, S. R.
Do fluctuating temperature environments elevate coral thermal tolerance? [J]. Coral
Reefs, 2011, 30(2): 429‒440.
[17] Thompson, D. M., Woesik, R. V.
Corals escape bleaching in regions that recently and historically experienced
frequent thermal stress [J]. Proceedings of the Royal Society Biological
Sciences, 2009, 276(1669): 2893‒2901.
[18] Guest, J. R., Baird, A. H., Maynard,
J. A., et al. Contrasting patterns of
coral bleaching susceptibility in 2010 suggest an adaptive response to thermal
stress [J]. PLoS One, 2012, 7(3): e33353.
[19] Selig, E. R., Casey, K. S.,
Bruno, J. F. New insights into global patterns of ocean temperature anomalies:
implications for coral reef health and management [J]. Global Ecology & Biogeography, 2010, 19(3): 397‒411.
[20] Huang, C. J., Qiao, F. L., Song, Y. J., et al. The simulation and forecast of
SST the South China Sea by CMIP5 model [J]. Acta
Oceanologica Sinica, 2014(1): 38‒47.
[21] Zhang, F., Dong, M., Wu, T. W. Evaluation of the
ENSO features simulations as done by the CMIP5 models [J]. Acta Meteorologica Sinica, 2014(1): 30‒48.
[22] Chen, Z. K., Su, F. Z., Zuo, X. L. Thermal stress
prediction dataset of coral reefs in South China Sea Islands (1982-2100) [J/DB/OL].
Digital Journal of Global Change Data Repository,
2020. https://doi.org/10.3974/geodb.2020.09.07.V1.
[23] GCdataPR Editorial Office. GCdataPR Data Sharing
Policy [OL]. https://doi.org/10.3974/dp.policy.2014.05 (Updated 2017).
[24] Liu, G., Strong, A. E.,
Skirving, W. Remote sensing of sea surface temperatures during 2002 Barrier
Reef coral bleaching [J]. Eos,
Transactions American Geophysical Union, 2003, 84(15): 137.
[25] Magris, R. A., Heron, S. F.,
Pressey, R. L. Conservation planning for coral reefs accounting for climate
warming disturbances [J]. PLoS One, 2015, 10: e0140828.
[26] Hooidonk, R. V., Huber, M.
Quantifying the quality of coral bleaching predictions [J]. Coral Reefs, 2009,
28(3): 579‒587.
[27] Shen, Y. P., Wang, G. Y. Key Findings and
assessment results of IPCCWGI fifth assessment report [J]. Journal of Glaciology and Geocryology, 2013, 35(5): 1068‒1076.