Dataset of Cultural Diversity Index in Southwest China (1990, 2000, 2010)
Shen, Y.1 Deng, H. B.2* Shen, M. X.1
1. Suzhou Academy of Agricultural Sciences (Institute of Agricultural Sciences in Taihu Lake District), Suzhou 215155, China;
2. The State Key Laboratory of Urban and Regional Ecology, Research Center for Eco-Environmental Sciences, Chinese Academy of Sciences, Beijing 100085, China
Abstract: To develop a dataset of cultural diversity index in Southwest China, the Shannon-Wiener index was used to quantitatively evaluate cultural diversity at the county, city, and province levels in 1990, 2000, and 2010. In this study, Southwest China was considered to include the Guangxi Zhuang autonomous region, Chongqing municipality, Sichuan province, Guizhou province, and Yunnan province along with the Lhasa, Nagqu, Nyingchi, and Qamdo prefectures of the Tibet autonomous region and Yushu Tibetan autonomous prefecture of Qinghai province (including Tanggula town, the enclave of Geermu city). Based on population data from the fourth (1990), fifth (2000), and sixth (2010) censuses, a total of 58 ethnicity classifications were identified, including 56 ethnicities, unidentified ethnicity, and foreigners that have become Chinese nationals. The dataset includes the cultural diversity index on the county, city, and province levels in Southwest China in 1999, 2000, and 2010. The data are archived in .shp format, and the dataset consists of seven groups of files with a total size of 23.9 MB (compressed to one single file with a size of 14.9 MB). Analysis of the data shows that the cultural diversity in Southwest China exhibited clear spatial heterogeneity, with lower diversity in the northwestern part of the study region and higher diversity in the southeastern part. In addition, the cultural diversity index gradually increased as the spatial scale expanded, quantitatively confirming that different ethnic groups tend to live together on large scales and cluster apart on small scales in Southwest China. The analysis results based on this dataset were published in Acta Ecologica Sinica in 2018 (Vol. 38, No. 21).
Keywords: cultural diversity; ethnic population; Southwest China; 1990–2010; Acta Ecologica Sinica
1 Introduction
As a multi-ethnic country with a long history, China has distinctive and colorful ethnic cultures. The southwestern region of China is an area of concentrated ethnic minorities; the 34 minorities in this region account for 48.32% of China’s total population of ethnic minorities[1]. Due to the different geographic environments, climatic conditions, production materials, and other factors in the areas where different ethnic groups are distributed, these ethnic groups have developed unique cultural characteristics over time[2]. To a certain extent, Southwest China highlights China’s multi-ethnic nature and the contributions of different traditional Chinese ethnic cultures[3]. Due to the comprehensive and diverse characteristics associated with ethnicity, ethnic diversity has become the main type of cultural diversity. In addition, the clear classification of ethnic categories and population statistics make it possible to quantify cultural diversity from the perspective of ethnicity[4].
Southwest China mainly includes the Nujiang River basin, the Lancang River basin, the Red River basin, and the upper reaches of both the Yangtze River basin and the Pearl River basin[5]. In this study, the Southwest China (20°54¢N–36°29¢N, 85°31¢E–112°30¢E) include the Guangxi Zhuang autonomous region, Chongqing municipality, Sichuan province, Guizhou province, and Yunnan province along with the Lhasa, Nagqu, Nyingchi, and Qamdo prefectures of the Tibet autonomous region and Yushu Tibetan autonomous prefecture of Qinghai province (including Tanggula town, the enclave of Geermu city), with a total area of 2,329,300 km2. Based on census data, this study used the Shannon-Wiener index for biodiversity to calculate the cultural diversity index of Southwest China at the county, city, and province levels in 1990, 2000, and 2010. The results provide a methodological reference for quantitatively assessing ethnic diversity.
2 Metadata of Dataset
The metadata of the “Dataset of cultural diversity index in Southwest China (1990, 2000, 2010)”[6] are summarized in Table 1. It includes the dataset full name, short name, authors, year of the dataset, temporal resolution, spatial resolution, data format, data size, data files, data publisher, and data sharing policy, etc.
3 Methods
The administrative division and boundary vector data used in this study were obtained from the National Earth System Science Data Sharing Infrastructure, National Science & Technology Infrastructure of China (http://www.geodata.cn). Ethnic population data were derived from the fourth (1990)[8], fifth (2000)[9], and sixth (2010)[10] censuses conducted by the State Council. Based on these census data, the central government confirmed 56 ethnicities along with unidentified ethnicity and foreigners that have become Chinese nationals, resulting in a total of 58 ethnic classifications. In this study, the county-level administrative district was the basic research unit. Due to local changes in administrative divisions, the total numbers of research units in 1990, 2000, and 2010 were 588, 600, and 603, respectively.
3.1 Algorithm Principle
In ecology, the Shannon-Wiener index or Simpson index is generally used to construct biodiversity and landscape diversity indices in biology and landscape ecology[11–12]. To quantitatively analyze cultural diversity in this study, the Shannon-Wiener index was used to calculate the cultural diversity index (CD) as follows[13]:
 (1)
(1)
where Pi is the population of the ith ethnic group in the study unit (person), N is the total number of ethnic groups, and pi is the proportion of the population of the ith ethnic group out of the total population in the study unit (%):
 (2)
(2)
When the proportion of the population of each ethnic group is equal (i.e., p1 = p2 = … = pn = 1/N), CD is maximized.
Table 1 Metadata summary of “Dataset of cultural diversity index in Southwest China (1990, 2000, 2010)”
|
Items
|
Description
|
|
Dataset full name
|
Dataset of cultural diversity index in Southwest China (1990, 2000, 2010)
|
|
Dataset short name
|
CulturalDiversity_SWChina
|
|
Authors
|
Shen, Y. S-6791-2019, Suzhou Academy of Agricultural Sciences (Institute of Agricultural Sciences in Taihu Lake District), ruier55@126.com
Deng, H. B. S-7145-2019, The State Key Laboratory of Urban and Regional Ecology, Research Center for Eco-Environmental Sciences, Chinese Academy of Sciences, denghb@rcees.ac.cn
|
|
Geographical region
|
Southwest China
|
|
Year
|
1990, 2000, 2010
|
|
Temporal resolution
|
Year
|
|
Spatial resolution
|
County, city, and province levels
|
|
Data format
|
.shp
|
|
|
|
Data size
|
23.9 MB (14.9 MB, after compression)
|
|
|
|
Data files
|
The dataset contains seven-group files
|
|
Foundation
|
Ministry of Science and Technology of P. R. China (2016FYC0502106)
|
|
Data publisher
|
Global Change Research Data Publishing & Repository, http://www.geodoi.ac.cn
|
|
Address
|
No. 11A, Datun Road, Chaoyang District, Beijing 100101, China
|
|
Data sharing policy
|
Data from the Global Change Research Data Publishing & Repository includes metadata, datasets (data products), and publications (in this case, in the Journal of Global Change Data & Discovery). Data sharing policy includes: (1) Data are openly available and can be free downloaded via the Internet; (2) End users are encouraged to use Data subject to citation; (3) Users, who are by definition also value-added service providers, are welcome to redistribute Data subject to written permission from the GCdataPR Editorial Office and the issuance of a Data redistribution license, and; (4) If Data are used to compile new datasets, the ‘ten percent principal’ should be followed such that Data records utilized should not surpass 10% of the new dataset contents, while sources should be clearly noted in suitable places in the new dataset[7]
|
3.2 Technical Route
Based on the statistical analysis of the ethnic population census data, the geographic information of administrative regions at different spatial scales were matched. The CD values in 1990, 2000, and 2010 were then quantitatively calculated using Eq. (1), and the spatiotemporal distribution patterns of CD at different scales in Southwest China were obtained. The process used to create the dataset of cultural diversity is shown in Figure 1.
|
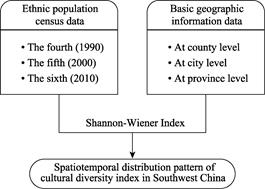
Figure 1 Flowchart showing the process used to construct the “Dataset of cultural diversity index in southwest China (1990, 2000, 2010)”
|
4 Results and Validation
4.1 Data Composition
Table 2 Composition of the “Dataset of cultural diversity in Southwest China (1990, 2000, 2010)”
|
Data files
|
Time
|
Spatial scale
|
|
Group 1
|
1990
|
County level
|
|
Group 2
|
2000
|
County level
|
|
Group 3
|
2010
|
County level
|
|
Group 4
|
1990
|
City level
|
|
Group 5
|
2000
|
City level
|
|
Group 6
|
2010
|
City level
|
|
Group 7
|
1990, 2000, 2010
|
Province level
|
The “Dataset of cultural diversity index in Southwest China (1990, 2000, and 2010)” consists of the spatial data of CD in Southwest China at the county, city, and province levels and can be divided into seven groups (Table 2). Groups 1–3: Spatial data of CD in Southwest China at the county scale for 1990, 2000, and 2010 in .shp format (a total of 24 documents). Groups 4–6: Spatial data of CD in Southwest China at the city scale for 1990, 2000, and 2010 in .shp format (a total of 24 documents). Group 7: Spatial data of CD in Southwest China at the province scale for 1990, 2000, and 2010 in .shp format (a total of 8 documents).
4.2 Results
The county-level units with low CD were mainly distributed in the northern part of the region, including the northwestern part of the Qinghai-Tibet Plateau and Sichuan basin. In addition, the coastal areas of Guangxi in the southeastern part of the study area formed a contiguous area of low CD. The county-level units with high CD were scattered in the southern part of the study area in the Yunnan-Guizhou Plateau and concentrated in the southwestern part of Yunnan near the frontier as well as the Hengduan Mountains (Figure 2). Overall, the spatial pattern of CD at the county level basically remained stable from 1990 to 2010. Among the county-level units, the largest proportion had CD values of less than 0.2, while the lowest proportion had CD values greater than 1.4, indicating a generally low level of cultural diversity at the county level in Southwest China. Thus, the spatial distribution of ethnic groups on the county scale indicated clustering rather than blending. The city-level units with low CD were mainly distributed in the Qinghai-Tibet Plateau, Sichuan Basin, and the coastal areas of Guangxi, whereas the city-level units with high CD were mostly distributed in Yunnan and Guizhou provinces (Figure 2). Overall, the spatial pattern of CD at the city level remained essentially stable from 1990 to 2010. Among city-level units, the largest proportion had CD values lower than 0.2, followed by 0.5–0.9, 0.9–1.4, 0.2–0.5, and >1.4, indicating an intermediate level of cultural diversity at the city level in Southwest China. This demonstrates that on the city scale, ethnic groups in Southwest China exhibited both clustering and blending.
The province-level units with low CD values were distributed in the northern part of the study area, whereas the units with high CD were located in the southern part (Figure 2). Among the province-level units, none had CD values lower than 0.2, while a high proportion had CD values greater than 0.9, indicating a generally high level of cultural diversity at the province level in Southwest China. Thus, on the province scale, ethnic groups in Southwest China tended to be blended.
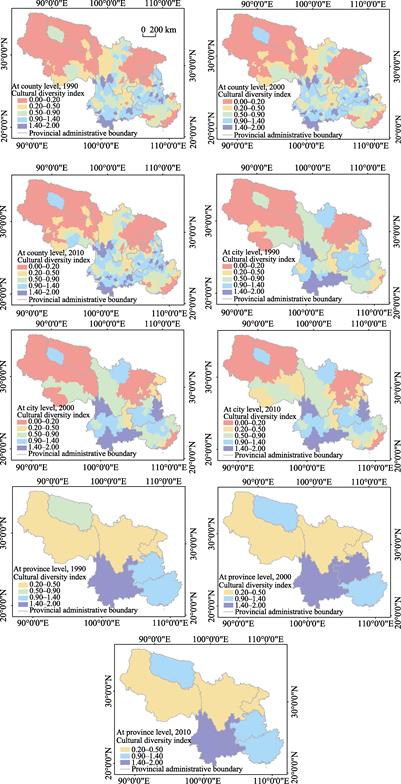
Figure 2 Spatiotemporal distributions of cultural diversity index in Southwest China[14]
4.3 Validation
|
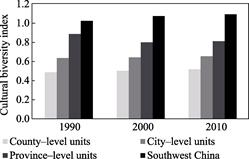
Figure 3 Cultural diversity values in Southwest China at different spatial scales[14]
|
Comparing the CD values in Southwest China at different scales (Figure 3) indicated that CD increased gradually as the spatial scale expanded, quantitatively confirming that different ethnic groups tend to live together at large scales but cluster at small scales in Southwest China[15]. In other words, on a large scale, ethnic groups are blended (“You’re part of me, and I’m part of you”), resulting in a high level of cultural diversity; in contrast, on a small scale, ethnic groups tend to cluster to maintain independent cultural traditions, resulting in a low level of cultural diversity. Moreover, according to statistical analysis based on the u test, the average CD values at the county and city levels were significantly different at the 0.05 level in 1990, 2000, and 2010.
5 Discussion and Conclusion
In past large-scale studies, language was often used as an indicator of cultural diversity because of the readily available language data for quantitative research[17]. However, the use of language as a single indicator to reflect cultural diversity is not a comprehensive approach; to quantify the level of diversity on the national or regional scale; different quantitative indicators have been introduced and combined. For example, Loh and Harmon evaluated cultural diversity in terms of religion, language, and ethnicity and conducted an integrated evaluation of cultural diversity on the country level[18]. In Southwest China, the central government has considered factors such as language, religious beliefs, and historical origins when identifying ethnic classifications. Therefore, it was indicative to apply the ethnic population to measure the cultural diversity levels of the research units.
The analysis of the spatiotemporal patterns of CD in this study indicated that the level of cultural diversity in Southwest China increased over time, reflecting the tendency of ethnic groups to spread over time. The cultural diversity exhibited clear spatial heterogeneity, with lower diversity observed in the northwestern part of the study region and higher diversity observed in the southeastern part. On the whole, the level of cultural diversity at the county level in Southwest China was not high and was affected by various natural, economic, and social factors (e.g., the intensification of climate change, the acceleration of economic globalization, and urbanization)[19]. While, ethnic culture held a simple ecological ethics of respecting nature, which could guarantee the stability and persistence of local ecosystems to a certain extent, and had important value for the conservation of ecological environment and the sustainable use of biological resources[20].
Author Contributions
Deng, H. B. generated the overall design for dataset development and created the model and algorithm; Shen, Y. contributed to the collection of national census data, processed the data, and wrote the data paper; and Shen, M. X. verified the data and revised the paper.
References
[1] Yang, S. M., Ding H. China Ethnography [M]. Beijing: China Minzu University Press, 2003.
[2] Yang, J. C. Ecological culture of the ethnic minorities in the southwestern mountainous areas and its value [J]. Journal of Guizhou University (Social Sciences), 2011, 29(6): 129–133.
[3] Li, J. H. The cultural interpretation of southwest settlement patterns [D]. Chongqing: Chongqing University, 2010.
[4] Meng, Z. Y., Shen, Z. P., Qu, A. X., et al. Review and prospect of cultural diversity [J]. Journal of Huaihai Institute of Technology (Humanities & Social Sciences Edition), 2015, 13(4): 74–81.
[5] Li, X. C. Regional Historical Geography: Geopolitics, Regional Economy and Culture [M]. Beijing: Peking University Press, 2004.
[6] Shen, Y., Deng, H. B. Dataset of cultural diversity index in Southwest China (1990, 2000, 2010) [DB/OL]. Global Change Research Data Publishing & Repository, 2019. DOI:10.3974/geodb.2019.04.02.V1.
[7] GCdataPR Editorial Office. GCdataPR data sharing policy [OL]. DOI:10.3974/dp.policy.2014.05 (Updated 2017).
[8] Demographic Division of National Bureau of Statistics, Economic Division of National Ethnic Affairs Commission. Chinese Ethnic Population Data (Census in 1990) [M]. Beijing: Chinese Statistics Press, 1994.
[9] Demographic and Social Statistics Division of National Bureau of Statistics, Economic Development Division of National Ethnic Affairs Commission. Chinese Ethnic Population Data of Census in 2000 (Vol. II) [M]. Beijing: The Ethnic Publishing House, 2003.
[10] Demographic and Employment Statistics Division of National Bureau of Statistics, Division of National Ethnic Affairs Commission. Chinese Ethnic Population Data of Census in 2010 (Vol. II) [M]. Beijing: The Ethnic Publishing House, 2013.
[11] Wu, J. G. Landscape Ecology: Pattern, Process, Scale and Hierarchy [M]. 2nd edition. Beijing: Higher Education Press, 2007.
[12] Ma, K. P., Liu, C. R., Liu, Y. M. Measurement of biotic community diversity: II β diversity [J]. Chinese Biodiversity, 1995, 3(1): 38–43.
[13] Qu, A. X., Meng, Z. Y. Study on spatial-temporal pattern of cultural diversity and its affected factors in China [J]. Human Geography, 2014, 29(6): 53–59, 124.
[14] Shen, Y., Mao, S. X., Qiu, S., et al. Spatiotemporal pattern of cultural diversity in Southwest China [J]. Acta Ecologica Sinica, 2018, 38(21): 7596–7606.
[15] Li, K. J. The formation and historical evolution of the distribution pattern of Chinese nationalities [J]. Journal of Southwest University for Nationalities (Humanities and Social Science), 2007, 28(9): 26–31.
[16] Liu, S. H., Deng, Y., Hu, Z. Research on classification methods and spatial patterns of the regional types of China’s floating population [J]. Acta Geographica Sinica, 2010, 65(10): 1187–1197.
[17] Mao, S. X., Shen, Y., Deng, H. B. Progress in biocultural diversity research [J]. Acta Ecologica Sinica, 2017, 37(24): 8179–8186.
[18] Loh, J., Harmon, D. A global index of biocultural diversity [J]. Ecological Indicators, 2005, 5(3): 231–241.
[19] Liu, G. H. Formation and evolution mechanism of ecological security pattern in Southwest China [J]. Acta Ecologica Sinica, 2016, 36(22): 7088–7091.
[20] Xue, D. Y., Cheng, G., Chu, X. B. Traditional Culture and Biodiversity Conservation in Ethnic Areas of China [M]. Beijing: China Environmental Science Press, 2009.