ration in
Guanzhong Region of China (2010?C2019)
Wang, S. D.1 Sun, G. F.1 Zhao, X. T.1 Wei, Z.2* Wang, J.3
Lin, R. C.2 Cui, L.2
1. Jinghuiqu Irrigation center of
Shaanxi Province, Sanyuan 713800, China;
2. China Institute of Water Resources
and Hydropower Research, Beijing 100038, China;
3. Aerospace Information Research
Institute, Chinese Academy of Sciences, Beijing 100101, China
Abstract: Reference
evapotranspiration (ET0) is a parameter that has important
agricultural and environmental implications. This study used daily
meteorological data (maximum/minimum atmospheric pressure, maximum/minimum air
temperature, precipitation, solar radiation duration, and maximum wind speed)
recorded at six national meteorological stations in the Guanzhong area (China)
during 2010?C2019, and the Penman?CMonteith model (recommended by the Food and
Agriculture Organization of the United Nations), to calculate daily ET0
for the period 2010?C2019. Additionally, the inverse distance weighting method
was used to obtain the spatial distribution of ET0 for the
same period. Together, these data constitute a dataset (2010?C2019) of
ET0 in the Guanzhong area.
The dataset includes the following: (1) boundary data of the Guanzhong region, (2) site location vector
data, (3) site location information and daily ET0
(2010?C2019), and (4) the spatial distribution
of ET0 (2010?C2019). The dataset is archived
in .shp, .tif, and .xlsx formats and comprises 27 data files with total data size of 65.4 MB.
Keywords: reference evapotranspiration (ET0);
Penman?CMonteith model; Guanzhong area; Shaanxi
DOI: https://doi.org/10.3974/geodp.2021.02.12
CSTR: https://cstr.escience.org.cn/CSTR:20146.14.2021.02.12
Dataset Availability Statement:
The
dataset supporting this paper is published and accessible through the Digital Journal of Global Change Data
Repository at: https://doi.org/10.3974/geodp.2021.03.07.V1 or
https://cstr.escience.org.cn/CSTR:20146.11.2021.03.07.V1.
1 Introduction
Reference evapotranspiration (ET0),
which is an important factor in relation to irrigation requirement calculations
and water resource evaluation, forms the basis of water law formulation and
water environment assessment[1,2]. Typically, ET0
is affected by climatic conditions and reflects the impact of atmospheric
evapotranspiration in different periods and regions on crop water requirements,
and has nothing to do with soil type or crop type[3]. More than 50
methods have been proposed for ET0 calculation, e.g., the
models of Makkink[4], Hargreaves[5], and Irmark[6],
and the Food and Agriculture Organization of the United Nations Penman?CMonteith
(FAO 56 P?CM) model[7?C9]. The latter is the standard ET0
calculation model and it is used widely in the field. It integrates radiation
and aerodynamic terms, and reliable calculation results can be obtained in
areas with large differences in climatic conditions. Moreover, no parameter
adjustment is required during its application[10].
The Guanzhong area (China) refers
to the administrative districts of five cities: Xi??an, Tongchuan, Baoji,
Xianyang, and Weinan in central Shaanxi Province. The area (33??35??N?C 35??52??N,
106??18??E?C110??38??E) is narrow from north to south and long from east to west.
The Guanzhong area is recognized as the region in which agriculture originated,
and it has been a rich agricultural area since ancient times. It has excellent
irrigation conditions, fertile soil, and
high agricultural production potential. This study used meteorological
data recorded at six national meteorological stations located in the Guanzhong
area: Yangling, Sanyuan, Bin county, Baoji city, Baoji county, and Changwu. The
meteorological data (maximum/minimum atmospheric pressure, maximum/minimum air
temperature, precipitation, solar radiation duration, and maximum wind speed) were obtained from the
China Meteorological Data Network.
Using the obtained meteorological data, a 10-year ET0 dataset
(2010?C2019) was constructed for the Guanzhong area. This dataset provides a
solid foundation for both the planning and design of water conservancy projects in Guanzhong region and the study of agricultural water-saving measures.
2 Metadata of the Dataset
The metadata of the Dataset
of reference crop evapotranspiration in Guanzhong area of China (2010?C2019)[11]
is summarized in Table 1.
Table 1 Metadata summary of the Dataset of
reference crop evapotranspiration in Guanzhong area of China (2010?C2019)
|
Items
|
Description
|
|
Dataset full name
|
Dataset of reference crop evapotranspiration in guanzhong
area of china (2010?C2019)
|
|
Dataset short name
|
ET0_Guanzhong_2010-2019
|
|
Authors
|
Wang, S. D., Shaanxi Jinghui Canal Irrigation Administration,
807860882@qq.com
Sun, G. F., Shaanxi Jinghui Canal Irrigation Administration, 864964464@qq.com
Wei, Z., China Institute of Water Resources and Hydropower
Research, weizheng@iwhr.com
Wang, J., Aerospace Information Research Institute, Chinese
Academy of Sciences, wangjin@aircas.ac.cn
Lin, R. C., China Institute of Water Resources and Hydropower
Research, 190453501@qq.com
Cui, L., China Institute of Water Resources and Hydropower Research,
20833192@qq.com
|
|
Geographical region
|
Guanzhong area
|
Year
|
2010?C2019
|
Temporal resolution
|
1 d
|
|
Data format
|
.xlsx; .tif; .shp
|
Data size
|
6.68 MB after compression
|
|
Data files
|
The data of Guanzhong region; the data of site location; the
information of site location and daily ET0 from 2010 to
2019; the spatial distribution of ET0 from 2010 to 2019
|
|
Foundation
|
Ministry of Science and Technology of P. R. China (2017YFC0403202)
|
|
Computing environment
|
Microsoft Excel 2019; ArcGIS10.4
|
|
Data publisher
|
Global Change Research Data Publishing & Repository,
http://www.geodoi.ac.cn
|
|
Address
|
No. 11A, Datun Road, Chaoyang District, Beijing 100101, China
|
|
Data sharing policy
|
Data from
the Global Change Research Data Publishing & Repository includes metadata, datasets
(in the Digital Journal of Global Change Data Repository), and
publications (in the Journal of Global Change Data & Discovery). Data sharing policy
includes: (1) Data are openly available and can be free downloaded via the
Internet; (2) End users are encouraged to use Data subject to
citation; (3) Users, who are by definition also value-added service
providers, are welcome to redistribute Data subject to written permission
from the GCdataPR Editorial Office and the issuance of a Data redistribution
license; and (4) If Data are used to compile new
datasets, the ??ten per cent principal?? should be followed such that Data
records utilized should not surpass 10% of the new dataset contents, while
sources should be clearly noted in suitable places in the new dataset[12]
|
|
Communication and searchable
system
|
DOI, CSTR, Crossref, DCI, CSCD,
CNKI, SciEngine, WDS/ISC, GEOSS
|
3 Methods
3.1 Calculation Principle
Six national meteorological
stations (Yangling, Sanyuan, Bin county, Baoji city, Baoji county, and Changwu)
located in the Guanzhong area were selected for this study. Based on the daily
meteorological data (maximum/minimum atmospheric pressure, maximum/minimum air
temperature, precipitation, solar radiation duration, and maximum wind speed)
recorded at the stations during 2010?C2019, daily ET0 at each
site was calculated using the method recommended by the FAO[13]:
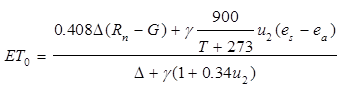 (1)
(1)
where ET0 is the daily reference
crop evapotranspiration (mm/d), Rn
is net
radiation at the crop surface (MJ/m2/d), G refers to the heat stored in the soil (MJ/m2/d), g is the psychrometric coefficient (kPa/??C), u2 is the wind speed at 2 m
height (m/s), ea
is the
partial pressure of water (kPa/??C),
es is the water vapor saturation pressure (kPa/??C), and D is the slope of the water vapor saturation pressure curve (kPa/??C).
3.2 Inverse Distance Weighting
Inverse distance weighting is a
weighted average interpolation method, which assumes that each observation has
local influence, and this influence decreases with distances[14].
The calculation formula can be expressed as follows:
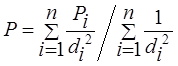 (2)
(2)
where P is the estimated value, Pi is the calculated value
at point i, di
is the distance between the point to be estimated and the point i, and n
is the number of national meteorological stations used.
4 Data Results
4.1 Data products
Details regarding the files
containing the Guanzhong region data, site location data, daily site ET0
data (2010?C2019), and annual ET0 spatial distribution data
(2010?C2019) are listed in Table 2.
Table 2 Details regarding the files
of the reference evapotranspiration (ET0) dataset for the Guanzhong
area
|
Data
|
Data format
|
Data content
|
Data size
|
|
The
information of site location and daily ET0 from 2010 to
2019
|
.xlsx
|
ET0 data
|
373 KB
|
|
The
spatial distribution of ET0 from 2010 to 2019
|
.tif
|
ET0 data
|
65 MB
|
|
The
data of Guanzhong region
|
.shp
|
shape file
|
41.4 KB
|
|
The
data of site location
|
.shp
|
Shape file
|
4.65 KB
|
4.2 Data Results
It can be seen from Figure 1 that ET0 at
each of the six sites in the Guanzhong area during 2010?C2019 exhibits a highly
consistent pattern with an annual trend of increase and then decrease with a
peak in July. During May?CAugust, ET0 is high because of
the high surface temperatures, active plant transpiration, and enhanced soil
evaporation capacity. The minimum ET0 values are in January
with a range of 0.48?C1.85 mm/d. There is little
difference in ET0 among the six stations in the Guanzhong
area, indicating that the climatic conditions are broadly similar throughout
the Guanzhong area. Therefore, it is not necessary to consider the influence or
deviation caused by climatic conditions when conducting various scientific
research related to regional agriculture and water conservancy.
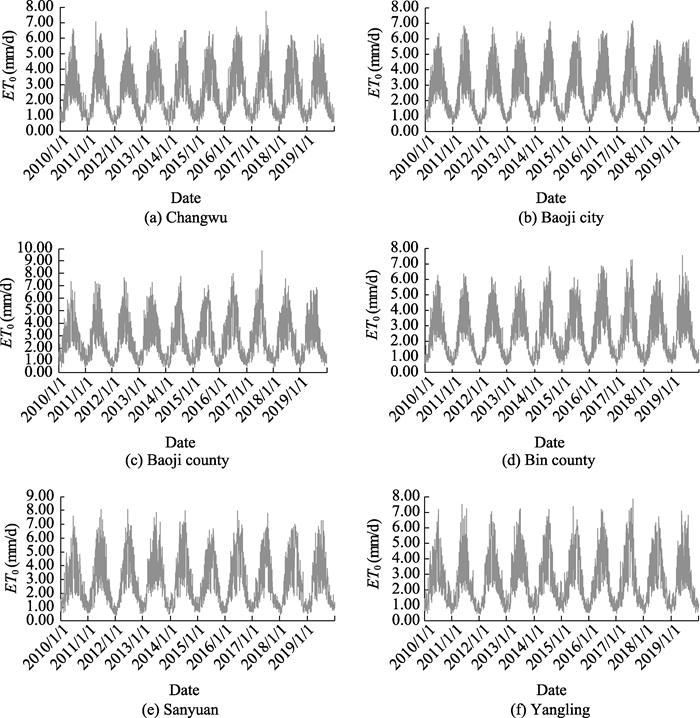
Figure
1 Variation of ET0 at
each of the six studied stations in the Guanzhong area during 2010?C2019
Daily meteorological
data recorded in the Guanzhong area were used in combination with the P?CM model
to calculate daily ET0, and then the inverse distance
weighting method in ArcGIS 10.4 was used to produce maps of the spatial
distribution of annual ET0 in the Guanzhong area. The spatial
distribution of annual ET0 in selected years (i.e., 2010,
2013, 2016, 2019) is illustrated in Figure 2. It can be seen that the
characteristics of the distribution in different years show certain
similarities, i.e., reduction from the northeast toward the southwest. This
pattern is closely related to the topography of the Guanzhong area and the
regional distribution of agriculture. The topography of the Guanzhong area
generally presents the characteristics of being low in the middle, higher on
all sides, and higher in the west than in the east. Regionally, agriculture is
concentrated mainly in the middle of the Guanzhong area. Furthermore, the
spatial distribution of ET0 has large variability with a
range of 800?C1,198 mm.

Figure
2 Spatial distribution of annual ET0
in certain years in the Guanzhong area
5 Discussion and Conclusions
Six typical meteorological
stations in the Guanzhong area were selected to calculate daily ET0
for the period 2010?C2019, in accordance with the FAO-recommended method. The results revealed that ET0
at each of the studied sites had a highly consistent pattern, i.e., an annual
trend of increase and then decrease with a peak in July. Evapotranspiration
remained at 2.01?C7.38 mm/d during May?CAugust and evaporation capacity was
strong. Evapotranspiration was reduced to its minimum (0.48?C1.85 mm/d) in
January. There was little difference in ET0 among the six studied
stations in the Guanzhong area, indicating that the climatic conditions are
broadly similar across the region.
The characteristics of the spatial distribution of annual ET0
in the Guanzhong area showed certain similarities, i.e., a pattern of decrease
from the northeast toward the southwest. Furthermore, the spatial distribution
of ET0 presented marked variability with a large variational
range (minimum: 800 mm, maximum: 1,198 mm).
The Guanzhong area is a rich agricultural region in China,
which has excellent irrigation conditions, fertile soil texture, and high
agricultural production potential, and where ET0 is closely related to crop water demand. The
Guanzhong area extends over 5.58 ?? 104 km2, and accounts for 27%
of the total area of Shaanxi province[15]. Nevertheless, the dataset
produced in this study reflects atmospheric evapotranspiration within the
administrative divisions of the
Guanzhong area, and represents a solid foundation for both the planning and
design of regional water conservancy projects and the study of agricultural
water-saving measures. The results could provide a reference for improving the
understanding of the effects of climate change in the region in terms of
regional water resources management, agricultural development, and ecological
environment protection. In future research, the influence of climate change or
of different climatic zones and human activities on the spatiotemporal
distribution of ET0 could be considered.
Author Contributions
Wang,
S. D. produced the overall design for the development of the dataset; Sun, G. F.
and Zhao, X. T. collected and processed the meteorological data of the six
stations in the Guanzhong area. Wei, Z. and Wang, J. designed the statistical
algorithm of the model. Lin, R. C. and Cui, L. wrote the data paper.
Conflicts
of Interest
The authors declare no
conflicts of interest.
References
[1]
Su, X. L.,
Song, Y., Niu, J. P., et al. Sensitivity and causes of variation of
potential evapotranspiration in Jinghuiqu irrigated area [J]. Journal of
Natural Resources, 2015, 30(1): 115?C123.
[2]
Li, D. C.,
Zhang, X., Chang, H. H., et al. Analysis of water requirement of
reference crops in Yulin under the background of climate change [J]. Journal
of Irrigation and Drainage, 2019, 38(5): 100?C106.
[3]
Zeng, L.
H., Song, K. S., Zhang, B., et al. Spatiotemporal variation of reference
evapotranspiration in Northeast China in recent 60 years [J]. Advances in
Water Science, 2010, 21(2): 194?C200.
[4]
Makkink, G.
F. Testing the Penman formula by means of lysimeters [J]. Journal of the
Institution of Water and Environment Management, 1957, 11: 277?C288.
[5]
Droogers,
P., Allen, R. G. Estimating reference evapotranspiration under inaccurate data
conditions [J]. Irrigation and Drainage Systems, 2002, 16(1): 33?C45.
[6]
Irmak, S.,
Mutiibwa, D., Payero, J., et al. Modeling soybean canopy resistance from
micrometeorological and plant variables for estimating evapotranspiration using
one-step Penman-Monteith approach [J]. Journal of Hydrology, 2013, 507: 1?C18.
[7]
Zhang, Q.,
Duan, A. W., Wang, G. S., et al. Research on medium and short term
forecasting model of reference crop evapotranspiration based on weather
forecast [J]. Transactions of the Chinese Society for Agricultural Machinery,
2015, 46(5): 107?C114.
[8]
Cunha, A. C.,
Filho, L. R. A. G., Tanaka, A. A., et al. Influence of the estimated
global solar radiation on the reference evapotranspirition obtained through the
Penman-Monteith FAO 56 method [J]. Agricultural Water Management, 2021,
243: 106491.
[9]
Yan, H. F.,
Yu, J. J., Wang, G. Q., et al. Comparison of two canopy resistance
models to estimate evapotranspiration for tea and wheat in southeast China [J].
Agricultural Water Management, 2021, 245: 106581.
[10] Zhou, Y., Zhang, X., Xu, J. Variation of
reference crop evapotranspiration and its sensitivity to meteorological factors
in the eastern agricultural region of Qinghai province [J]. Journal of
Natural Resources, 2013, 28(5): 765?C775.
[11] Wang, S. D., Sun, G. F., Wei, Z., et al.
The dataset of reference evapotranspiration in Guanzhong area (2010-2019) [J/DB/OL]. Digital
Journal of Global Change Data Repository, 2021. https://doi.org/
10.3974/geodb.2021.03.07.V1.
https://cstr.escience.org.cn/CSTR:20146.11.2021.03.07.V1.
[12] GCdataPR Editorial Office. GCdataPR data sharing
policy [OL]. https://doi.org/10.3974/dp.policy.2014.05 (Updated 2017).
[13] Allen, R. G., Pereira, L. S., Raes, D., et al.
Crop Evapotranspiration-Guidelines for Computing Crop Water Requirements-FAO
Irrigation and Drainage Paper 56 [M]. Rome:
FAO, 1998.
[14] Zheng, J., Ma, J., Wang, Y., et al.
Temporal and spatial distribution characteristics of reference crop
evapotranspiration in Gansu province based on climate divisions [J]. Journal
of Water Resources and Water Engineering, 2020, 31(1): 240?C247.
[15] Shen, J., Remote Sensing Identification and
dynamic monitoring of crop planting information in Guanzhong region [D]. Yangling:
Northwest A & F University,
2017.