Spatio-temporal Analysis of Forestation Area Changes
in China (1991‒2014)
Liu, S. S.1,2 Huang, X. Y.1,2 Peng, Z. W1,2 Lin, W. K.1,2 Zhao, S.1,2 Wu, Y. F.1,2 Chen, Y. L.1,2* Xue, X. H.1,2 Wang, C. G.1,2
1. National Demonstration Center for Experimental Geography
Education, Fujian Normal University, Fuzhou 350007, China;
2. School of Geographical Sciences, Fujian Normal
University, Fuzhou 350007, China
Abstract: Plantation forest is an important part of forest resources and
plays an important role in the sustainable development of China. The plantation
forest in China has increased rapidly in last four decades. The area of plantation
forests has ranked first in the world with a long time. In order to understand
the ecological and economic impact of the forestation
area, it is necessary to collect detailed yearly afforestation
data. The process and
results of the Regional-yearly forestation dataset of
China (1991-2014) are introduced in this paper. The
dataset includes total area of afforestation, shelterbelt afforested area,
economic forest afforested area, firewood forest afforested area, timber forest
afforested area and special use forest afforested area in China from 1991 to
2014. The dataset is achieved in .xlsx data format with the data size of 32.2
KB.
Keywords: Forestation area;
regional; yearly; China; 1991-2014
Dataset Availability Statement:
The dataset supporting this paper was published and is accessible
through the Digital
Journal of Global Change Data Repository at:
https://doi.org/10.3974/geodb.2020.09.19.V1.
1 Introduction
Forest carbon sink is an
important part of the global carbon cycle. Forest has dual properties of carbon
source and carbon sink. It can convert CO2 into organic matter by photosynthesis.
However, forest destruction will release carbon from forest ecosystem to
atmosphere[1]. Afforestation data is an important basic data to
study the change of forest carbon storage. Fang et al. investigated the
carbon storage of forest biomass in China from 1949 to 1998[2]. The
research showed that the increased forestation area and forest regeneration
were the main driver of the increase of carbon storage in China[2].
Besides, forest has a profound impact
on soil water reservoirs,
river hydrology, and the water cycle associated with the ocean
although
forest water storage accounts for a small proportion of global water storage,
and its transpiration connects water flux from soil to atmosphere[3].
Moreover, plantation forest plays a huge ecological function in soil and water
conservation, wind and sand fixation, climate regulation, and maintaining
biodiversity. The yearly forestation area data reflects the changes of forestry
structure in China and can be used for studies such as regional carbon budget
and water consumption.
2 Metadata of the Dataset
The metadata of the
Regional-yearly forestation dataset of China (1991-2014)[4] is summarized in Table 1. It includes full name,
short name, authors, year of the dataset, data format, data size, data files,
data publisher, and data sharing policy, etc.
Table
1 Metadata summary of the
Regional-yearly forestation dataset of China (1991-2014)
|
Items
|
Description
|
|
Dataset full name
|
Regional-yearly
forestation dataset of China (1991‒2014)
|
|
Dataset short
name
|
RegionalForestationChina_1991‒2014
|
|
Authors
|
Liu, S. S. AAT-3465-2020, School of Geographical Sciences, Fujian
Normal University,
xinqingweiyu@163.com
Huang, X. Y., School of Geographical Sciences, Fujian Normal University,
hxy1050250101@163.com
|
|
|
Peng, Z. W., School of Geographical Sciences, Fujian Normal
University, 13420173263@163.com
Lin,
W. K. AAT-3956-2020, School of Geographical Sciences, Fujian Normal
University, wenkelin0210@gmail.com
Zhao,
S. AAT-3964-2020, School of Geographical Sciences, Fujian Normal University??ygwork123@163.com
Wu,
Y. F., School of Geographical Sciences, Fujian Normal University,
yfwu111@163.com
Chen, Y. L. AAP-3042-2020, School of Geographical Sciences, Fujian
Normal University, chenyl@fjnu.edu.cn
|
|
|
Xue,
X. H., School of Geographical Sciences, Fujian Normal University,
610262806@qq.com
|
|
|
Wang,
C. G., School of Geographical Sciences, Fujian Normal University,
786194687@qq.com
|
|
Geographical region
|
China
|
|
Year
|
1991‒2014
|
|
Data format
|
.xlsx
|
|
|
|
Data size
|
32.2 KB
|
|
|
|
Data files
|
One form file
with six worksheets, consisting of total afforested area and shelterbelt, economic
forest, firewood forest, timber forest, special use forest afforested area
data.
|
|
Foundation(s)
|
National Natural
Science Foundation of China (41901124)
|
|
Data publisher
|
Global Change Research Data Publishing & Repository,
http://www.geodoi.ac.cn
|
|
Address
|
No. 11A, Datun
Road, Chaoyang District, Beijing 100101, China
|
|
Data sharing policy
|
Data from the Global
Change Research Data Publishing & Repository includes metadata, datasets (in the Digital Journal of Global Change Data Repository), and
publications (in the Journal of Global Change Data & Discovery). Data sharing policy includes: (1) Data
are openly available and can be free downloaded via the Internet; (2) End
users are encouraged to use Data subject to citation; (3)
Users, who are by definition also value-added service providers, are welcome
to redistribute Data subject to written permission from the GCdataPR Editorial
Office and the issuance of a Data redistribution license; and (4)
If Data
are used to compile new datasets, the ??ten per cent principal?? should be
followed such that Data records utilized should not
surpass 10% of the new dataset contents, while sources should be clearly
noted in suitable places in the new dataset[5]
|
|
Communication and
searchable system
|
DOI, DCI, CSCD, WDS/ISC, GEOSS, China GEOSS, Crossref
|
3 Processes and
Methods of Dataset Development
The
process of dataset development was divided into two steps. Firstly, the
forestation area data was collected according to the five categories of
forestation, including shelterbelt, economic forest, firewood forest, timber
forest and special use forest. Secondly, the forestation area data was carried
out by the zonal statistics.
The regional-yearly forestation dataset of China (1991-2014) was developed based on
the data collection from 24 years records of the China Forestry Yearbook[6?C12] and China Forestry Statistical Yearbook[13?C29]. No data available from Hong Kong, Macao and Taiwan.
After collecting the forestation data, zonal
statistics were carried out by the six regions. North China covers the area of Beijing, Tianjin, Hebei,
Shanxi, and Inner Mongolia; Northeast China covers the area of Liaoning, Jilin,
and Heilongjiang; East China covers the area of Shanghai, Jiangsu, Zhejiang,
Anhui, Fujian, Jiangxi, Shandong; South Central China covers the area of Henan,
Hubei, Hunan, Guangdong, Guangxi, Hainan; Southwest China covers the area of
Chongqing, Sichuan, Guizhou, Yunnan, and Tibet and Northwest China covers the
area of Shaanxi, Gansu, Qinghai, Ningxia and Xinjiang.
4 Results
4.1 Data File
The
regional-yearly forestation dataset of China (1991-2014) consists of a .xlsx file with six worksheets. The dataset
includes: (1) Total area of afforestation in China (Tab.1); (2) Shelterbelt
afforested area in China (Tab.2); (3) Economic forest afforested area in China
(Tab.3); (4) Firewood forest afforested area in China (Tab.4); (5) Timber
forest afforested area in China (Tab.5); (6) Special use forest afforested area
in China (Tab.6).
4.2 Data Results Analysis
The
trend line analysis method is used to evaluate the general trend of forestation
area and the trend of area of different afforested categories at the national
and regional scales. Meanwhile, the forestation area at the national and
regional scales is compared and analyzed to evaluate the overall quantity of
forestation area in China. Furthermore, the area of different afforested
categories is compared between regions and within regions to evaluate the
structural differences of forestation area in each region.
The time series
forestation area was fitted with a linear model to evaluate the change trend of
forestation area in the whole country, each region and each afforested category
respectively. Results are showed in Table 2. The total forestation area
increased steadily from 1991 to 2014 at national scale, showing an increasing
trend of 2.443 km2 per year. The shelterbelt afforested area showed
an increasing trend of 1,282.8 km2 per year and the special use
forest afforested area showed an increasing trend of 4.63 km2 per
year, while the timber forest, economic forest and firewood forest afforested
area showed a decreasing trend of 938.83 km2, 245.82 km2
and 100.32 km2 per year respectively.
At the regional
scale, the total forestation area of Northwest China, Southwest China and North
China showed an increasing trend from 1991 to 2014, with an annual increase of
196.18 km2, 109.93 km2 and 91.007 km2
respectively, while the total forestation area of South Central China, East
China and Northeast China showed a decreasing trend, with an annual decrease of
181.75 km2, 123.22 km2 and 89.654 km2
respectively. Among them, the shelterbelt afforested area in each region showed
an increasing trend, which played a major role in the increase of forestation
area in each region. The economic forest afforested area showed a decreasing
trend except for Southwest China, and it also played an important role in the
increase of total forestation area in Southwest China. The special use forest
afforested area showed an increasing trend except for Northeast China and
compared with other afforested categories, the trend of annual increase or
decrease is not significant.
Table
2 Annual change rate of different afforested categories (km2/year)
|
Region
Type
|
China
|
Northwest China
|
Northeast China
|
North
China
|
Southwest China
|
South Central China
|
East
China
|
|
Total area
|
2.443
|
196.18
|
‒89.654
|
91.007
|
109.93
|
‒181.75
|
‒123.22
|
|
Shelterbelt
|
1,282.8
|
320.09
|
105.97
|
370.6
|
195.22
|
213.15
|
77.795
|
|
Economic forest
|
‒245.82
|
‒14.895
|
‒36.967
|
‒115.79
|
117.85
|
‒108.6
|
‒87.42
|
|
Firewood forest
|
‒100.32
|
‒23.169
|
‒19.706
|
‒6.634
|
‒9.36
|
‒15.238
|
‒26.217
|
|
Timber forest
|
‒938.83
|
‒87.756
|
‒136.64
|
‒157.66
|
‒194.26
|
‒272.76
|
‒89.737
|
|
Special use forest
|
4.63
|
1.912
|
‒2.307
|
0.493
|
0.484
|
1.694
|
2.355
|
Figure 1 shows the comparison of total forestation area of the whole country and each region.
At national scale, the total forestation area fluctuated slightly from 1991 to
2001 and 2007 to 2014, but it was basically stable, which the annual total
forestation area remained about 50,000 km2. From 2002 to 2006, the
total forestation area showed a rapid rise and then a sudden decline. At regional
scale, from 1991 to 1994, the proportion of afforestation in South Central
China was the largest, with an average of 29.21%; the proportion of afforestation
in North China was the largest during the period from 1995 to 2002, 2004 to
2007 and 2012 to 2014, with an average of 26.73%; the proportion of
afforestation in Northwest China was the largest in 2003, with a number of
22.87%, but there was no significant difference compared with that in North
China of which the proportion was 22.24%; From 2008
to 2011, the largest proportion of afforestation was in Southwest China, with
an average of 25.73%, which accounted for 27.62% in 2008, 25.71% in 2009,
22.84% in 2011. There was no significant difference between Southwest China and
North China, which accounted for 26.01%,
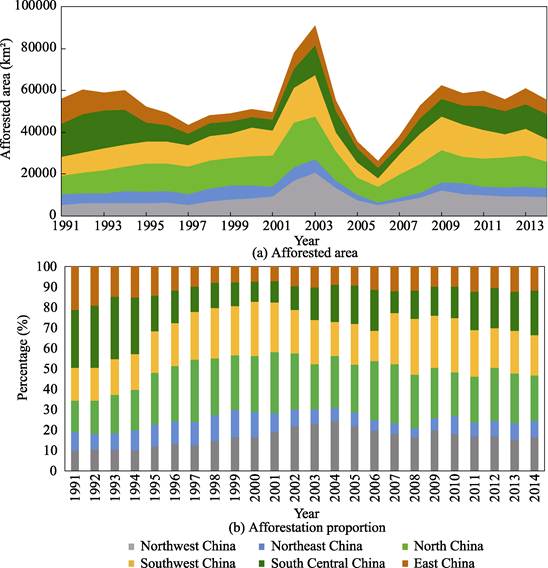
Figure 1 Statistical chart of total forestation area in China
24.51%
and 22.52% respectively. Therefore, North China is the main area of afforestation
in China. The proportion of afforestation in Northeast China was the smallest
from 1991 to 1996 and from 2002 to 2014, with an average of 7.60%; the
proportion of afforestation in East China was the smallest from 1997 to 2001,
with an average of 8.05%. The small proportion of afforestation in these two
regions is most likely due to the abundance of existing forest resources
compared with other regions.
Figure 2 shows
comparison of the areal trend of different afforested categories in each region.
From 1991 to 2014, the shelterbelt afforested area in all the regions showed a
highly consistent trend. Besides, it reached the peak in 2003 for all the
regions. The economic forest afforested area in each region showed two bell
trend from 1991 to 2014, implying that the economic forest afforestation policy
was transiting from quantity priority to quality priority; the firewood forest
afforested area in each region decreased and then tended to be flat in general,
which may be derived by the development and utilization of fossil fuels,
electric energy and other energy sources; the timber forest afforested area in
Northwest China, Northeast China and North China gradually decreased and then
tended to be flat, while that in East China, South Central China and Southwest
China showed a fluctuating upward trend, which may be due to the priority of
planting fast-growing tree species in timber forest. Besides, the natural
conditions such as water and heat in these regions are superior to that of the
other three regions. The special use forest afforested area showed a fluctuating
growth trend in all the regions except Northeast China.
Figure 3 shows comparison of the area of
different afforested categories. The shelterbelt afforested area was a largest
part of the total forestation area in each region and the proportion of special
use forest afforest area was the smallest from 1991 to 2014. After 2000, the
proportion of firewood forest, economic forest and timber forest afforested
area decreased
significantly
compared with that before 2000, which reflected the policy transition of timber
usage to ecological protection. In Southwest China, the annual forestation area
of economic forest increased significantly after 2006, which was much larger
than that of timber forest. The average annual economic forest afforested area
from 2006 to 2014 was about 2.5 times of the area of timber forest. This is
because of the superior water and heat conditions in Yunnan and the full
development of forest products. In East China, the economic forest afforested
area of was larger than that of timber forest from 1993 to 2002. From 2003 to
2014, the timber forest afforested area exceeded that of economic forest. From
2002 to 2014, the shelterbelt afforested area gradually increased. The average
annual shelterbelt afforested area was 2.7 times that of economic forest and
1.5 times that of timber forest. In South Central China, the annual forestation
area of shelterbelt exceeded that of timber forests except 2006 and 2007 and it
ranked the first place in the total forestation area of the region from 2001 to
2014. The afforestation structure of East China and South Central China
gradually shifted to the shelterbelt.
Table 3 shows the
conversion ratio of forestation area and change of forest coverage rate from
fifth forest resources inventory to the eighth forest resources inventory in
China[30?C33]. About 30% of the
national forestation area has been transferred to the plantation area, and the cumulative net increased plantation area has
increased the national forest coverage by 3.43%, accounting for 52.71%
of the net increased national forest coverage in the inventory period.
Artificial afforestation plays an important role in improving the national
forest coverage.
5 Discussion
and Conclusion
Forest
plays an import role in ecological function, such as regulating water, fixed
soil, retaining fertilizer, fixed carbon, releasing oxygen, producing anion,
absorbing pollution gases and dust-retention and so on[34]. Forest
functional diversity and its importance in material circulation and ecosystem
objectively determine the necessity and importance of forest management. In the
most recent years, China actively promotes the construction of forestry
ecological engineering, which has an impact in protecting forest resources,
developing forest resources and building a green China. China??s forest coverage
has increased from the initial 12.7% to 22.96%. Based on the results of the
fourth to eighth forest resources inventory data, about 30% of the national
forestation area has been transferred to the plantation area on average, and
the contribution rate of the net increase of plantation area to the improvement
of forest coverage rate has exceeded 50%. Artificial afforestation has a huge
ecological effect. The yearly forestation area of different categories and
regions provide basic data for researching carbon and water cycles in different
regions[35].
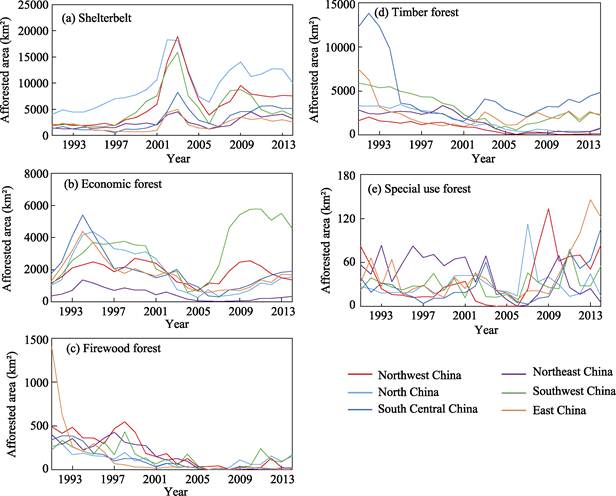
Figure 2 Annual area changes of different afforested categories
in China

Figure 3 Annual area composition of different afforested
categories in six regions of China
Table
3 Conversion ratio of forestation area and changes of forest coverage rate
|
Categories
Inventory
period
|
Plantation coverage (%)
|
Net increase of plantation area (km2)
|
Forestation area during the period (km2)
|
Proportion of forestation area transferred
to net increased plantation area during the period (%)
|
Net increase in forest area (km2)
|
Net increased forest coverage (%)
|
Forest coverage rate of net increased
plantation area (%)
|
Proportion of increased forest coverage in
net increased forest coverage (%)
|
|
The Fifth
(1994‒1998)
|
4.86
|
102,520
|
252,932.6
|
40.53
|
137,030
|
1.43
|
1.07
|
74.82
|
|
The Sixth
(1999‒2003)
|
5.54
|
65,924
|
318,222.94
|
20.72
|
159,683
|
1.66
|
0.69
|
41.28
|
|
The Seventh
(2004‒2008)
|
6.43
|
84,311
|
207,707.29
|
40.59
|
205,430
|
2.15
|
0.88
|
41.04
|
|
The Eighth
(2009‒2013)
|
7.22
|
76,416
|
297,400.43
|
25.69
|
122,300
|
1.27
|
0.79
|
62.48
|
From 1991 to 2014,
the forestation area in the North showed an increasing trend, while it showed
the opposite in the South. Overall, North China was the main afforestation
region in China. The shelterbelt forestation contributes mostly for the
increase of forestation area both in the whole country and in each region.
Due to a long span
of statistical data, the change of statistic caliber may bring errors. For
example, the statistic caliber of forestation area in 1991 was in Mu, while it
changed to hectare since 1992. Besides, Chongqing was separated from Sichuan
since 1997, and the statistical yearbook changed accordingly.
Author
Contributions
Chen, Y. L. and Liu, S. S. designed the dataset.
Liu, S. S., Peng, Z. W., Lin, W. K., Zhao, S. Wu, Y. F., Xue, X. H., Wang, C. G.
collected and processed the dataset. Liu, S. S. and Huang, X. Y. wrote the data
paper.
Conflicts of
Interest
The authors
declare no conflicts of interest.
References
[1]
Zhou, J. F., Guan, D. S. Change in the use of forest land and its
impact on the carbon cycling [J]. Ecology
and Environmental Sciences,
2004(4): 674‒676.
[2]
Fang, J. Y., Chen, A. P., Peng, C. H., et a1. Changes in
forest biomass carbon storage in china between 1949 and 1998 [J]. Science, 2001, 292: 2320‒2322.
[3]
Jiang, Y. X. Review on the structure and function of forest
ecosystem in the world [J]. Forest Research, 1995(3): 314‒320.
[4]
Liu, S. S., Huang, X. Y., Peng, Z. W., et al. Regional-yearly forestation dataset of China (1991-2014) [J/DB/OL]. Digital Journal of Global Change Data Repository, 2020(7): 19. https://doi.org/
10.3974/geodb.2020.09.19.V1.
[5]
GCdataPR Editorial Office. GCdataPR Data Sharing Policy [OL]. https://doi.org/10.3974/dp.policy.2014.05
(Updated 2017).
[6]
Editorial Committee of China Forestry Yearbook. China Forestry
Yearbook 1991 [M]. Beijing: China Forestry Publishing House, 1992.
[7]
Editorial Committee of China Forestry Yearbook. China Forestry
Yearbook 1992 [M]. Beijing: China Forestry Publishing House, 1993.
[8]
Ministry of Forestry of the P. R. China. China Forestry Yearbook
1993 [M]. Beijing: China Forestry Publishing House, 1994.
[9]
Ministry of Forestry of the P. R. China. China Forestry Yearbook
1994 [M]. Beijing: China Forestry Publishing House, 1995.
[10]
Ministry of Forestry of the P. R. China. China Forestry Yearbook
1995 [M]. Beijing: China Forestry Publishing House, 1996.
[11]
Ministry of Forestry of the P. R. China. China Forestry Yearbook
1996 [M]. Beijing: China Forestry Publishing House, 1997.
[12]
Ministry of Forestry of the P. R. China. China Forestry Yearbook
1997 [M]. Beijing: China Forestry Publishing House, 1998.
[13]
State Forestry Administration. China Forestry Statistical Yearbook
1998 [M]. Beijing: China Forestry Publishing House, 1999.
[14]
State Forestry Administration. China Forestry Statistical Yearbook
1999 [M]. Beijing: China Forestry Publishing House, 2000.
[15]
State Forestry Administration. China Forestry Statistical Yearbook
2000 [M]. Beijing: China Forestry Publishing House, 2001.
[16]
State Forestry Administration. China Forestry Statistical Yearbook
2001 [M]. Beijing: China Forestry Publishing House, 2002.
[17]
State Forestry Administration. China Forestry Statistical Yearbook
2002 [M]. Beijing: China Forestry Publishing House, 2003.
[18]
State Forestry Administration. China Forestry Statistical Yearbook
2003 [M]. Beijing: China Forestry Publishing House, 2004.
[19]
State Forestry Administration. China Forestry Statistical Yearbook
2004 [M]. Beijing: China Forestry Publishing House, 2005.
[20]
State Forestry Administration. China Forestry Statistical Yearbook
2005 [M]. Beijing: China Forestry Publishing House, 2006.
[21]
State Forestry Administration. China Forestry Statistical Yearbook
2006 [M]. Beijing: China Forestry Publishing House, 2007.
[22]
State Forestry Administration. China Forestry Statistical Yearbook
2007 [M]. Beijing: China Forestry Publishing House, 2008.
[23]
State Forestry Administration. China Forestry Statistical Yearbook
2008 [M]. Beijing: China Forestry Publishing House, 2009.
[24]
State Forestry Administration. China Forestry Statistical Yearbook
2009 [M]. Beijing: China Forestry Publishing House, 20010.
[25]
State Forestry Administration. China Forestry Statistical Yearbook
2010 [M]. Beijing: China Forestry Publishing House, 2011.
[26]
State Forestry Administration. China Forestry Statistical Yearbook
2011 [M]. Beijing: China Forestry Publishing House, 2012.
[27]
State Forestry Administration. China Forestry Statistical Yearbook
2012 [M]. Beijing: China Forestry Publishing House, 2013.
[28]
State Forestry Administration. China Forestry Statistical Yearbook
2013 [M]. Beijing: China Forestry Publishing House, 2014.
[29]
State Forestry Administration. China Forestry Statistical Yearbook
2014 [M]. Beijing: China Forestry Publishing House, 2015.
[30]
State Forestry Administration. China Forestry Yearbook 2001 [M].
Beijing: China Forestry Publishing House, 2001.
[31]
State Forestry Administration. China Forestry Yearbook 2005 [M].
Beijing: China Forestry Publishing House, 2005.
[32]
State Forestry Administration. China Forestry Yearbook 2010 [M].
Beijing: China Forestry Publishing House, 2011.
[33]
State Forestry Administration. China Forestry Yearbook 2014 [M].
Beijing: China Forestry Publishing House, 2015.
[34]
Song, Q. F. Study on impact of forest resource dynamic change on
forest ecological function in recent 40 years in China [D]. Beijing: Chinese
Academy of Forestry, 2015.
[35]
Chen, Y. L., Luo, G. P., Maisupova, B., et al. Carbon
budget from forest land use and management in Central Asia during 1961-2010 [J]. Agricultural & Forest Meteorology,
2016, 221: 131‒141.