Presence/Absence Point Records of Japanese Serow (Naemorhedus crispus) with Environmental Predictors in the Fuji-Tanzawa Region, Japan
Doko, T.* Chen, W. B.
Keio Research Institute at Shonan Fujisawa Campus (SFC), Keio University, Fujisawa, 2520882, Japan
Abstract: The Japanese Serow (Naemorhedus crispus) is endemic to Japan, and has been de- signated as a Japanese natural monument. We produced a total of 319 point records of Japanese Serow occurrence (160 presence records and 159 absence records), with data for 14 environmental predictors. The environmental predictors were altitude, slope, annual precipitation, annual maximum temperature, annual minimum temperature, distance to rivers, distance to all roads, distance to highways, distance to general roads, distance to paths and stone steps, distance to wide roads (>13 m), distance to narrow roads (≤13 m), the normalized difference vegetation index), and the vegetation cover types at the vegetation community level. The data formats were CSV format (.csv), Google Earth (.kmz), and Arc/Info (.shp). The projected datum was the Japanese Geodetic Datum 2000. The spatial resolution of raster data used to produce the dataset was 50 m. The data size was 43 KB for CSV (.csv), 29 KB for Google Earth (.kmz), and 249 KB for Arc/Info (.shp) format.
Keywords: Fuji-Tanzawa region; Japan, species records; Japanese Serow; point data
1 Introduction
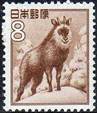
The Japanese Serow (Naemorhedus crispus) is endemic to Japan (Figure 1). The species inhabits montane regions of Honshu, Shikoku, and Kyushu[1]. Once overhunted for meat and fur, it became so rare that the government of Japan declared it a national treasure[2]. It has subsequently been designated a Japanese natural monument. Since then, its population has recovered[2].
We produced a total of 319 point records of Japanese Serow occurrence (160 presence records and 159 absence records), with data for 14 potential predictors.
|
|
|
|
(A) The government of Japan pays special attention to the Japanese Serow and has produced a stamp calling for its preservation (The Japanese Serow featured on a 1952 stamp)
|
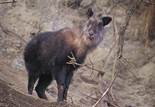
(B) Japanese Serow[3] (length: est. 80 cm, weight: est. 35 kg[4])
|
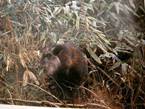
(C) Japanese Serow’s diet[3]
|
Figure 1 Photographs of Japanese Serow
2 Metadata of Dataset
The metadata regarding Japanese Serow occurrence, together with the data for the environmental predictors in the Fuji-Tanzawa region in Japan (“JpSerow_env_FT”)[5] are listed in Table 1 (Japanese Serow occurrence with data for environmental predictors in the Fuji-Tanzawa region in Japan (“JpSerow_env_FT” for short)).
3 Methods
A full description of the method can be found in the work of Doko and Chen[1] and Doko[7]. Here, we summarize the main methods used to produce the dataset.
3.1 Study Area
The study was conducted in the Fuji and Tanzawa region of Japan (35°10¢ to 35°40¢ N and 138°30 to 139°20¢ E in Japanese Geodetic Datum 2000, Figure 2). The study area is mountainous and includes Fuji National Park, as well as Tanzawa Quasi-National Park. These parks contain various landscapes and are characterized by a very high biodiversity, including the occurrence of a number of endemic species[1,9].
3.2 Extraction of Species Records
First, a map containing the 160 observed point localities for Japanese Serow in the Tanzawa region[3] was scanned. This map was created based on questionnaires and interviews with surveyors from the Research Group of the Tanzawa Mountains (57 respondents), whose research was conducted from 1993 to 1996, nature guides from prefectural parks (100 respondents), members of nature conservation groups (32 respondents), mountaineering associations (72 groups), and other respondents[3]. These selected respondents were considered to represent people likely to have knowledge and information regarding Japanese Serow in the Tanzawa Mountains. The purpose of this activity was to collect information regarding the Japanese Serow inhabiting the Tanzawa Mountains, because the distribution and habitat of this species in Tanzawa was completely unknown[3]. The extent of the map included the entire area of the Tanzawa region.
Table 1 Japanese Serow occurrence with data for environmental predictors in the Fuji-Tanzawa region in Japan (“JpSerow_env_FT” for short)
|
Items
|
Description
|
|
Dataset full name
|
Japanese Serow occurrence with data for environmental predictors in the Fuji-Tanzawa region in Japan
|
|
Datasen short name
|
JpSerow_env_FT
|
|
Authors
|
Doko, T. L-6494-2016, Keio Research Institute at SFC, Keio University, Japan, dokochan@ sfc.keio.ac.jp
Chen, W. B. L-5715-2016, Keio Research Institute at SFC, Keio University, Japan, chenwb3@ gmail.com
|
|
Geographical region
|
Asia from latitudes 35°10¢ to 35°40¢ N and 138°30 to 139°20¢ E in Japanese Geodetic Datum 2000
|
|
Year of dataset
|
2013
|
|
Spatial resolution
|
50 m
|
|
Data format
|
.csv, .kmz, .shp
|
|
Data size
|
43 KB for CSV (.csv), 29 KB for Google Earth (.kmz), and 249 KB for Arc/Info (.shp)
|
|
Foundation(s)
|
International Institute for Geo-information Science and Earth Observation (ITC), a Grant- in-Aid for Japan Society for the Promotion of Science (JSPS) Fellows 2012 (KAKENHI No.23-4520), and the International Program for Environmental Innovators, Keio University through Strategic Funds for the Promotion of Science and Technology, Ministry of Education, Culture, Sports, Science and Technology (MEXT) of Japan
|
|
Data publisher
|
Global Change Research Data Publishing & Repository, http://www.geodoi.ac.cn/
|
|
Address
|
No.11A, Datun Road, Chaoyang District, Beijing 100101, China
|
|
Data sharing policy
|
Data from the Global Change Research Data Publishing & Repository includes metadata, datasets (data products), and publications (in this case, in the Journal of Global Change Data & Discovery). Data sharing policy includes: (1) Data are openly available and can be free downloaded via the Internet; (2) End users are encouraged to use Data subject to citation; (3) Users, who are by definition also value-added service providers, are welcome to redistribute Data subject to written permission from the GCdataPR Editorial Office and the issuance of a Data redistribution license; and (4) If Data are used to compile new datasets, the ‘ten per cent principal’ should be followed such that Data records utilized should not surpass 10% of the new dataset contents, while sources should be clearly noted in suitable places in the new dataset[6]
|
The scanned map was then geo-referenced. The map was suitable for georeferencing, with the locations of rivers identified in the map so that authors could find ground control points easily. A first-order polynomial affine transformation was applied to rectify the scanned
image. The associated root mean square (RMS) error was 251 m. Based on the rectified image, 160 points were digitized manually. Geographic coordinates were calculated by ArcMap®.
Due to the lack of accurate absence data for the Japanese Serow, absence data were obtained from a national distributional map of Japanese mammals[10] using a previously described method[9]. A total of 160 absence points was generated. The national distribution map of Japanese mammals is composed of grid cells measuring 5×5 km2 across Japan. However, instead of using grid cells directly, this method plots random points inside the polygons where no serows were observed between 1978 and 2003. Hence, the spatial resolution of the absence points was considered to be comparable to the presence data.
3.3 Geo-database for the Environmental Predictors
Based on the known ecology of the Japanese Serow[3,11–13], the following environmental
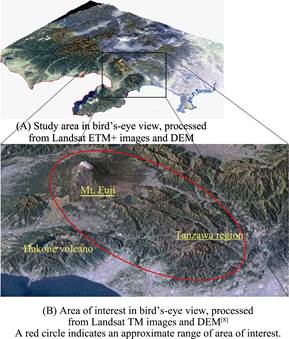
Figure 2 The study area of the Fuji-Tanzawa region, Japan (DEM = digital elevation model)
predictors, which can potentially influence the serow’s distribution, were selected: altitude, slope, annual precipitation, annual maximum temperature, annual minimum temperature, distance to rivers, distance to all roads, distance to highways, distance to general roads, distance to paths and stone steps, distance to wide roads (>13 m), distance to narrow roads (≤13 m), the normalized difference vegetation index (NDVI), and the vegetation cover types at the vegetation community level. A threshold value of 13 m was used for the road width, because this would encompass two or more lanes, and it was assumed that it would be difficult for animals to cross such a road.
Precipitation data were derived in ESRI (Redlands, CA, USA) grid format at a resolution of 1 × 1 km2 (30 arc-seconds) from the WorldClim database[14]. The annual precipitation was calculated from the precipitation data for 12 months. The minimum and maximum temperature were derived from the WorldClim database. The annual minimum and maximum temperature were calculated. The NDVI was derived from the red:near-infrared reflectance ratio. NDVI = (NIR-RED)/(NIR+RED), where NIR and RED are the amounts of near-infrared and red light, respectively, that are reflected by the vegetation and captured by the sensor of the satellites. NDVI values range from -1 to +1, where negative values correspond to an absence of vegetation. All variables were obtained digitally from various sources (Table 2) and stored in a geographic information system (GIS) environment. Considering the relatively small size of important landscape elements in the Japanese landscape and the high precision of the species records, all predictor variables were compiled at a resolution of 50 × 50 m2. Erdas Imagine® 8.7 was used to calculate NDVI values. ArcGIS® 9.3 was used for the other variables.
Table 2 Potential environmental predictors of Japanese Serow
|
Category (Source)
|
Environmental predictor
|
Unit
|
|
Topography (digital elevation model (DEM) data from Shuttle Radar Topography Mission (SRTM))
|
Altitude
|
m
|
|
Slope
|
°
|
|
Climate data (WorldClim)
|
Annual mean precipitation
|
mm
|
|
Annual minimum temperature
|
°C
|
|
Annual maximum temperature
|
°C
|
|
Water resources (Digital Map 25000 and Global Map Japan Ver.1)
|
Distance to rivers
|
m
|
|
Roads (Digital Map 25000)
|
All
|
Distance to all roads
|
m
|
|
Type
|
Distance to highways
|
m
|
|
Distance to general roads
|
m
|
|
Distance to paths and stone steps
|
m
|
|
Width
|
Distance to wide roads (more than 13 m)
|
m
|
|
Distance to narrow roads (less than 13 m)
|
m
|
|
Vegetation (Landsat-7 ETM+ from the Global Land Cover Facility (GLCF) for the NDVI and a GIS dataset from the Ministry of the Environment (MOE) for vegetation cover)
|
Normalized difference vegetation index (NDVI)
|
N/A
|
|
Vegetation cover types (at the vegetation community level)
|
N/A
|
The image processing procedures specified in the paper[9] were applied.
When 320 records were plotted in ArcMap 9.3® with other environmental variables, one absence record fell outside the study area. This record was discarded from the species data, and the total number of records became 319. Pixel values were extracted from all layers of environmental predictor variables by ArcMap 9.3® to obtain the geographic coordinates of the records of presence and absence.
Figure 3 shows a flow chart of JpSerow_env_FT data production. Table 3 describes the
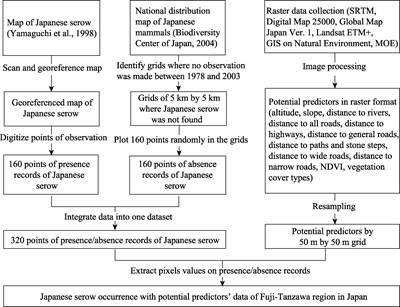
Figure 3 Flow Chart of the dataset development
Table 3 Description of the JpSerow_env_FT data
|
Variables
|
Code (attribute)
|
Data types
|
Numerical precision
|
|
Species scientific name
|
SPECIES
|
Factor
|
-
|
|
X coordinate in WGS 84 UTM Zone 54
|
X
|
Numeric
|
1 m
|
|
Y coordinate in WGS 84 UTM Zone 54
|
Y
|
Numeric
|
1 m
|
|
Presence or Absence data
|
1 or 0
|
Logical *1
|
-
|
|
Name of location where species were observed
|
AREA
|
Factor
|
-
|
|
Year of observation
|
YEAR
|
Factor
|
-
|
|
Altitude
|
DEM
|
Numeric
|
1 m
|
|
Slope
|
SLOPE
|
Numeric
|
1 angular degree
|
|
Annual mean precipitation
|
PREP
|
Numeric
|
1 mm
|
|
Annual minimum temperature
|
TMIN
|
Numeric
|
1 °C
|
|
Annual maximum temperature
|
TMAX
|
Numeric
|
1 °C
|
|
Distance to all roads
|
DIS_ROAD
|
Numeric
|
1 m
|
|
Distance to highways
|
HIGHWAY
|
Numeric
|
1 m
|
|
Distance to general roads
|
NORMALROAD
|
Numeric
|
1 m
|
|
Distance to paths and stone steps
|
SMALLSTREET
|
Numeric
|
1 m
|
|
Distance to wide roads (more than 13 m)
|
WIDEROAD
|
Numeric
|
1 m
|
|
Distance to narrow roads (less than 13 m)
|
NARROWROAD
|
Numeric
|
1 m
|
|
Distance to river streams
|
RIVER
|
Numeric
|
1 m
|
|
Value of the normalized difference vegetation index (NDVI)
|
NDVI
|
Numeric
|
0.000,001
|
|
Vegetation cover types
|
VEG
|
Factor *2
|
-
|
|
X coordinate in Japanese Geodetic Datum 2000
|
LAT
|
Numeric
|
0.000,000,1 degree
|
|
Y coordinate in Japanese Geodetic Datum 2000
|
LONG
|
Numeric
|
0.000,000,1 degree
|
*1 Note. 1 means presence, 0 means absence.
*2 Note. Vegetation cover types are coded by four digits.
meaning of the columns in the JpSerow_env_FT database. Table 4 provides an additional explanation of the meaning of the vegetation code (VEG) in Table 3.
Figure 4 shows Japanese Serow records, with an ESRI satellite imagery basemap, and roads
Table 4 Look-up-table for the vegetation code [VEG] and its meaning
|
Code [VEG] *1
|
6veg.cover
|
15veg.cover
|
|
2005
|
Subalpine zone
|
Subalpine evergreen needleleaf forest
|
|
2020
|
Subalpine zone
|
Subalpine broad-leaved deciduous forest
|
|
3008
|
Others
|
Logged forest
|
|
4015
|
Montane zone
|
Montane zone broad-leaved deciduous forest
|
|
4024
|
Montane zone
|
Montane zone broad-leaved deciduous forest
|
|
4028
|
montane zone
|
Montane zone broad-leaved deciduous forest
|
|
4030
|
Montane zone
|
Montane zone evergreen needleleaf forest
|
(To be continued on the next page)
(Continued)
|
Code [VEG]*1
|
6veg.cover
|
15veg.cover
|
|
4093
|
Montane zone
|
Montane zone broad-leaved deciduous forest
|
|
4110
|
Montane zone
|
Montane zone broad-leaved deciduous forest
|
|
4132
|
Montane zone
|
Montane zone broad-leaved deciduous forest
|
|
5009
|
Montane zone
|
Montane zone broad-leaved deciduous forest
|
|
5020
|
Montane zone
|
Montane zone broad-leaved deciduous forest
|
|
5035
|
Montane zone
|
Montane zone broad-leaved deciduous forest
|
|
5042
|
Others
|
Grass field
|
|
5046
|
Others
|
Grass field
|
|
5049
|
Others
|
Grass field
|
|
5055
|
Others
|
Grass field
|
|
5066
|
Others
|
Logged forest
|
|
6002
|
Low country
|
Low country evergreen needleleaf forest
|
|
6020
|
Low country
|
Low country broad-leaved evergreen forest
|
|
6039
|
Low country
|
Low country broad-leaved deciduous forest
|
|
6074
|
Low country
|
Low country broad-leaved evergreen forest
|
|
6120
|
Low country
|
Low country broad-leaved deciduous forest
|
|
7002
|
Low country
|
Low country broad-leaved deciduous forest
|
|
7006
|
Low country
|
Low country broad-leaved deciduous forest
|
|
7011
|
Low country
|
Low country broad-leaved deciduous forest
|
|
7012
|
Low country
|
Low country broad-leaved deciduous forest
|
|
7013
|
Low country
|
Low country broad-leaved deciduous forest
|
|
7017
|
Low country
|
Low country broad-leaved evergreen forest
|
|
7036
|
Others
|
Logged forest
|
|
7040
|
Others
|
Logged forest
|
|
7054
|
Others
|
Grass field
|
|
7061
|
Others
|
Grass field
|
|
7069
|
Others
|
Grass field
|
|
7072
|
Others
|
Developed land
|
|
7081
|
Low country
|
Low country evergreen needleleaf forest
|
|
7095
|
Others
|
Dry riverbed or bare land
|
|
8054
|
Others
|
Grass field
|
|
9006
|
Plantation
|
Planted evergreen needleleaf forest
|
|
9011
|
Plantation
|
Planted evergreen needleleaf forest
|
|
9013
|
Plantation
|
Planted evergreen needleleaf forest
|
|
9016
|
Plantation
|
Planted evergreen needleleaf forest
|
|
9023
|
Plantation
|
Planted broad-leaved needleleaf forest
|
|
9055
|
Others
|
Arable land
|
|
9062
|
Others
|
Arable land
|
|
9064
|
Others
|
Arable land
|
|
9066
|
Others
|
Arable land
|
|
9068
|
Others
|
Arable land
|
|
9070
|
Others
|
Arable land
|
|
9072
|
Others
|
Arable land
|
|
9082
|
Others
|
Grass field
|
|
9083
|
Others
|
Grass field
|
(To be continued on the next page)
(Continued)
|
Code [VEG] *1
|
6veg.cover
|
15veg.cover
|
|
9095
|
Others
|
Developed land
|
|
9098
|
Others
|
Arable land
|
|
9902
|
Others
|
Developed land
|
|
9905
|
Others
|
Developed land
|
|
9915
|
Others
|
Developed land
|
|
9919
|
Others
|
Developed land
|
|
9931
|
Others
|
Dry riverbed or bare land
|
|
9933
|
Others
|
Dry riverbed or bare land
|
*1 Note: The four-digit vegetation code [VEG] is equivalent to “MAJOR1” in the Japanese standard classification legend of the second to fifth vegetation maps prepared by the Ministry of Environment (See http://vegetation.jp/qanda/ xls/hanrei-taiou. xls)[15].

Figure 4 Map of Japanese Serow records, with an ESRI satellite imagery basemap, and roads and boundaries and boundaries. The point records indicated as Japanese Serow records (red and yellow triangles) in the map are available as a dataset through this study. Other items such as major mountains, wide roads, highways, boundaries as well as ESRI satellite imagery basemaps were not included in the dataset.
4 Dataset Quality Control and Validation
The dataset has been validated by researchers from Keio University in Japan. The associated RMS error was 251 m for a scanned map of Japanese Serow occurrences.
5 Conclusion
This dataset provides a record of presence/absence data for Japanese Serow, which is endemic to Japan, with records associated with environmental predictors. The environmental predictors are altitude, slope, annual precipitation, annual maximum temperature, annual minimum temperature, distance to rivers, distance to all roads, distance to highways, distance to general roads, distance to paths and stone steps, distance to wide roads (>13 m), distance to narrow roads (≤13 m), the NDVI, and vegetation cover types at the vegetation community level.
References
[1] Doko, T., Chen, W. The geographical distribution and habitat use of Japanese serow (Naemorhedus crispus) in the Fuji-Tanzawa region, Japan [J]. Journal of Environmental Information Science, 2013, 41(5): 53-62.
[2] Hidaka, T. The encyclopaedia of animals in Japan [M]. In Mammals 2. Isawa (ed). Heibonsha Limited, Publishers, 1996,155.
[3] Yamaguchi, Y., Nakamura, M., Watanabe, N. Distribution of Japanese serow Capricornis crispus in Tanzawa Mountains, Kanagawa Prefecture [J]. BINOS, 1998, 5: 23-30.
[4] Kanagawa Prefectural Museum of Natural History. Mammals 2003 [Z]. Yurindo Co., Ltd., 2003, 138.
[5] Doko, T. Modeling of species geographic distribution for assessing present needs for the ecological networks : case study of Fuji region and Tanzawa region, Japan [D]. ITC: Enschede, 2007, 112.
[6] Doko, T., Chen, W. B. Presence/Absence Point Records of Japanese Serow (Naemorhedus Crispus) with Environmental Conditions in the Fuji-Tanzawa Region, Japan [DB/OL]. Global Change Research Data Publishing & Repository, 2014. DOI: 10.3974/geodb.2014.02.06.V1
[7] GCdataPR Editorial Office. GCdataPR data sharing policy [OL]. DOI: 10.3974/dp.policy.2014.05 (Updated 2017).
[8] Araida, S. Nature in Tanzawa [R]. Kanagawa Newspaper, 2003.
[9] Doko, T., Hiromichi, F., Kooiman, A., et al. Identifying habitat patches and potential ecological corridors for remnant Asiatic black bear (Ursus thibetanus japonicus) populations in Japan [J]. Ecological Modelling, 2011, 222(3): 748-761.
[10] Biodiversity Center of Japan. The national survey on the natural environment report on the distributional survey of Japanese animals (mammals) [M]. Biodiversity Center of Japan. The Ministry of Environment: Fujiyoshida, 2004, 232.
[11] Matsumoto, M., Naomi, N., Hisatoshi, S., et al. On the field signs of Japanese serow, Capricornis crispus crispus (TEMMICK) in Kawarasawa District, Chichibu Mountain [M]. Saitama Museum of Natural History. Bull, 1984, 1-20.
[12] Deguchi, Y., Sato, S., Sugawara, K. Food plant selection by the wild Japanese Serow (Capricornis crispus) with reference to the traces eaten [J]. Animal Science Journal, 2002, 73(1): 67-72.
[13] Nowicki, P. Koganezawa, M. Densities and habitat selection of the sika deer and the Japanese Serow in Nikko National Park, central Japan, as revealed by aerial censuses and GIS analysis [J]. Biosphere Conservation, 2001, 3(2): 71-87.
[14] WorldClim. WorldClim-global climate data [DB/OL]. Available from: http://www.worldclim.org/. [March 2008].
[15] Ministry of Environment. “MAJOR1” in the Japanese standard classification legend of the 2nd to 5th vegetation maps [DB/OL]. http://vegetation.jp/qanda/xls/hanrei-taiou.xls.