Spatial
Analysis Method for Risk Areas and Rescue Accessibility of High-voltage Power
Towers: a Case Study of Guangzhou City, China
Liu, C.1,2 Yang, Y.3 Li, S. J. 4 He, Y. L.5 Yang, Z.5 Wang, S. H.1,2*
1. State Key Laboratory of Remote Sensing and Digital Earth, Aerospace
Information Research Institute, Chinese Academy of Sciences, Beijing 100101,
China;
2. University of Chinese Academy of
Sciences, Beijing 100049, China;
3. China Southern Power Grid Digital
Platform Technology Company, Shenzhen 518100, China;
4. China Southern Power Grid Company
Limited, Guangzhou 510663, China;
5. Faculty of Geomatics, Lanzhou
Jiaotong University, Lanzhou 730070, China
Abstract: Electric
power infrastructure is a crucial guarantee for production and daily life.
High-voltage power grids are spread throughout the city, and high-voltage power
towers are important nodes in the power network. Collapse accidents often
occur, and in the event of an accident, emergency response from fire rescue is
required. This study takes Guangzhou City as an example, comprehensively
collects the data of the spatial distribution of high-voltage power towers, and
utilizes the spatial analysis method of Geographic Information System (GIS). By
analyzing the buffer zones of high-voltage power towers, roads and buildings,
overlaying them to produce the adjacent risk areas, and calculating the fire
rescue accessibility of high-voltage power towers, we propose a comprehensive
spatial analysis method for calculating the risk areas and rescue accessibility
of high-voltage power towers. The analysis process includes the statistics of
the number of high-voltage power towers, the delineation of the spatial distribution
of high-voltage power tower risk areas, the calculation of fire rescue time,
and the calculation of fire rescue accessibility. Among them, the delineation
process of high-voltage power tower risk areas includes the delineation of
road-near risk areas, building-near risk areas, and comprehensive risk areas,
as well as the calculation of area with risk areas and population in risk
areas. This method provides a reference for the rescue operation of
high-voltage power tower collapse accidents and the resilience construction of
megacities.
Keywords: power tower; spatial analysis; risk
area; accessibility; Guangzhou
DOI: https://doi.org/10.3974/geodp.2025.03.02
1 Introduction
As
a core component of the urban lifeline system, power infrastructure is an
important guarantee for production and life, and it is the ??energy bloodline??
that sustains the economic operation of modern society[1]. The
United Nations Sustainable Development Goal 9 clearly states that it is
necessary to build high-quality, reliable, sustainable and disaster-resilient
infrastructure[2]. As an important infrastructure, the construction
of high-voltage transmission grids is of great significance[3];
High-voltage lines and transmission towers, as the edges and nodes of the power
grid, jointly form the high-voltage transmission network. As the most important
existing power dataset, OpenStreetMap data stores relatively comprehensive
structured power network information, and some researchers have also conducted
relatively comprehensive studies based on this data source[4].
As nodes of
high-voltage transmission networks, the significance of high-voltage
transmission towers cannot be underestimated. Their safety not only determines
the stability of daily power supply but also supports the industrial and
commercial production of cities and the living security of millions of people[5].
High-voltage power towers have to withstand the pressure of numerous events
such as storms, karst conditions, and construction, so under the circumstances
of typhoons, thunderstorms, and geological disasters, they are highly prone to
collapse accidents, posing a significant risk to the lives and property of the
surrounding residents[6?C9]. The inspection of power transmission
grids and high-voltage power towers through aerial remote sensing images under
adverse weather conditions plays a significant role in the construction of
smart grids, promoting the development of remote sensing technology for
identifying and extracting power towers[10,11].
With the gradual
acceleration of urbanization, the density of urban power grids has soared. Many
power towers are laid along roads or suspended above buildings, posing a
significant safety hazard to the city. Once high-voltage power towers collapse,
they will pose a threat to the lives and property of pedestrians, vehicles, and
residents[12]. Once an electric tower collapses, apart from directly
affecting vehicles, pedestrians and building facilities, it is highly likely to
cause secondary hazards such as fires[13]. Therefore, the efficiency
and accessibility of emergency rescue after an accident are important
guarantees for the safety of the surrounding residents and the restoration of
the power system[14].
As a super-large
city on the southeast coast of the subtropical zone in China, Guangzhou is not
only confronted with the threat of extreme weather caused by climate change,
but also has the spatial characteristics of dense population and complex
functions. Coupled with its coastal terrain that is high in the northeast and
low in the southwest, it poses higher requirements for the safety and
resilience of transmission towers[15]. The existence of risk areas
not only may lead to power outages, but also, due to the spatial conflicts
between power towers and roads and buildings, will block post-disaster rescue
channels and delay the progress of emergency repairs. GIS has powerful spatial
analysis capabilities. By using computers to analyze raw data and digital maps,
new cognitive and decision-making bases can be obtained, and it has been widely
applied in various related fields[16,17]. Analyzing the distribution
of risk areas between transmission towers and adjacent roads and buildings, and
calculating the accessibility of fire safety rescue for high-voltage power
towers, is not only a requirement for ensuring the safety of the power system
itself, but also a core support for building an urban disaster emergency
response system and enhancing post-disaster recovery capabilities, providing
key technical references for the resilience construction of megacities.
2 Data Sources and Analysis
Methods
2.1 Data Sources
The
spatial distribution data of high-voltage power towers is derived from the
open-source map database OpenStreetMap (OSM),
obtained by querying the ??tower?? nodes under the ??power?? layer through the
Overpass Query Language (OverpassQL) interface, exported in GeoJSON format and
converted to Shapefile in ArcGIS Pro 3.0 software[18]. Take
Guangzhou City as an example. The high-voltage power tower data covers 11
districts of Guangzhou City, with a total of 15,375 points.
The boundaries
of administrative divisions are derived from the National Catalogue Service for
Geographic Information;
The road data is also sourced from the open-source map database OSM; The
building data is derived from the data paper of Zhang, et al.[19];
The population raster data is derived from the data paper by Chen, et al.[20]; The data of the fire
station is sourced from the Amap Open Platform. The
above vector data is in the WGS1984 coordinate system, and the population
raster data is in the Albers equal-area conic projection.
2.2 Spatial Analysis
Method
2.2.1 Buffer and Overlay Analysis Methods
The
buffer zone is a transitional zone for mitigating external risks of
geographical entities, and it is a polygonal area of a certain width formed
around the geographical entity[21]. Buffer zone analysis is one of
the important spatial analysis methods in GIS, and its main purpose is to
determine the service or influence range of geographical entities. The buffer
analysis method takes the boundaries of points, lines, and polygons as the
center and creates a buffer polygon within a specified distance around the
input feature[22]. Overlay analysis is a spatial analysis method
that overlays different vector graphics layers in the same area to perform
graphic and attribute operations, generating new spatial graphics within the
same range[23]. The intersection analysis of polygons extracts the
common areas of different polygons, and the new polygon generated is the
intersection of the original polygon; the combination or joint analysis of
polygons generates the common range of all polygons, and the new polygon produced
is the union of the original polygons[24].
During the
analysis process, a point buffer zone of corresponding distance was created
with the high-voltage power tower point as the center (Figure 1a), and the
high-risk area around the high-voltage power tower was determined as the risk
area of the high-voltage power tower. Establish line buffer zones (Figure 1b)
and polygon buffer zones (Figure 1c) at corresponding distances for roads and
buildings respectively. Intersect the risk areas of high-voltage power towers
with the buffer zones of roads and buildings respectively (Figure 2a and Figure
2b), forming risk areas adjacent to roads and buildings. The road-adjacent risk
area and the building-adjacent risk area are superimposed (Figure 2c) and
combined to obtain the comprehensive risk area. The 3 types of risk areas are
respectively intersected with administrative divisions to obtain the area and
proportion of risk areas in each administrative region. Finally, it is
superimposed with the population grid, and the population covered by the risk
area is obtained by using spatial statistical methods[25].
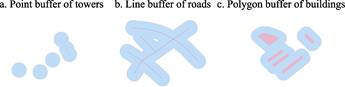
Figure 1 Example of the feature
buffer
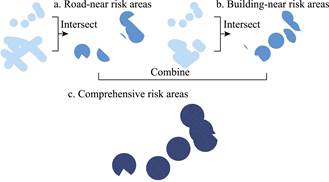
Figure 2 Example of buffer overlay
2.2.2 Accessibility Calculation Method
Accessibility
refers to the quantitative expression of the ease or expectation of people
overcoming obstacles such as distance or time to reach service facilities or
activity venues[26]. Temporal accessibility mainly considers the
travel time from the supplier to the demand side, while spatial accessibility
emphasizes the spatial relationship between the supplier and the demand side.
Network analysis method and two-step floating catchment area method are the
most common methods for calculating accessibility[27]. The network
analysis of the nearest facility method to calculate the travel time only
studies from the supply perspective when a single fire station can reach the
high-voltage power tower; the two-step floating catchment area method takes
into account both supply and demand aspects to calculate the number of fire
stations that can be obtained from high-voltage power towers in the event of
simultaneous accidents[28].
The urban road
network serves as the framework and carrier of urban social and economic
activities, and it is the core link of fire rescue operations[29].
The network analysis method builds a network dataset based on the urban road
network, and conducts calculations by taking high-voltage power towers and fire
stations as event points and facility points respectively. Calculate the
nearest facility point to obtain the shortest rescue time for each high-voltage
power tower; and calculate the OD cost matrix to obtain the network travel time
between each fire station and each high-voltage power tower[30].
The two-step
floating catchment area method conducts 2 searches centered on the supply point
(in this study, the fire station) and the demand point (in this study, the
high-voltage power tower) within the determined range, and calculates the
available supply (number of facilities) at the demand point[31]. The
Gaussian floating catchment area method introduces a Gaussian attenuation
function to replace the fixed radius without distance attenuation, and performs
distance attenuation in 2 searches[32]. During the analysis process,
considering the actual driving conditions of the fire engine, the network
distance (network travel time) was used to replace the planar Euclidean
distance, and the OD cost matrix of the network analysis method was introduced
for calculation[33].
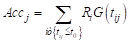
The first step
is to calculate the supply-demand ratio for each fire station:
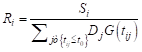 (1)
(1)
where,
Ri represents the supply-demand ratio of fire station i.
Si represents the total service capacity of fire station  . Here, it is assumed that the total service capacity of each
fire station is the same and is set to 1. tij is the driving
time from fire station i to high-voltage power tower j, and t0
is the search time threshold of the service area. Dj
represents the demand of the high-voltage power tower
. Here, it is assumed that the total service capacity of each
fire station is the same and is set to 1. tij is the driving
time from fire station i to high-voltage power tower j, and t0
is the search time threshold of the service area. Dj
represents the demand of the high-voltage power tower  . Here, it is assumed that the demand of each high-voltage
power tower is 1.
. Here, it is assumed that the demand of each high-voltage
power tower is 1.  is the Gaussian
decay function:
is the Gaussian
decay function:
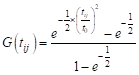 (2)
(2)
For each
determined fire station , a time scope is formed based on the maximum search time  . Search for high-voltage power towers that fall within the
time domain in the OD cost matrix and calculate the weighted quantity using the
Gaussian attenuation function. The supply-demand ratio of fire station is obtained by
dividing the total service capacity of the fire station by the weighted demand
quantity.
. Search for high-voltage power towers that fall within the
time domain in the OD cost matrix and calculate the weighted quantity using the
Gaussian attenuation function. The supply-demand ratio of fire station is obtained by
dividing the total service capacity of the fire station by the weighted demand
quantity.
The second step
is to calculate accessibility for each high-voltage power tower:
 (3)
(3)
where,
 represents the
accessibility of each high-voltage power tower , which is the total amount of fire station services
obtained.
represents the
accessibility of each high-voltage power tower , which is the total amount of fire station services
obtained.
For each
high-voltage power tower , a time scope is also formed based on the maximum search
time . Search for fire stations within this time scope in the OD
cost matrix, use the Gaussian attenuation function to weight the supply and
demand ratio, and add them up to obtain the accessibility of each high-voltage
power tower  , that is, the number of fire rescue facilities that each
high-voltage power tower can be allocated within a certain range.
, that is, the number of fire rescue facilities that each
high-voltage power tower can be allocated within a certain range.
2.3 Technical Approach
The
spatial analysis process of risk areas and rescue accessibility for
high-voltage power towers mainly takes high-voltage power tower, road,
building, and fire station as the basic data. It delineates the adjacent risk
areas of high-voltage power towers, calculates the fire rescue time and
accessibility. The technical route of the analysis process is shown in Figure
3, and the specific steps are as follows:
(1) Collect
basic data such as high-voltage power towers, administrative divisions, roads,
buildings, population, and fire stations, unify the coordinate systems of the
data, and convert the coordinate systems of the data into the WGS1984
geographic coordinate system and the UTM projection coordinate system;
(2) Explore the
spatial distribution of high-voltage power towers and count the number of high-voltage
power towers in each area;
(3) Create a
50-m buffer zone around the high-voltage power tower as a high-risk area. At
the same time, create 50-m buffer zones for roads and buildings. Intersect the
50-m buffer zones of the high-voltage power tower with those of roads and
buildings respectively to obtain the risk areas adjacent to roads and
buildings. Combine the 2 types of risk areas to obtain a comprehensive risk
area;
(4) Calculate
the area of various risks in each district and the population covered by risk
areas in each district;
(5) Based on the
geographical locations of the existing fire stations, calculate the rescue time
required from the nearest fire station to each high-voltage power tower through
the road network;
(6) Calculate
the rescue time from each fire station to each high-voltage power tower as the
OD cost matrix. Through the Gaussian attenuation function and time threshold,
calculate the fire rescue accessibility of each high-voltage power tower using
the two-step floating catchment area method.
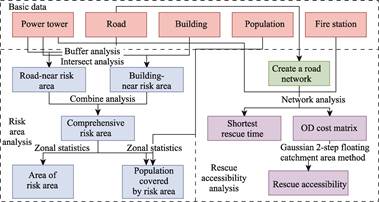
Figure 3 Flowchart of the spatial
analysis
3 Case Analysis Results
3.1 Analysis Result Data
Overview
The
spatial analysis process of risk areas and rescue accessibility for
high-voltage power towers mainly generates results such as high-voltage power
tower point data (PowerTower), high-voltage power tower adjacent risk area data
(RiskArea), high-voltage power tower rescue time (RescueTime), and high-voltage
power tower rescue accessibility (RescueAccessibility). Among them, the risk
area data include risk areas adjacent to roads, risk areas adjacent to
buildings, and comprehensive risk areas; the rescue time and rescue
accessibility results are archived in the form of attribute tables in the
high-voltage power tower point data; the fields included in the high-voltage
power tower point data and the meanings and descriptions they represent are
shown in Table 1.
Table 1
The field list of the power tower point data
|
Field name
|
Content
|
Description
|
|
ID
|
Number
|
The power tower
number in this study
|
|
OSMID
|
Number in OSM
|
The power tower
number in OSM
|
|
Province/ProvinceCN
|
Province
|
The
provincial-level administrative region to which the power tower belongs
|
|
City/CityCN
|
City
|
The
prefecture-level administrative region to which the power tower belongs
|
|
District/DistrictCN
|
District
|
The county-level
administrative region to which the power tower belongs
|
|
Adcode
|
Administrative
code
|
The county-level
administrative code to which the power tower belongs
|
|
Longitude
|
Longitude
|
The longitude
geographical coordinates of the power tower
|
|
Latitude
|
Latitude
|
The latitude
geographical coordinates of the power tower
|
|
TimeOF
|
Rescue time
|
The shortest
driving time from the fire station to the power tower
|
|
Accessibility5
|
5-minute
accessibility
|
The
accessibility of fire stations with a time threshold of 5 minutes
|
|
Accessibility10
|
10-minute
accessibility
|
The
accessibility of fire stations with a time threshold of 10 minutes
|
|
Accessibility15
|
15-minute
accessibility
|
The
accessibility of fire stations with a time threshold of 15 minutes
|
|
Accessibility30
|
30-minute
accessibility
|
The
accessibility of fire stations with a time threshold of 30 minutes
|
3.2 Case Study of
Guangzhou City
|
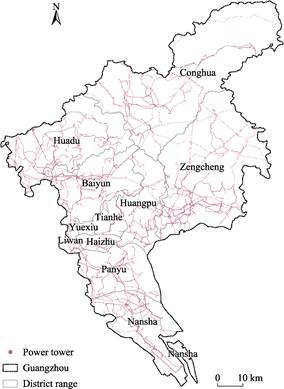
Figure 4
Spatial distribution map of high-voltage power towers in Guangzhou
|
3.2.1 Spatial Distribution and Statistical Data Calculation of Power
Towers
The spatial
analysis process first requires collecting all high-voltage power towers in the study area from the open-source map database OpenStreetMap, which spatial distribution is shown in Figure 4. There is a total of 15,375 high-voltage power
towers in Guangzhou City. By overlaying the power tower data of each district
with the administrative division data, the number of power towers in each
district is statistically calculated as shown in Figure
5. The number of power towers in each section varies greatly. The
different locations, sizes and land use methods of each administrative
district result in variations in the number of power towers: the administrative
districts in the city center are small in area and have relatively complete
underground cable laying, thus having a lower demand for ground power towers;
the area of the peripheral counties and districts is relatively large, and more
power towers are needed to cover large areas to ensure power supply.
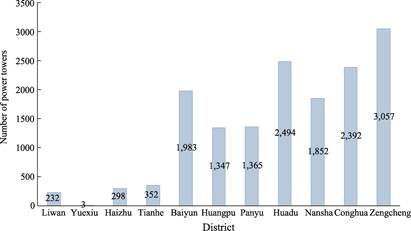
Figure 5 Statistical of the number
of power towers in various districts of Guangzhou
3.2.2 Demarcation of Road-near Risk Areas for High-voltage Power Towers
Create
a 50-m buffer zone for the high-voltage power towers in the study area as a
high-risk zone around the high-voltage power towers. A 50-m buffer zone was
created for the roads within the study area and intersected with the 50-m
buffer zone of the high-voltage power tower to form a risk area adjacent to the
roads of the high-voltage power tower (Figure 6). The area of road-near risk
zones within each administrative region and the proportion of risk zones in the
total administrative region are statistically analyzed, as shown in Table 2 and
Figure 7. The total area of the risk zones near to roads is 38.825 km2.
The risk zones in the peripheral counties are larger, but the proportion of
risk zones in Liwan, Haizhu, Tianhe and other districts is even larger,
highlighting the planning conflict between the historical road network in the
old urban area and the safety distance of power towers.
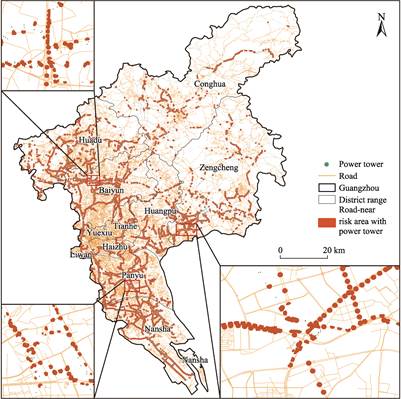
Figure 6 Spatial distribution map of
road-near risk areas in Guangzhou
Table 2
Statistical of the area of road-near risk areas in Guangzhou
|
District
|
Area of the risk zone (m2)
|
Proportion (%)
|
|
Liwan
|
968,716
|
1.55
|
|
Yuexiu
|
23,349
|
0.07
|
|
Haizhu
|
1,210,462
|
1.31
|
|
Tianhe
|
1,372,059
|
1.01
|
|
Baiyun
|
5,411,325
|
0.81
|
|
Huangpu
|
4,309,663
|
0.89
|
|
Panyu
|
4,865,572
|
0.94
|
|
Huadu
|
6,541,263
|
0.68
|
|
Nansha
|
6,098,480
|
0.92
|
|
Conghua
|
2,071,853
|
0.10
|
|
Zengcheng
|
5,952,504
|
0.37
|
|
Guangzhou
|
38,825,246
|
0.54
|
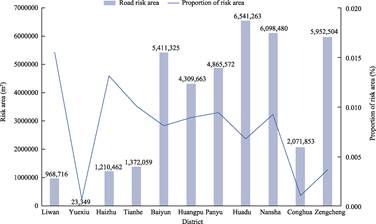
Figure 7 Statistical of the area of
road-near risk areas in Guangzhou
3.2.3 The Demarcation of Building-near Risk Areas for High-voltage Power
Towers
A
50-m buffer zone was also created for the building outlines within the study
area and intersected with the 50-m buffer zone of the high-voltage power tower
to form a risk area adjacent to the buildings of the high-voltage power tower.
The spatial distribution is shown in Figure 8. The area of building-near risk
zones within each administrative region and the proportion of risk zones in the
total administrative region were statistically analyzed, as shown in Table 3
and Figure 9. The total area of the risk zone near to buildings is 16.035 km2,
and the proportion of the area near the old urban area, especially in Liwan
District, is relatively high. The planar blue patches in the old urban area,
the cluster distribution of urban villages, and the scattered points in the new
district directly present the spatial gradient of the risk area.
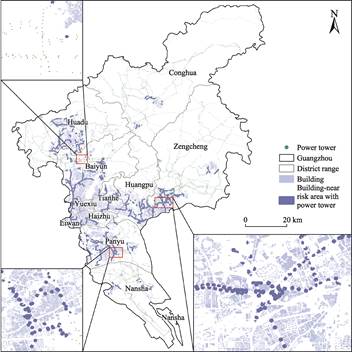
Figure 8 Spatial
distribution map of building-near risk areas in Guangzhou
Table 3 Statistical of the area of
building-near risk areas in Guangzhou
|
District
|
Area of the risk zone (m2)
|
Proportion (%)
|
|
Liwan
|
1,275,287
|
2.04
|
|
Yuexiu
|
22,865
|
0.07
|
|
Haizhu
|
838,624
|
0.91
|
|
Tianhe
|
1,160,680
|
0.85
|
|
Baiyun
|
2,817,368
|
0.42
|
|
Huangpu
|
1,968,870
|
0.41
|
|
Panyu
|
2,462,211
|
0.48
|
|
Huadu
|
2,163,910
|
0.22
|
|
Nansha
|
374,290
|
0.06
|
|
Conghua
|
286,118
|
0.01
|
|
Zengcheng
|
2,664,819
|
0.16
|
|
Guangzhou
|
16,035,043
|
0.22
|
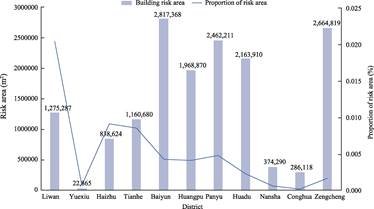
Figure 9 Statistical of the
area of building-near risk areas in Guangzhou
3.2.4 The Demarcation of Comprehensive Risk Areas for High-voltage Power
Towers
Combine the road-near risk area and the
building-near risk area to obtain the comprehensive risk area, and the spatial
distribution is shown in Figure 10. The area of comprehensive risk zones within
each administrative region and the proportion of risk zones in the total
administrative region are statistically analyzed, as shown in Table 4 and
Figure 11. The total area of comprehensive risk zones in Guangzhou City is
44.255 km2. Urban areas such as Liwan, Haizhu and Tianhe have small
administrative regions and a small number of power towers, but the proportion
of risk areas is high. The peripheral districts such as Huadu, Nansha and
Zengcheng cover a vast area and have a large number of power towers, forming a
large area of risk zones.
3.2.5 Analysis of the Population Covered in the Risk Area of Power Towers
The
population within the comprehensive risk area was statistically divided by
adminstrative region, and the proportion of the risk population (the
proportion of the population in the risk area to the total population of the
region area) was calculated. The statistical results are shown in Table 5 and
Figure 12. From the perspective of the population size in risk areas, the
geographical distribution shows a significant imbalance. The population in the
risk area of Huadu District is the largest, reaching 63,239. Panyu District
follows closely with 41,712, followed by Huangpu District (22,878 persons),
Nansha District (18,503 persons), and Zengcheng District (18,212 persons). The
population in the risk area of Yuexiu District is the smallest, with only 544 persons.
Liwan District (4,600 persons) and Tianhe District (7,660 persons) are also at
a relatively low level.
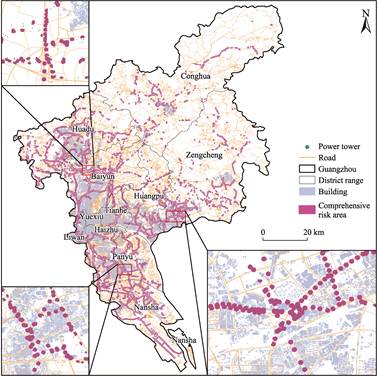
Figure 10 Spatial distribution map
of comprehensive risk areas in Guangzhou
Table 4
Statistical of the area of comprehensive risk areas in Guangzhou
|
District
|
Area of the risk zone (m2)
|
Proportion (%)
|
|
Liwan
|
1,439,851
|
2.31
|
|
Yuexiu
|
23,352
|
0.07
|
|
Haizhu
|
1,399,563
|
1.52
|
|
Tianhe
|
1,750,761
|
1.29
|
|
Baiyun
|
6,533,528
|
0.98
|
|
Huangpu
|
4,953,379
|
1.03
|
|
Panyu
|
5,914,622
|
1.15
|
|
Huadu
|
7,118,958
|
0.74
|
|
Nansha
|
6,227,502
|
0.94
|
|
Conghua
|
2,232,912
|
0.11
|
|
Zengcheng
|
6,660,259
|
0.41
|
|
Guangzhou
|
44,254,689
|
0.61
|
The proportion of risk population was the
highest in Huadu District (3.87%), followed by Nansha District (2.19%) and
Huangpu District (1.80%), reflecting that the density of residents around
high-voltage power towers in these areas was relatively high, or the coverage
area of the power towers overlapped greatly with the residential areas. Yuexiu
District has the lowest proportion (0.05%), while Baiyun District (0.30%) and
Tianhe District (0.34%) are also at a low level, indicating that the central
urban area and the densely populated Baiyun District (with the highest total
population in the city) have effectively reduced the overlap rate between
high-voltage power towers and densely populated areas through planning control.
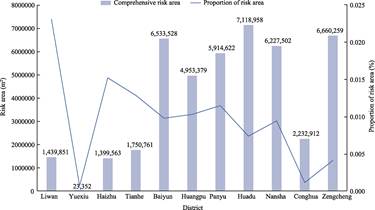
Figure 11 Statistical of the
area of comprehensive risk areas in Guangzhou
Table 5
Statistical of the population covered by risk areas
|
District
|
Total
population (persons)
|
Population
in risk areas (persons)
|
Proportion (%)
|
|
Liwan
|
1,213,780
|
4,600
|
0.38
|
|
Yuexiu
|
1,057,678
|
544
|
0.05
|
|
Haizhu
|
1,823,507
|
11,081
|
0.61
|
|
Tianhe
|
2,238,660
|
7,660
|
0.34
|
|
Baiyun
|
3,737,903
|
11,179
|
0.30
|
|
Huangpu
|
1,269,467
|
22,878
|
1.80
|
|
Panyu
|
2,659,292
|
41,712
|
1.57
|
|
Huadu
|
1,636,056
|
63,239
|
3.87
|
|
Nansha
|
844,962
|
18,503
|
2.19
|
|
Conghua
|
717,283
|
11,222
|
1.56
|
|
Zengcheng
|
1,463,770
|
18,212
|
1.24
|
|
Guangzhou
|
18,662,358
|
210,830
|
1.13
|
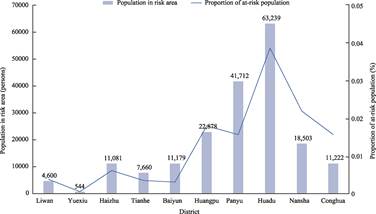
Figure 12 Statistical of the population covered by
risk areas
3.2.6 Calculation of the Shortest Fire Rescue Time of High-voltage Power
Towers
Once
a high-voltage power tower collapses or catches fire, rescue personnel need to
arrive at the scene promptly. First, calculate the shortest time for the
nearest fire station to reach each high-voltage power tower through the road
network. 12 classes of vehicle travel roads were selected to establish a road
network dataset, while the internal off-network roads were deleted. The road
length was calculated, and the travel time was calculated based on the driving
speed. The specific road classes and their speeds are shown in Table 6. The
road data
Table 6 Types and speeds
of vehicular lanes
|
Class
|
Name
|
Category
|
Speed
(km/h)
|
|
motorway
|
Motorway
|
Elevated and express way
|
100
|
|
motorway_link
|
Link of motorway
|
Elevated and express way
|
40
|
|
trunk
|
Trunk road
|
Elevated and express way
|
70
|
|
trunk_link
|
Link of trunk road
|
Elevated and express way
|
40
|
|
primary
|
Primary road
|
Urban main trunk road
|
55
|
|
primary_link
|
Link of primary road
|
Urban main trunk road
|
40
|
|
secondary
|
Secondary road
|
Urban main trunk road
|
50
|
|
secondary_link
|
Link of secondary road
|
Urban main trunk road
|
40
|
|
tertiary
|
Tertiary road
|
Urban sub-trunk road
|
45
|
|
tertiary_link
|
Link of tertiary road
|
Urban sub-trunk road
|
40
|
|
residential
|
Residential road
|
Urban branch road
|
30
|
|
unclassified
|
Unclassified road
|
Urban branch road
|
30
|
|
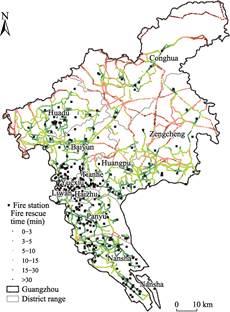
Figure 13 Map of the shortest arrival time for
fire station rescue
|
of
OSM sets nodes at connected intersections, while there are no common nodes at
three-dimensional intersections. Therefore, the connectivity of the network
dataset is set to be connected to any node. Conduct a nearest facility point
analysis for each high-voltage power tower, locate the nearest fire station and
calculate the shortest arrival time. Considering that some high-voltage power
towers may be far from the road, the distance from the high-voltage power
towers to the road was converted into time at a speed of 30 km/h and included
together. The final results of the shortest rescue time for each power tower
are shown in Figure 13. The rescue time of each power tower is integrated into
the attribute table of the high-voltage power tower. The number and proportion
of high-voltage power towers in different time periods are statistically shown
in Table 7. The results show that nearly half of the high-voltage power towers
can receive fire rescue within 5 minutes, and over 80% of the power towers can
be rescued within 10 minutes. The rescue time for high-voltage power towers in
some more remote areas is relatively long. Over a thousand power towers took
more than 15 minutes to rescue, and 144 even exceeded 30 minutes. These power
towers are mainly distributed in the northern part of Guangzhou City, mainly in
mountainous areas. The number of fire stations is relatively small and the
density is low. They are mainly concentrated in Conghua District and Zengcheng
District, and in the western edge of Huadu District and the border area between
Baiyun District and Huangpu District. If an accident occurs in these
high-voltage power towers, the distance required for rescue will be long and
the time will be considerable.
Table 7
The number and proportion of power towers within different rescue-arriving time
periods
|
Time (min)
|
Number
|
Proportion (%)
|
Cumulative number
|
Cumulative proportion (%)
|
|
0?C3
|
3,128
|
20
|
3,128
|
20
|
|
3?C5
|
3,843
|
25
|
6,971
|
45
|
|
5?C10
|
5,528
|
36
|
12,499
|
81
|
|
10?C15
|
1,729
|
11
|
14,228
|
92
|
|
15?C30
|
1,003
|
7
|
15,231
|
99
|
|
>30
|
144
|
1
|
15,375
|
100
|
3.2.7 Analysis of the Fire Rescue Accessibility for High-voltage Power
Towers
When severe weather
conditions such as thunderstorms and hail occur, the probability of multiple
power towers having accidents simultaneously increases significantly. Fire
station rescue operations need to respond at the same time, and the density of
fire stations in different areas also varies. Therefore, from the perspective
of supply and demand, we use a two-step floating catchment area method based on
road network distance and Gaussian attenuation function to calculate the
accessibility from a fire station to a high-voltage power tower within a
certain distance. Based on the network dataset, the driving time from each fire
station to each high-voltage power tower is calculated. At the same time, the
time converted from the distance of the high-voltage power tower to the road
network is also included as the OD cost matrix, which is used for the judgment
of Gaussian attenuation and the calculation of weights. The time search
thresholds for the Gaussian attenuation function were set at 5 minutes, 10 minutes,
15 minutes, and 30 minutes respectively. The calculated reachability is shown
in Figure 14. Similarly, the reachability data of each power tower were
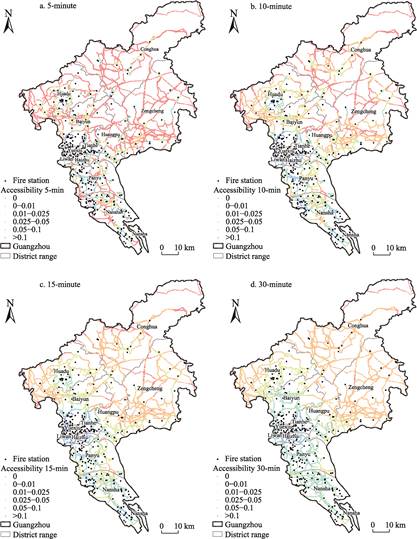
Figure 14 Maps of the
accessibility of fire stations for each power tower
integrated
into the attribute table of the high-voltage power tower. The larger the value,
the greater the rescue force that the fire station can allocate to this
high-voltage power tower. The smaller the value, the lower the accessibility
from the fire station to the high-voltage power tower. Once multiple power
towers have accidents simultaneously, it becomes more difficult to allocate
fire rescue. A value of 0 indicates that no fire station can reach the
high-voltage power tower at this time threshold. From a spatial perspective,
the density of fire stations in the central urban area of Guangzhou is
relatively high, and the nearby high-voltage power towers all show good
accessibility. The fire station accessibility of high-voltage power towers in
the peripheral counties and districts, especially in the northeastern part of
the city, is relatively poor. Except for the high-voltage power towers that are
relatively close to the fire stations, once the time threshold is reduced, the
fire station accessibility of a batch of high-voltage power towers will drop to
0.
The number of
high-voltage power towers with different accessibility ranges under different
time thresholds is statistically analyzed in Table 8. When the time threshold
is 30 minutes, the accessibility of most high-voltage power towers is
concentrated between 0 and 0.1 fire stations, with only 144 high-voltage power
towers having no accessible fire stations. When the time threshold is set at 15
minutes, the accessibility of high-voltage power towers with high accessibility
increases, while that of high-voltage power towers with low accessibility
decreases. The overall change is relatively small. When the threshold was
further shortened to 10 minutes, the accessibility of some high-voltage power
towers exceeded 0.25, and the number of power towers that were not accessible
to fire stations also increased further. When the threshold was shortened to 5
minutes, the number of power towers without fire station accessibility
increased sharply. More than half of the power towers had no fire station
accessibility. On the other hand, the fire station accessibility of 13
high-voltage power towers exceeded 1, with the highest value exceeding 3.
Analysis shows that within a rescue time of 10 to 15 minutes, the accessibility
of high-voltage power towers to fire stations is relatively balanced. If a
rescue time of 5 minutes is required, the current situation of fire stations
cannot well meet the needs of fire rescue.
Table 8 The number of
power towers with different accessibility ranges under different time
thresholds
|
Accessibility
|
5 (min)
|
10 (min)
|
15 (min)
|
30 (min)
|
|
0
|
8,404
|
2,876
|
1,147
|
144
|
|
0?C0.01
|
1,905
|
5,116
|
6,393
|
6,535
|
|
0.01?C0.025
|
2,048
|
3,897
|
3,752
|
3,123
|
|
0.025?C0.05
|
1,559
|
1,963
|
2,619
|
4,758
|
|
0.05?C0.1
|
891
|
1,022
|
1,075
|
815
|
|
0.1?C0.25
|
461
|
463
|
389
|
0
|
|
0.25?C1
|
94
|
38
|
0
|
0
|
|
>1
|
13
|
0
|
0
|
0
|
4 Discussion and Conclusion
Electric
power infrastructure is a crucial guarantee for urban production and residents??
lives. High-voltage power towers are important nodes in the electric power
infrastructure network. By demarcating the risk areas around high-voltage power
towers and calculating the accessibility of fire rescue, it can provide
references for high-voltage power tower rescue and urban construction in
megacities. Based on the basic data of high-voltage power towers, roads,
buildings, fire stations, etc., researchers have proposed a spatial analysis
method for the risk areas and rescue accessibility of high-voltage power
towers. The analysis idea is to take high-voltage power towers as the main data
object, integrate relevant multi-source data, construct road-near and building-near
risk areas, and statistically analyze the population in the risk areas.
Finally, calculate the rescue time for the high-voltage power tower and the
accessibility within different rescue times.
Taking Guangzhou
City as an example, the researchers illustrated the spatial analysis process of
the risk areas and rescue accessibility of high-voltage power towers, and
proposed corresponding spatial analysis methods. The results of the analysis on
the adjacent risk areas and rescue accessibility of high-voltage power towers
mainly show: (1) In the central urban area and the central region, there are
many risk areas for high-voltage power towers that are combined road-near and
building-near, while in the northern mountainous areas, the risk areas for
high-voltage power towers are mainly road-near. (2) Most high-voltage power
towers can be rescued within 10 minutes, while the rescue time for some
high-voltage power towers in remote areas is longer. (3) High-voltage power
towers in areas with high fire station density all show good accessibility to
fire stations, while those in peripheral counties and districts that are far
from fire stations have poorer accessibility to fire stations, and the above
manifestations become more obvious as the time threshold decreases.
Due to the
limitations of the corresponding conditions, there may be certain deviations
and omissions in the researchers?? exploration and statistics of the spatial
distribution of high-voltage power towers and risk areas. If more accurate data
is needed, it should be combined with more detailed field investigations. In
the future, at the macro level, it is necessary to expand the research scope
and combine new technologies such as artificial intelligence remote sensing
interpretation to establish large-scale datasets for the risk areas and rescue
accessibility of high-voltage power towers. At the micro level, it is necessary
to analyze more accurate high-voltage power towers and related spatial data,
and explore the mechanisms behind spatial laws by combining local spatial
characteristics.
Author Contributions
Liu, C. collected the
spatial data, and wrote the manuscript; Yang, Y. and Li, S. J. did the data
validation, and designed the method; He, Y. L. and Yang, Z. processed the
spatial data, and wrote part of the data paper; Wang, S. H. reviewed,
supervised, edited, and improved the paper.
Conflicts of Interest
The
authors declare no conflicts of interest.
References
[1]
Tao, B. Q., Wang, C., Qu, H. Y.,
et al. Design of U-shaped high-voltage transmission line wireless power
transfer system based on vertical relay [J]. Electrical Measurement & Instrumentation, 2024, 61(3): 217?C224.
DOI: 10.19753/j.issn1001-1390.2024.03.030.
[2]
United Nations. The sustainable
development goals report 2024 [R]. New York: United Nations, 2024.
[3]
Yang, Y. Energy globalization
of China: interaction logic and spatial transition [J]. Acta Geographica Sinica, 2022, 77(2): 295?C314.
https://doi.org/10.11821/dlxb202202003.
[4]
Arderne, C., Zorn, C., Nicolas,
C., et al. Predictive mapping of the global power system using open data
[J]. Scientific data, 2020, 7(1): 19.
[5]
Wu, H. P., Wang, L. X., Cheng,
X., et al. Important evaluation of nodes of lifeline system based on
network analysis: take the power grid in
some districts of Guangzhou City as an example [J]. Earthquake Engineering and Engineering Dynamics, 2015, 35(6): 232?C238. DOI: 10.13197/j.eeev.2015.06.232.wuhp.032.
[6]
Jiang, S. Y., Pan, C. P.,
Zhuang, Z. W., et al. Analysis of collapse accident of transmission line
tower causing by typhoon attacking in the coastal district of Guangdong
Province [J]. Southern Energy
Construction, 2016, 3(S1): 82?C87. DOI: 10.16516/j.gedi.issn2095-8676.2016.S1.018.
[7]
Vettoretto, G., Li, Z.,
Affolter, C. Evaluation of the ultimate collapse load of a high-voltage
transmission tower under excessive wind loads [J]. Buildings, 2023,
13(2): 513.
[8]
Li,
G. F. Foundation reinforcement technology of high voltage electric tower in
typical limestone stratum in Guangzhou Area [J]. Chinese & Overseas Architecture, 2019(10): 153?C157. DOI: 10.19940/j.cnki.1008-0422.
2019.10.044.
[9]
Shu, H. K., Luo, W. Z. Analysis
on the effect of mining method in tunnel construction on the neighbor
electricity pylon [J]. Engineering
Construction, 2019, 51(3): 9?C13. DOI:
10.13402/j.gcjs.2019.03.002.
[10]
Yang, S., Hu, B., Zhou, B. J., et
al. Power line aerial image
restoration under adverse weather: datasets and baselines [J]. IEEE Journal of Selected Topics in Applied
Earth Observations and Remote Sensing, 2025, 18: 10105?C10119.
[11]
Li, X. L., Yang, S. Q., Yao,
J., et al. Research on extraction method of transmission line
high-voltage tower based on laser point cloud data [J]. Electrical Engineering Materials, 2025(1): 70?C73. DOI: 10.16786/j.cnki.1671-8887.eem.2025.01.016.
[12]
Cheng, X. F. Stability analysis
and protection design of road slopes involving high-voltage power towers [J]. Transport Business China, 2022(16):
17?C19.
[13]
Zhang,
R. Z. Safety assessment of power transmission corridors in forestry area based
on multi-source data [D]. Wuhan: Wuhan University,
2020. DOI: 10.27379/d.cnki.gwhdu.2020.000768.
[14]
Wang, Y.
X., Han, Y. Measuring maritime search and rescue (SAR) accessibility using
an improved spatiotemporal two-step floating catchment area
method: a case study in the South China Sea [J]. Journal of Transport
Geography, 2025, 124: 104155.
[15]
Wu, D., Tie, X., Li, C., et
al. An extremely low visibility event over the Guangzhou region: a case
study [J]. Atmospheric Environment, 2005, 39(35): 6568?C6577.
[16]
Zhong, E. S. Deep mapping: a
critical engagement of cartography with neuroscience [J]. Geomatics and Information Science of Wuhan University, 2022,
47(12): 1988?C2002. DOI: 10.13203/j.whugis20220382.
[17]
Guo, R. Z. Spatial analysis
(Second edition) [M]. Beijing: Higher Education Press, 2001.
[18]
Staniek, M., Schumann, R.,
Z??fle, M., et al. Text-to-overpassql: a natural language
interface for complex geodata querying of openstreetmap [J]. Transactions of
the Association for Computational Linguistics, 2024, 12: 562?C575.
[19]
Zhang, Y. C., Zhao, H. M.,
Long, Y. CMAB: a multi-attribute building dataset
of China [J]. Scientific Data,
2025, 12: 430.
[20]
Chen, Y. H., Xu, C. C., Ge, Y.,
et al. A 100 m gridded population dataset of China??s seventh census
using ensemble learning and big geospatial data [J]. Earth System Science
Data, 2024, 16(8): 3705?C3718.
[21]
Xiang,
W. N. GIS-based riparian buffer analysis: injecting geographic information into
landscape planning [J]. Landscape and Urban Planning,
1996, 34(1): 1?C10.
[22]
Ma,
M. Y., Wu, Y., Luo, W. Z., et al. HiBuffer: buffer analysis of
10-million-scale spatial data in real time [J]. ISPRS
International Journal of Geo-Information, 2018,
7(12): 467.
[23]
Zhang, W. Y. GIS buffer and
overlay analysis [D]. Changsha: Central South University, 2007.
[24]
Mao, D. S. Algorithm study of
vector data overlaying analysis based on computational geometry [D]. Jinan:
Shandong University of Science and Technology, 2007.
[25]
Ali, M. I., Abidin, M. R.
Population density and intensity of traffic connection: spatial analysis (overlay)
[J]. International Journal of Science and Research, 2018, 7: 546?C552.
[26]
Chen, Y., Jin, F. J., Lu, Y. Q.,
et al. Development history and accessibility evolution of land
transportation network in Beijing-Tianjin-Hebei Region over the past century
[J]. Journal of Geographical Sciences, 2018, 28(10): 1500?C1518.
[27]
Ashik, F. R., Islam, M. S.,
Alam, M. S., et al. Dynamic equity in urban amenities distribution: an
accessibility-driven assessment [J]. Applied Geography, 2024, 164:
103199.
[28]
Ye, P., Ye, Z. Q., Xia, J. Z., et
al. National-scale 1-km maps of hospital travel time and hospital
accessibility in China [J]. Scientific Data, 2024, 11(1): 1130.
[29]
Zhang, H. Hierarchical analysis
and expression of urban road network based on complex network: taking Jinan and
Beijing as examples [D]. Beijing: China University of Geosciences (Beijing),
2021. DOI: 10.27493/d.cnki.gzdzy.2021.000225.
[30]
Zhu, Y. Y., Yang, Y., Li, J. J.,
et al. Research on the spatial pattern of the public cultural services
in Wuhan City [J]. Journal of Central
China Normal University (Natural Sciences), 2017, 51(4): 526?C533. DOI: 10.19603/j.cnki.1000-1190.2017.04.018.
[31]
Luo, W., Wang, F. H. Measures
of spatial accessibility to health care in a GIS environment: synthesis and a
case study in the Chicago Region [J]. Environment and Planning B, 2003,
30(6): 865?C884.
[32]
Wei, Y., Xiu, C. L., Gao, R., et
al. Evaluation of green space accessibility of Shenyang using Gaussian
based 2-step floating catchment area method [J]. Progress in Geography, 2014, 33(4): 479?C487.
[33]
Tong, D., Sun, Y. Y., Xie, M.
M. Evaluation of green space accessibility based on improved Gaussian two-step
floating catchment area method: a case study of Shenzhen City, China [J]. Progress in Geography, 2021, 40(7):
1113?C1126.