Dataset of Forest Fire and its Impacts on the Terrestrial Vegetation in the Greater Khingan Range, China, 1987
Gong, A. D. Li, J. *
Faculty of Geographical Science, Beijing Normal University, Beijing 100875, China.
Abstract: We selected the forest fire in the Greater Khingan Mountains (GKM), China that occurred from May 6, 1987 to June 2, 1987 to study the impact of a typical forest fire on terrestrial vegetation. We calculated the extent and burn severity of the fire using Landsat TM data before and after the fire (June 5, 1986; June 12, 1986; June 15, 1987; July 26, 1987) by calculating the differential normalized burn ratio (dNBR). Next, we calculated the anomaly value from the Global Land Surface Satellite (GLASS) leaf area index (LAI) data from 1981 to 2016 and the Fraction of Absorbed Photosynthetically Active Radiation (FAPAR) data from 1982 to 2016. We calculated the annual data by maximizing the monthly data, which were calculated by averaging the 8-day data. Additionally, we analyzed changes in the 8-day and annual LAI and FAPAR data from 1981 to 2016 in sample areas with high burn severity, low burn severity, and unburned areas. Next, we calculated changes in the area of 7 types of land cover including forestland, shrubland, grassland, permanent wetland, cropland, urban and built-up land, and cropland/natural vegetation. The datasets include the following: (1) the fire extent in GKM in 1987; (2) the burn severity of the burned area in GKM in 1987 with a spatial resolution of 30 m; (3) the datasets of the LAI/FAPAR anomalies after the forest fire burned area and its surrounding area in GKM in 1987, 1992, 1997 and 2002 with a spatial resolution of 0.05º (approximately 5 km); (4) the statistical datasets of the annual/8-day LAI/FAPAR from 1981 to 2016 in the sample areas with high burn severity, low burn severity and unburned areas in GKM; (5) the land cover data of the burned area in GKM after the forest fires in 2000, 2004, 2008 and 2012 with a spatial resolution of 500 m, and the statistical data of the area ratio of each land cover type. The dataset is stored using the formats .tif, .shp, and .xlsx and contains 18 data files. The size of the dataset is 223 MB.
Keywords: forest fire; Greater Khingan Mountains; terrestrial vegetation; LAI; FAPAR; land cover
1 Introduction
Forest fires are one of the most serious natural disasters; they cause considerable damage to vegetation ecosystem and have a major impact on human living environments and biodiversity[1]. Approximately 200,000 fires occur each year throughout the world, and burned areas range from 350 to 450 million hm2[2]. Quantitative vegetation loss and restoration characteristics after forest fires impact forest ecosystems. Remote sensing technology is widely used to track vegetation response and restoration[3]. The Global Land Surface Satellite (GLASS) generates a long-sequence time series of global land surface data based on multi-sensor and multi-temporal remotely sensed data[4], which enables the comparison of different studies. We selected the forest fire in the Greater Khingan Mountains (GKM), China that occurred from May 6, 1987 to June 2, 1987 and used time series data including the LAI and FAPAR of GLASS in the study area, Landsat data before and after the fire, and the land cover data of MODIS to analyze the impact of the forest fire on terrestrial vegetation and to produce a dataset of the impacts of the forest fire[5]. This dataset characterizes the response of vegetation to forest fires.
2 Metadata of Dataset
The metadata of the impacts on terrestrial vegetation of the forest fire in GKM, China in 1987 are summarized in Table 1. It includes the dataset full name, short name, authors, year of the dataset, temporal resolution, spatial resolution, data format, data size, data files, data publisher, and data sharing policy, etc.
3 Methods
|
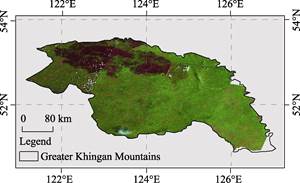
Figure 1 The location of the study area
|
GKM is home to the largest forested land in China. It includes parts of Inner Mongolia Autonomous region and Heilongjiang province, with the area of 6.844 million hm2 for woodlands (50°10′ N to 53°33′ N, 121°12′ E to 127°00′ E). The region is characterized by a temperate continental monsoon climate, with a large annual temperature difference and more precipitation in summer. The climate in the northern part of GKM is dry, cold, and windy. It is a forest fire-prone area with a high risk of fire in spring and autumn. Figure 1 shows the geographical location of the study area.
3.1 Data Collection and Processing
(1) Calculation of the dNBR
The differenced normalized burn ratio (dNBR) was calculated by the band 4/7 from Landsat5 TM data. The dNBR was calculated as follows:
 (1)
(1)
 (2)
(2)
where NBRpre and NBRpost are the NBR values pre- and post-fire, respectively. The NBR was calculated by the reflectance of the near infrared band ρ4 and the mid-infrared band ρ7. The burned area is extracted if dNBR≥0.2[7].
(2) Maximum composite
The monthly vegetation indices data (LAI and FAPAR) were calculated by averaging the 8-day data, and the annual data were calculated by maximizing the monthly data. The largest monthly LAI and FAPAR were in July.
(3) Calculation of the anomaly of LAI and FAPAR
The anomaly data of LAI and FAPAR were calculated as follows:
 (2)
(2)
where Ati is the anomaly value of LAI or FAPAR of pixel i in time t, V ti is the value of LAI or FAPAR of pixel i in time t, and  is the mean value of LAI or FAPAR of pixel i over the period of 1981-2016.
3.2 Technology Roadmap
|
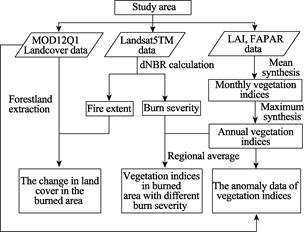
Figure 2 Workflow of the dataset development
|
We selected the forest fire in GKM, China that occurred from May 6 to June 2, 1987 to study the impact of the forest fire on the terrestrial vegetation, we calculated the forest fire extent and burn severity based on the Landsat TM data before and after the fire (June 5, 1986; June 12, 1986; June 15, 1987; July 26, 1987) by calculating the differential normalized burn ratio (dNBR). Next, we calculated the anomaly value from the GLASS leaf area index (LAI) data from 1981 to 2016 and the fraction of absorbed photosynthetically active radiation (FAPAR) data from 1982 to 2016 using the annual data calculated by maximizing the monthly data, which were calculated by averaging the 8-day data. Additionally, we analyzed the changes in the 8-day and annual LAI and FAPAR data from 1981 to 2016 in sample areas with high burn severity, low burn severity, and unburned areas. Next, we calculated the change in area of 7 types of land cover including forestland, shrub land, grassland, permanent wetland, cropland, urban and built-up land, and croplands/natural vegetation. The workflow of this study is illustrated in Figure 2.
4 Results and Validation
4.1 Data Products
The datasets include:
(1) The fire extent in GKM in 1987;
(2) The burn severity of the burned area in GKM in 1987 with a spatial resolution of 30 m;
(3) The datasets of the LAI/FAPAR anomalies after the forest fire in the burned area and its surrounding area in GKM in 1987, 1992, 1997 and 2002 with a spatial resolution of 0.05º (approximately 5 km);
Table 1 Metadata summary of dataset of forest fire and its impacts on the terrestrial vegetation in the Greater Khingan Range, China, 1987
|
Items
|
Description
|
|
Dataset full name
|
|
|
Dataset short name
|
ForestFireGKR1987
|
|
Authors
|
Gong, A. D. B-8953-2018, Faculty of Geographical Science, Beijing Normal University, gad@ bnu.edu.cn
Li, J. B-8923-2018, Faculty of Geographical Science, Beijing Normal University, jingli@mail.bnu.edu.cn
|
|
Geographical region
|
The burned area of Greater Khingan Mountains (GKM), China in 1987 and its surrounding area
|
|
Year
|
1981–2016
|
|
Temporal resolution
|
8-day, annual
|
|
Spatial resolution
|
30 m×30 m, 1 km×1 km, 5 km×5 km
|
|
Data format
|
.shp, .tif, .xlsx
|
|
|
|
Data size
|
60.7 MB (after compression)
|
|
|
|
Data files
|
The datasets include: (1) the fire extent of in GKM in 1987; (2) the burn severity of burned areas in GKM in 1987 with a spatial resolution of 30 m; (3) the datasets of the LAI/FAPAR anomalies after the fire for the burned area and its surrounding area in GKM in 1987, 1992, 1997 and 2002 with a spatial resolution of 0.05º (approximately 5 km); (4) the statistical datasets of the annual/8-day LAI/FAPAR from 1981 to 2016 in the sample areas with high burn severity, low burn severity and unburned areas in GKM; and (5) the land cover data for the burned area in GKM after the forest fire in 2000, 2004, 2008 and 2012 with a spatial resolution of 500 m, including statistical data regarding the area ratio of each land cover type
|
|
Foundation(s)
|
Ministry of Science and Technology of P. R. China (2016ST0010)
|
|
Data publisher
|
Global Change Research Data Publishing & Repository, http://www.geodoi.ac.cn
|
|
Address
|
No. 11A, Datun Road, Chaoyang District, Beijing 100101, China
|
|
Data sharing policy
|
Data from the Global Change Research Data Publishing & Repository includes metadata, datasets (data products), and publications (in this case, in the Journal of Global Change Data & Discovery). Data sharing policy includes: (1) Data are openly available and can be free downloaded via the Internet; (2) End users are encouraged to use Data subject to citation; (3) Users, who are by definition also value-added service providers, are welcome to redistribute Data subject to written permission from the GCdataPR Editorial Office and the issuance of a Data redistribution license, and; (4) If Data are used to compile new datasets, the ‘ten percent principal’ should be followed such that Data records utilized should not surpass 10% of the new dataset contents, while sources should be clearly noted in suitable places in the new dataset[6]
|
(4) The statistical datasets of the annual/8-day LAI/FAPAR from 1981 to 2016 in the sample areas with high burn severity, low burn severity and unburned areas in GKM;
(5) The land cover data of the burned area in GKM after the forest fires in 2000, 2004, 2008 and 2012 with a spatial resolution of 500 m, including statistical data regarding the area ratio of each land cover type.
The fire extent, dNBR of the burned area, and sample areas with different burn severities and unburned areas in GKM in 1987 were showed in Figure 3. The fire patches were quite concentrated and contiguous.
Figure 4 shows the distribution of the LAI anomaly in the burned areas in GKM. The LAI anomaly in the burned area in 1987 was negative, and the deviation amplitude was the largest
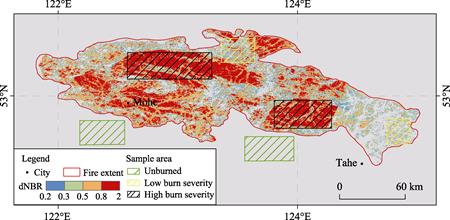
Figure 3 Burn severity and the location of the sample area in the Greater Khingan Mountains
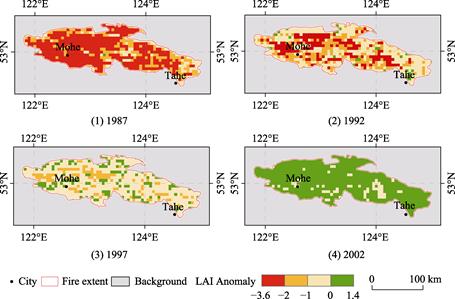
Figure 4 Distribution of the LAI anomaly in the Greater Khingan Mountains after forest fires
(-3.60–-2.0). The value of pixels with negative anomalies in the burned area increased over time; areas with a high burn severity increased slowly, and areas with a low burn severity increased rapidly.
Figure 5 and Figure 6 show the change in the 8-day and annual LAI in the sample areas with high burn severity, low burn severity, and unburned areas. The LAI in the burned areas decreased rapidly after the fire. The maximum LAI anomaly in the high burnt severity area was 1.6 times as large as that in the low burnt severity area. The recovery time of the LAI was approximately 5 years in the low burn severity area and 10 years in the high burnt severity area.
Figures 7-8 and Table 2 show vegetation succession in the burnt regions in GKM after the forest fire. The proportion of forest in the burned area increased from 74.51% to 87.53% from 2000 to 2013, whereas cropland/natural vegetation decreased from 19.25% to 5.45%. The proportion of forest increased rapidly after 2004 and was the largest in 2009.
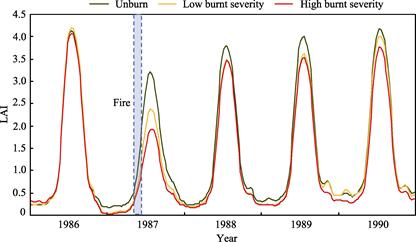
Figure 5 Variations in the 8–day LAI in the Greater Khingan Mountains
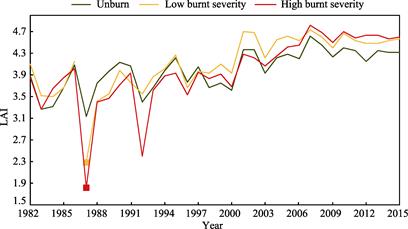
Figure 6 Variations in the annual LAI in the Greater Khingan Mountains
A comparison of the LAI variation and the change in land cover reveals that the recovery of vegetation indices does not correlate with the recovery of vegetation structure. Herbaceous plants and shrubs grew rapidly after the forest fires, which contributed to the increase in the LAI.
4.2 Validation
The time series of the GLASS LAI products had good continuity and were relatively smooth during the vegetation cycle. In addition, the LAI was more sensitive to detect disturbances in forestland. Wang et al. demonstrated that the LAI is more suitable for the detection of disturbances in vegetation[8]. Annual anomaly analysis based on the vegetation index can directly reflect the impact of forest fires on vegetation but cannot analyze the components of the vegetation index disturbance. To test the accuracy of the dataset of the impact of major forest fires on the terrestrial vegetation, we reviewed studies on the impact of forest fires and vegetation restoration. For example, Xie et al. demonstrated that a greater burn intensity
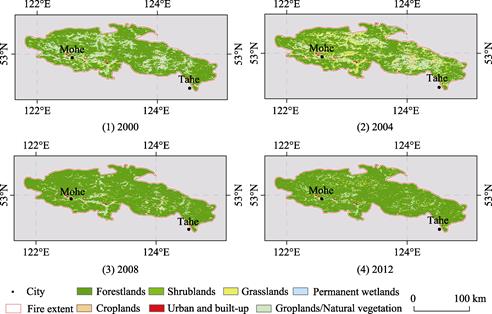
Figure 7 The change in the distribution of different land cover in the burned areas in the Greater Khingan Mountains after forest fires
Table 2 The change in the proportion of different land cover in the burned areas in the Greater Khingan Mountains after forest fires (%)
|
Land cover
|
Year
|
|
|
2000
|
2001
|
2002
|
2003
|
2004
|
2005
|
2006
|
2007
|
2008
|
2009
|
2010
|
2011
|
2012
|
2013
|
|
Forestlands
|
74.51
|
74.51
|
72.49
|
69.86
|
67.43
|
75.33
|
80.97
|
88.58
|
89.14
|
89.45
|
81.89
|
81.34
|
89.65
|
87.53
|
|
Shrublands
|
1.45
|
1.45
|
0.43
|
0.31
|
0.36
|
0.50
|
0.17
|
0.30
|
0.36
|
0.73
|
0.17
|
0.22
|
0.15
|
0.00
|
|
Grasslands
|
3.07
|
3.07
|
3.10
|
6.25
|
12.46
|
10.46
|
7.23
|
2.50
|
2.16
|
2.21
|
8.32
|
10.30
|
4.15
|
6.72
|
|
Permanent wetlands
|
0.00
|
0.00
|
0.04
|
0.04
|
0.03
|
0.01
|
0.00
|
0.00
|
0.01
|
0.00
|
0.00
|
0.00
|
0.00
|
0.00
|
|
Croplands
|
1.46
|
1.46
|
2.80
|
3.56
|
3.74
|
3.45
|
2.46
|
2.22
|
0.79
|
0.88
|
0.09
|
0.04
|
0.02
|
0.04
|
|
Urban and built-up
|
0.27
|
0.27
|
0.27
|
0.27
|
0.27
|
0.27
|
0.27
|
0.27
|
0.27
|
0.27
|
0.27
|
0.27
|
0.27
|
0.27
|
|
Croplands/Natural vegetation
|
19.25
|
19.25
|
20.87
|
19.72
|
15.71
|
9.99
|
8.89
|
6.13
|
7.27
|
6.47
|
9.26
|
7.83
|
5.77
|
5.45
|
| |
|
|
|
|
|
|
|
|
|
|
|
|
|
|
|
resulted in poor vegetation recovery and a more complex restoration[9]. Wang showed that the arbor layer was dominated by white birch mixed with larch and gradually replaced the burned area in GKM in 2004[10]. Wang et al. showed that the Margalef richness and Shannon-Wiener index were the highest in 2009[11]. The above studies are consistent with the results of this paper. Our results demonstrate the extent of the impact of major forest fires on terrestrial vegetation and the restoration characteristics of forest vegetation from the changes in vegetation indices and the succession of land cover types.
5 Discussion and Conclusion
The time-series LAI and FAPAR data and the anomaly analysis are valuable for assessing the impact of major forest fires on terrestrial vegetation. Our dataset is both reliable and representative. We analyzed the characteristics of vegetation affected by forest fires and the restoration of vegetation over long-term periods, which provide the basis for the formulation of restoration measures. However, this dataset does not suggest a restoration process of the vegetation structure and its relationship with changes in vegetation indices. Subsequent studies should consider the succession of vegetation species and combine field survey data to explain the mechanism of change in vegetation indices. Noise and seasonal components should be distinguished in the disturbance analyses of vegetation indices to remove the effects of inter-annual variation of climate on vegetation phenology, such as temperature and precipitation.
|

Figure 8 The change in the proportion of different land cover in burned areas in the Greater Khingan Mountains after forest fires.
|
References
[1] Houghton, R. A. Woodwell G. M. Global climatic change [J]. Scientific American, 1989, 260(4): 36-44.
[2] Shi, P., Kasperson, R. World Atlas of Natural Disaster Risk [M]. Springer Berlin Heidelberg, 2015: 309-323.
[3] Liang, S. Global Land Surface Satellite (GLASS) Products Algorithms, Verification and Analysis [M]. Beijing: Higher Education Press, 2014.
[4] Li, M. Z., Kang, X. R., Fan, W. Y. Burned area extraction in Huzhong forests based on remote sensing and the spatial analysis of the burn severity [J]. Scientia Silvae Sinicae, 2017, 53(03): 163-174.
[5] Gong, A. D., Li, J. Forest fire impacts to the terrestrial vegetation dataset in Greater Khingan Range, China, 1987 [DB/OL]. Global Change Research Data Publishing & Repository, 2018. DOI: 10.3974/
geodb.2018.01.03.V1.
[6] GCdataPR Editorial Office. GCdataPR data sharing policy [OL]. DOI: 10.3974/dp.policy.2014.05 (Updated 2017).
[7] Yu, C., Chen, L. F., Li, S. S., et al. Estimating biomass burned areas from multispectral dataset detected by multiple-satellite [J]. Spectroscopy and Spectral Analysis, 2015(3): 739-745.
[8] Wang, J., Wang, J. D., Zhou, H. M., et al. Detecting forest disturbance in Northeast China from GLASS LAI time series data using a dynamic model [J]. Remote Sensing, 2017, 9(12): 1293.
[9] Xie, F. J., Xiao, D. N., Li, X. Z., et al. Forest landscape restoration assessment based on NDVI under different burn intensity in the burned blank of Daxinganling Mountains [J]. Chinese Journal of Ecology, 2005, 24(4): 368-372
[10] Wang, X. G., Li, X. Z., Kong, F. H., et al. Model of vegetation restoration under natural regeneration and human interference in the burned area of northern Daxinganling [J]. Chinese Journal of Ecology, 2003, 22(5): 30-34.
[11] Wang, L. H., Xin, Y., Zou, M. L., et al. Plants diversity and biomass distribution of vegetation in burned area of Great Xing’an Mountains [J]. Journal of Beijing Forestry University, 2015, 37(12): 41-47.