Property Insurance Market Analysis Dataset in Prefecture- level of China (2016)
Wang, X. N.
Institute of Finance and Banking, Chinese Academy of Social Sciences, Beijing 100028, China
Abstract: The property insurance market has spatial stratification heterogeneity, so it is meaningful to use the perspectives and research methods of economic geography to study it. Data disclosures of China’s insurance industry are relatively excellent regarding systematicity, accuracy, and continuity, and represent data across four dimensions: area, firm, product, and year. Based on data drawn from the Yearbook of China’s Insurance and the China City Statistical Yearbook, this paper adopts various cross validations and obtains auxiliary data from several channels, including insurance regulatory authority, insurance industrial organizations, annual reports of insurers, and other public available data sources, and then calculates nine indicators of the property insurance market in the prefecture level in China, comprising 9 indexes in four aspects, i.e., overall development, payment level, firm structure, and product structure. The data size is 21.9 MB in .xlsx format. The dataset can be used not only to study China’s property insurance market but also to provide good samples for research focusing on economic geography, regional and spatial economies, and industrial organization, etc.
Keywords: prefectures of China; property insurance; firm structure; product structure
1 Introduction
The market status of property insurance is mainly associated with geographic factors, and this association is likely the greatest among major components of the financial industry, which includes banking, property insurance, life insurance, securities, trust, funds, and financial leasing[1]. Taking China’s top five property insurance products as examples, the payment rate and expense ratio of automobile insurance vary significantly across different areas depending on population and road infrastructure conditions. The market operating status of enterprise property insurance is profoundly affected by meteorological, geological, and hydrological factors and by other factors that vary by regions. As agricultural production mostly depends on climate, agricultural harvests are highly dependent on the local production environment. Regarding credit and guarantee insurance, the former mainly relates to export credit insurance, which is largely dependent on geographic locations (e.g., whether there is a port nearby and which countries or regions are adjacent), while the latter covers the insured’s own default risk, and large-scale default risk is often characterized by regional shocks. Liability insurance is closely related to the legal environment, which is significantly influenced by cultural patterns and thus influenced by the geographical environment. Therefore, it is pivotal to study the property insurance market using perspectives and methods of economic geography.
Data disclosures on China’s insurance industry are preferable. Data from the dimensions of the area, firm, product, and year can be collected, and the systematicity, accuracy, and continuity of the data are relatively excellent. This paper describes the data on the property insurance markets of Chinese prefecture-level cities (regions)[2], which can be used by scholars.
2 Metadata of Dataset
The name, author, geographical region, year, dataset files, foundation(s), data publisher, data sharing policy, etc., for the property insurance market analysis dataset in prefecture level of China (2016)[2] are shown in Table 1.
Table 1 Metadata summary of property insurance market analysis dataset in prefecture level of China (2016)
|
Items
|
Description
|
|
Dataset full name
|
Property insurance market analysis dataset in prefecture level of China (2016)
|
|
Dataset short name
|
PropertyInsuranceMarketAnalysisChina2016
|
|
Author
|
Wang, X. N. E-7193-2017, Institute of Finance and Banking, Chinese Academy of Social Sciences, jaffwang@126.com
|
|
Geographical region
|
Municipalities under the direct administration of the central government, municipalities with independent planning status, and prefectural units in China
|
|
Year
|
1998, 2016 Data format .xlsx Data size 21.9 MB
|
|
Data files
|
(1) Overall development of the property insurance market, including 3 indicators; (2) payment level, including 1 indicator; (3) firm structure, including 2 indicators; (4) product structure, including 3 indicators; (5) decomposition results on the spatial stratification heterogeneity of the 9 indicators; and (6) three annexed tables showing the processed raw data
|
|
Foundation(s)
|
National Social Science Foundation of China (18CJY063)
|
|
Data publisher
|
Global Change Research Data Publishing & Repository, http://www.geodoi.ac.cn
|
|
Address
|
No. 11A, Datun Road, Chaoyang District, Beijing 100101, China
|
|
Data sharing policy
|
Data from the Global Change Research Data Publishing & Repository includes metadata, datasets (data products), and publications (in this case, in the Journal of Global Change Data & Discovery). Data sharing policy includes: (1) Data are openly available and can be free downloaded via the Internet; (2) End users are encouraged to use Data subject to citation; (3) Users, who are by definition also value-added service providers, are welcome to redistribute Data subject to written permission from the GCdataPR Editorial Office and the issuance of a Data redistribution license, and; (4) If Data are used to compile new datasets, the ‘ten percent principal’ should be followed such that Data records utilized should not surpass 10% of the new dataset contents, while sources should be clearly noted in suitable places in the new dataset[3]
|
3 Methods
3.1 Data Collection and Processing
The primary data were drawn from three sources: (1) The majority of the primary data was drawn from Yearbook of China’s Insurance. The yearbook was created in 1998 under the management and supervision of China’s insurance regulatory authority, and sponsored by the Yearbook of China’s Insurance Press. The yearbook is created as an annual publication that systematically reports on the status of the Chinese insurance market[4–5]. (2) Data on the permanent resident population and gross domestic product of each area were from the China City Statistical Yearbook. The yearbook, created in 1985, is sponsored by the Urban
Socio-economic Survey Division of National Bureau of Statistics, which reports information on social and economic development and urban construction in China’s established cities (at the prefecture-and-above level cities and county level cities). (3) Through the data supplementation and correction process, the author obtained some information from the insurance regulatory authority and its branches, insurance industrial organizations, firm annual reports, and other publicly available materials.
Primary data on property insurance include information collected on four dimensions: area, firm, product, and year. (1) “Area” refers to cities (regions) at the prefectural level (or above), including 4 municipalities under the direct administration of the central government, 5 municipalities with independent planning status, 27 provincial capitals (autonomous region capitals), and several prefecture level cities (regions). The number of areas amounted to 216 in 1998 and to 337 in 2016. The number of areas was lower in 1998 because several provinces did not report data on prefecture level cities (regions) when Yearbook of China’s Insurance was originally created. Since 1999, Yearbook of China’s Insurance has covered more areas than those of the China City Statistical Yearbook. For example, the former includes information on the Aba, Ganzi, and Liangshan autonomous prefectures of Sichuan province. (2) “Firm” refers to insurers in operation (premium income > 0), amounting to 14 in 1998 and to 86 in 2016 (including shipping insurance centers). (3) “Product” refers to product lines of property insurance, excluding life insurance and reinsurance (five in 1998 and eight in 2016). (4) “Year” refers to successive years of the period running from 1998 to 2016.
3.2 Indicator Design
The status of the property insurance market in 2016 can be analyzed in four aspects: overall development, payment level, product structure, and firm structure.
Following indicators are applied to examine the overall development of property insurance (Table 1 of the dataset). (1) Property insurance density, which is defined as the property insurance premium/residential population of each area. (2) Property insurance penetration, which is defined as property insurance premium/gross domestic product (GDP) of each area. This indicator accounts for economic development factors based on the insurance density indicator. (3) The growth rate of property insurance, which is calculated as (property insurance premium for 2016/property insurance premium for 1998)(1/19)-1. This indicator reflects the growth of the property insurance market from 1998 to 2016
There is one indicator for the payment level of property insurance (Table 2 of the dataset), calculated as property insurance payment/property insurance premium for each area. This simple indicator is used to reversely measure the profitability of the property insurance market.
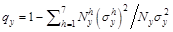
There are two indicators of the firm structure for property insurance (Table 3 of the dataset). (1) The number of firms, or the number of insurers operating a property insurance business, which visually reflects the degree of prosperity in the supply of property insurance and is a simple indicator that positively measures the degree of competition in the insurance market. (2) Firm concentration, which is calculated as the Herschman-Heffendahl index (HHI) to determine the premium of insurers in each area. The HHI is a general indicator used to measure concentration.
 (1)
(1)
where sij denotes the share of the premium of firm j in the property insurance market in area i. The value of HHIFirm ranges from 0 to 1. The larger the value is, the higher the concentration of a given firm is. When there is only one firm in the market, this reflects a monopoly market, and HHIFirm=1. When there is an infinite number of firms in the market (a condition of a perfectly competitive market), HHIFirm=0. Concentration can also adopt a variety of other calculation indicators, which can be divided into two categories: nonparametric and parametric[7–9].
Three indicators reflect product structure of property insurance (Table 4 of the dataset). (1) The proportion of automobile insurance business, which is calculated as the automobile insurance premium/property insurance premium of each area. In recent years, residents have become the main owners of motor vehicles, and thus, auto insurance mainly serves personal living activities, while enterprise property insurance, engineering insurance, cargo transportation insurance, liability insurance, credit guarantee insurance, and agricultural insurance of property insurance mainly serve productive activities. (2) Product concentration, which is calculated as the Hirschmann-Hefendal index of the premium of various products in each area, is measured as follows:
 (2)
(2)
where sik denotes the proportion of premium of product k of the property insurance market of area i. The value of  ranges from 0 to 1. The larger the value is, the higher the concentration of a firm will be. (3) Product specialization. While the first two indicators focus on individual areas, researchers may focus more on the particularity of product structure between an area and nationwide range, which often depends on the particularities of a given area in terms of geographic or other factors. The particularity of a product is often referred to as “product specialization”. sk denotes the proportion of premium of product k in the national property insurance market. The commonly used Manhattan distance is used to measure vector similarity[10], and the product specialization of area i is defined as:
 (3)
(3)
The value of product specialization (Specialzationi) ranges from 0 to 1. When the product structure of area i is the same as that for the whole country (i.e., for any product, the proportion of the product in the property insurance market of area i is the same as that in the property insurance market for the whole country), then Specializationi takes the minimum value of 0. As the difference in product structures of property insurance observed between an area’s market and the national market increases, Specializationi approaches a value of 1. However, Specializationi cannot be equal to 1 because the national level is the sum of all areas, and the property insurance products existing in area i must be counted as part of the national property insurance market.
All nine indicators in the above four tables of the dataset are analyzed based on areas. As researchers of different fields focus on different topics, some studies focus more on firm or product issues. For seven indicators except for those of property insurance density and property insurance penetration, all can use “firms” as analysis objects, for example, to study growth rates, payment levels, geographic structures, and product structures of firms. All nine indicators can use “products” as analysis objects, for example, studying development levels, payment levels, geographical structures[11], and firm structures of products.
To determine whether property insurance market indicators are spatially stratified heterogeneous, the q statistic (Wang et al.[12]) is used in formal test as follows:
 (4)
(4)
where y refers to one of the nine indicators; h refers the geographic areas[1,13–14] whose partition criterion is shown in Table 5 of the dataset; Ny and  refer to indicator y’s total sample size (number of prefecture level areas) and sample total variance, respectively; and
  and
and  refer to indicator y’s sample size and variance in geographic area h, respectively. Therefore, qy presents the proportion of total variance explained by geographically stratified areas. qy ranges from 0 to 1. In particular, qy =0 denotes an absence of spatial heterogeneity, while qy =1 denotes absolute spatial heterogeneity. A larger qy expresses a more prominent level of spatial heterogeneity. The central implication of qy is, according to Wang et al.[15], if the spatial distributions of a factor and the indicator are prominently consistent, then the factor probably impacts the formation of the indicator. The calculated results of the nine indicators’ degrees of spatially stratified heterogeneity are shown in Table 5 of the dataset. The P values of the nine tests fall below a value of 0.001, and thus, all nine indicators are significantly spatially stratified heterogeneous.
4 Results
Table 2 reports the names of the top five cities and of bottom five prefecture-level areas for the nine property market indicators for 2016. In addition, Wang[1] reports on the penetration, payment level, and the number of firms of the property insurance market for prefecture-level areas for 2013. The evidence shows an apparent disparity in property insurance markets of prefecture-level areas in China.
Table 2 Property insurance market at the prefecture-level in China (Top five and Bottom five)
|
|
Density (Yuan per capita)
|
Penetration
|
Average annual growth rate
|
Payment level
|
Number of firms
|
Firm concentration
|
Proportion of automobile insurance
|
Product concentration
|
Product specialization
|
|
Top five
|
Shenyang
|
Shenyang
|
Zhangjiajie
|
Heihe
|
Shanghai
|
Golog
|
Wenzhou
|
Wenzhou
|
Daxing’an ling
|
|
2,234.18
|
3.34%
|
59.20%
|
142.44%
|
54
|
1
|
88.41%
|
0.784,7
|
0.850,5
|
|
Shenzhen
|
Anshan
|
Loudi
|
Benxi
|
Beijing
|
Ngri
|
Yulin
|
Yulin
|
Golog
|
|
2,184.02
|
2.62%
|
59.01%
|
127.57%
|
51
|
0.958,8
|
88.19%
|
0.781,3
|
0.821,3
|
|
Beijing
|
Lhasa
|
Changsha
|
Haibei
|
Guangzhou
|
Huangnan
|
Jinhua
|
Jinhua
|
Huangnan
|
|
1,803.85
|
2.60%
|
58.96%
|
102.29%
|
47
|
0.864,7
|
86.88%
|
0.758,5
|
0.814,9
|
|
Shanghai
|
Fuxin
|
Guigang
|
Huangnan
|
Nanjing
|
Gannan
|
Datong
|
Datong
|
Xing’an
|
|
1,719.07
|
2.52%
|
56.87%
|
95.07%
|
43
|
0.760,3
|
86.77%
|
0.756,7
|
0.814,5
|
|
Xiamen
|
Fuyang
|
Huzhou
|
Anshan
|
Hangzhou
|
Qamdo
|
Xuchang
|
Xuchang
|
Lhokha
|
|
1,683.22
|
2.52%
|
56.53%
|
90.82%
|
40
|
0.712,9
|
86.62%
|
0.754,3
|
0.805,8
|
|
Bottom five
|
Zhaotong
|
Kaifeng
|
Mudanjiang
|
Chongzuo
|
Ngri
|
Zaozhuang
|
Narqu
|
Haikou
|
Benxi
|
|
179.69
|
0.50%
|
11.08%
|
36.68%
|
2
|
0.107,7
|
0.24%
|
0.332,7
|
0.046,5
|
|
Longnan
|
Sanmenxia
|
Baishan
|
Yushu
|
Qamdo
|
Zibo
|
Southwest Guizhou
|
Tiding
|
Dandong
|
|
174.15
|
0.49%
|
10.72%
|
30.82%
|
2
|
0.106,8
|
0.21%
|
0.324,0
|
0.046,4
|
|
Shanwei
|
Baotou
|
Yichun
|
Qamdo
|
Narqu
|
Hangzhou
|
Hainan
|
Kashi
|
Kunming
|
|
166.04
|
0.49%
|
10.52%
|
26.99%
|
2
|
0.104,0
|
0.20%
|
0.321,9
|
0.046,0
|
|
Shangluo
|
Liaoyuan
|
Fushun
|
Narqu
|
Kizilsu
|
Jinan
|
Yushu
|
Ganzi
|
Nanning
|
|
158.79
|
0.46%
|
8.78%
|
26.22%
|
2
|
0.098,8
|
0.07%
|
0.321,4
|
0.045,7
|
|
Suzhou
|
Erdos
|
Benxi
|
Golog
|
Golog
|
Linyi
|
Golog
|
Lhasa
|
Xiangtan
|
|
105.10
|
0.39%
|
8.45%
|
22.83%
|
1
|
0.077,2
|
0.00%
|
0.270,5
|
0.038,1
|
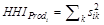
Figures 1(a) to 1(i) report the average value of the nine property insurance market indicators for each geographic area in 2016. The “average” refers to the arithmetic average of all prefecture-level areas of each geographic area.

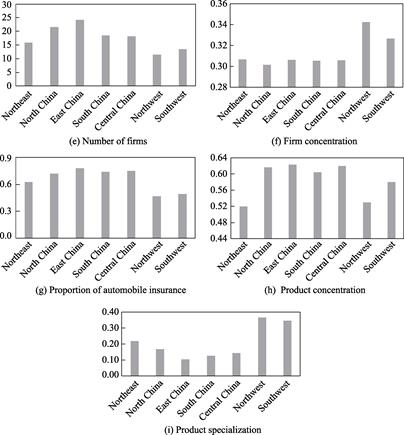
Figure 1 Property insurance markets of seven geographic areas in China (2016)
5 Conclusion
Based on four-dimensional data for China’s property insurance industry covering areas, firms, products, and years, the dataset calculated and reported the overall development (3 indicators), payment level (1 indicator), firm structure (2 indicators), and product structure (3 indicators) of prefecture-level areas of China. The results showed that all of the indicators were significantly spatially stratified heterogeneous. The dataset can be used not only to study China’s property insurance market but also to provide appropriate samples to explore issues of economic geography, regional and spatial economies, and industrial organization.
References
[1] Wang, X. N. The geographical expansion and profit of property insurers [J]. Acta Geographica Sinica, 2017, 72(8): 1347-1360.
[2] Wang, X. N. Property insurance market analysis dataset in prefecture level of China (2016) [DB/OL]. Global Change Research Data Publishing & Repository, 2018. DOI: 10.3974/geodb.2018.05.14.V1.
[3] GCdataPR Editorial Office. GCdataPR data sharing policy [OL]. DOI: 10.3974/dp.policy.2014.05 (Updated 2017).
[4] The Editorial Committee. Yearbook of China’s Insurance 1999 [M]. Beijing: Yearbook of China’s Insurance Press, 1999.
[5] The Editorial Committee. Yearbook of China’s Insurance 2017 [M]. Beijing: Yearbook of China’s Insurance Press, 2017.
[6] The Urban Socio-economic Survey Division of National Bureau of Statistics. China City Statistical Yearbook 2017 [M]. Beijing: China Statistics Press, 2017.
[7] Bikker, J. A., Haaf, K. Measures of competition and concentration in the banking industry: a review of the literature [J]. Economic & Financial Modelling, 2002, 9(2): 53-98.
[8] Wang, X. N., Bian, W. L. Market structure and loss ratio: health insurance in China from 2004 to 2014 [J]. Modern Economic Science, 2016, 38(5): 1-11.
[9] Wang, X. N., Bian, W. L. Does market concentration cause high price of property insurance in China? [J]. Economic Science, 2017 (5): 48-64.
[10] Wang, X. N., Bian, W. L. Specialization and firm risk: evidence from life insurance industry [J]. Modern Economic Science, 2018, 40(2): 28-37.
[11] Yu, L., Cheng, S. K. Regional and social factors influencing non-life insurance development in China according to Chinese provincial panel data [J]. Resources Science, 2017, 39(2): 346-355.
[12] Wang, J. F., Li, X. H., Christakos, G., et al. Geographical detectors-based health risk assessment and its application in the neural tube defects study of the Heshun Region, China [J]. International Journal of Geographical Information Science, 2010, 24(1): 107-127.
[13] Hu, H., Ge, Y. J., Chen, X. H. The collaborative development of universities and research institutes based on the regional difference analysis [J]. Economic Geography, 2013, 33(11): 7-14.
[14] Huang, Y. H., Zhao, C. P., Yang, H. J., et al. Spatial distribution and aggregation analysis of human activity in national key ecological function regions in China [J]. Resources Science, 2016, 38(8): 1423-1433.
[15] Wang, S. J., Wang, Y., Lin, X. Q., et al. Spatial differentiation patterns and influencing mechanism of housing prices in China: based on data of 2872 counties [J]. Acta Geographica Sinica, 2016, 71(8): 1329-1342.