The Seasonal Chlorophyll-a Concentration
Dataset in Poyang Lake, China (2009-2012)
Wang, J. L.1* Zhang, Y. J.1 Yang, F.1 Cao, X. M.2 Bai, Z. Q.1,3 Zhu, J. X.1,3 Chen, E. Y.1,4 Li, Y. F.1,3 Ran, Y. Y.4
1. State Key Laboratory of Resources and Environment Information System, Institute of Geographic Sciences and Natural Resources Research, Chinese Academy of Sciences; Beijing 100101, China;
2. Institute of Desertification Studies, Chinese Academy of Forestry; Beijing 100091, China;
3. University of Chinese Academy of Sciences, Beijing 100049, China;
4. China University of Mining & Technology, Beijing 100083, China
Abstract: Chlorophyll-a concentration is an important indicator of eutrophication. The dataset production process is as follows: First of all, water body spectral information of Poyang Lake was measured in the field, and the spectral index was constructed based on the water spectral cha-
racteristics analysis; Then, based on the least squares method and combined with measured chlorophyll-a concentrations data, sensitive band interval was calculated by regression analysis; MODIS data was used to build chlorophyll-a concentration estimation models of Poyang Lake by semi-empirical method and the accuracy of the results was verified; Finally, chlorophyll-a concentration distribution data of Poyang Lake in January, April, July and October from 2009 to 2012 was inversed using these models.
Keywords: Water color remote sensing; Chlorophyll-a concentration; Poyang Lake; inversion model; spatial and temporal distribution
1 Introduction
Poyang Lake is the largest freshwater lake in China, and it plays an important role in flood control regulation and storage and biodiversity protection[1]. Chlorophyll-a concentration level can reflect the status of water primary productivity, and it is also an important indicator of evaluating the eutrophication degree. Regular chlorophyll-a monitoring and analysis is time and money consuming. In addition, the monitoring is limited to weather and other natural conditions, so it’s difficult to dynamically monitor the distribution and changes of water chlorophyll-a concentration widely[2–3]. Remote sensing technology is conducive to chlorophyll-a concentration monitoring of Poyang Lake, which has advantages of wide range, low cost and ease of long-term dynamically monitoring.
2 Metadata of Dataset
The metadata summary of the seasonal chlorophyll-a dataset of Poyang Lake, China (2009-2012) is recorded at Table 1. These information include the dataset full name, short name, authors, geographical region of the dataset content, year of the dataset, number of the dataset tiles, dataset spatial and temporal resolution, dataset format and size, data publisher and the data sharing policy.
Table1 Metadata summary of the seasonal chlorophyll-a dataset of Poyang Lake, China (2009-2012)
|
Items
|
Description
|
|
Dataset full name
|
The seasonal chlorophyll-a dataset of Poyang Lake, China (2009-2012)
|
|
Dataset short name
|
Chlorophyll-a Concen of Poyang, China
|
|
Authors
|
Wang, J. L. R-8881-2016, State Key Laboratory of Resources and Environment Information System, Institute of Geographic Science and Natural Resources Research, CAS, wangjl@lreis.ac.cn
Zhang, Y. J. S-1642-2016, State Key Laboratory of Resources and Environment Information System, Institute of Geographic Science and Natural Resources Research, CAS, yongjie1218@163.com
Yang, F. S-1413-2016, State Key Laboratory of Resources and Environment Information System, Institute of Geographic Science and Natural Resources Research, CAS, yangfei@lreis.ac.cn
Cao, X. M. R-9449-2016, Institute of Desertification Studies, Chinese Academy of Forestry, caoxm1027@gmail.com
Bai, Z. Q. S-1951-2016, State Key Laboratory of Resources and Environment Information System, Institute of Geographic Science and Natural Resources Research, CAS, wterrybzq@163.com
Zhu, J. X. R-9443-2016,State Key Laboratory of Resources and Environment Information System, Institute of Geographic Science and Natural Resources Research, CAS, zhujx@lreis.ac.cn
Chen, E. Y. S-1107-2016, State Key Laboratory of Resources and Environment Information System, Institute of Geographic Science and Natural Resources Research, CAS, cheney@lreis.ac.cn
Li, Y. F. R-8984-2016, State Key Laboratory of Resources and Environment Information System, Institute of Geographic Science and Natural Resources Research, CAS, lyf@lreis.ac.cn
Ran, Y. Y. S-1004-2016, China University of Mining & Technology, wsranyingying@ 163.com
|
|
Geographical region
|
28°22′N-29°45′N,115°47′E-116°45′E. Poyang Lake area, China
|
|
Year
|
2009-2012
|
|
Temporal resolution
|
Seasonally
|
|
|
|
Spatial resolution
|
250 m
|
|
|
|
Data Format
|
.tif
|
Data size
|
19.4 MB
|
|
(To be continued on the next page)
|
|
(Continued)
|
|
Items
|
Description
|
|
Data files
|
The dataset consists of measured and inversed chlorophyll-a concentration data: (1) measured date in October, 2011, July, 2012, and October, 2012, i.e., 3 spectral curve data files and 3 geographic information data files of sample points, which was saved as .xlsx file (758 KB) and compress into In-situ Data.rar (703 KB); (2) inversed data, including 16 chlorophyll-a concentration data, was saved as *.tif format (11.4 MB) and compress into Chlorophyll-a Concen of Poyang Lake.rar (1.02 MB)
|
|
Foundation(s)
|
Ministry of Science and Technology of P. R. China (201109075); Chinese Academy of Engineering (CKCEST-2016-3-7)
|
|
Data Publisher
|
Global Change Research Data Publishing and Repository, http://www.geodoi.ac.cn/
|
|
Address:
|
No.11A, Datun Road, Chaoyang District, Beijing 100101, China
|
|
Data Sharing
Policy
|
Data from the Global Change Research Data Publishing & Repository includes metadata, datasets (data products), and publications (in this case, in the Journal of Global Change Data & Discovery). Data sharing policy includes: (1) Data are openly available and can be free downloaded via the Internet; (2) End users are encouraged to use Data subject to citation; (3) Users, who are by definition also value-added service providers, are welcome to redistribute Data subject to written permission from the GCdataPR Editorial Office and the issuance of a Data redistribution license; and (4) If Data are used to compile new datasets, the ‘ten per cent principal’ should be followed such that Data records utilized should not surpass 10% of the new dataset contents, while sources should be clearly noted in suitable places in the new dataset[4]
|
| |
|
|
|
|
3 Methods
3.1 Location of Measured Data
There were 3 times water quality sampling and synchronized water spectra measurements[5–6] in October 2011, July 2012 and October 2012. Geographical location and altitude information of the corresponding sampling sites are shown in the data file (1), (3) and (5). Table 2 shows the geographical location and altitude information of the 25 sampling points measured in October, 2011 (Excerpt).
Table 2 Geographic position information of 25 sampling points in 10/2011 (Excerpt)
|
ID
|
Measured date
|
Measured time
|
Longitude (°E)
|
Latitude (°N)
|
Altitude
|
Location name
|
|
1
|
16/10
|
11:55-12:05
|
116.400,916,7
|
29.053,81
|
13
|
Piaoshan
|
|
2
|
16/10
|
12:20-12:30
|
116.379,722,2
|
29.069,30
|
12
|
Between Piaoshan and Tnagyin
|
|
5
|
15/10
|
16:35-16:43
|
116.083,625,0
|
29.250,16
|
8
|
Between Duchang and Raohekou
|
|
…
|
…
|
…
|
…
|
…
|
…
|
…
|
|
25
|
17/10
|
12:48
|
116.276,360,0
|
29.796,68
|
16.5
|
Hukou
|
Note: All data are shown in “In_SITU_LOCATION_201110.xlsx”.
3.2 Measured Sampling Data
Spectral curves of the three times measurements were shown in Figure 1, Figure 2, and
Figure 3, respectively. The measured data (excerpt) of 25 sampling points in December 2011 was shown in Table 3.
Table 3 Measured data of 25 sampling points in December, 2011 (Excerpt)
|
wavelength
|
1
|
2
|
5
|
6
|
…
|
No.0 of Yangtze River
|
|
325
|
0.009,51
|
0.004,204
|
0.002,356
|
0.010,482
|
…
|
0.008,174
|
|
326
|
0.008,938
|
0.003,997
|
0.003,548
|
0.011,104
|
…
|
0.008,895
|
|
327
|
0.008,650
|
0.004,129
|
0.003,777
|
0.011,224
|
…
|
0.009,337
|
|
328
|
0.008,837
|
0.004,252
|
0.003,323
|
0.010,966
|
…
|
0.009,463
|
|
…
|
…
|
…
|
…
|
…
|
…
|
…
|
|
1,050
|
0.076,226
|
0.006,099
|
-0.036,280
|
0.005,943
|
|
0.002,600
|
Note: All data are shown in “In_SITU_DATA_201110.xlsx”.
3.3 Inversion Method
|
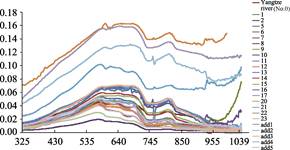
Figure 1 Water sampling spectra measured in October 2011 (nm)
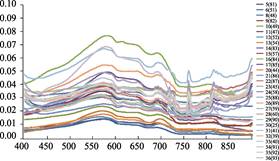
Figure 2 Water samping spectra measured in July 2012 (nm) 
Figure 3 Water sampling spectra measured in October 2012 (nm)
The abscissa represents wavelength band; ordinate shows the spectral reflectance; each curve shows the spectral value of sample point respectively
|
Inversion models of seasonal chlorophyll-a concentration data from 2009 to 2012 in Poyang Lake were built by semi-empirical method one by one.
Chlorophyll-a sensitive band range was captured, based on the measured water body spectral characteristics analysis. According to the regression analysis on the reflectivity of MODIS channels in the sensitive zone and the measured chlorophyll-a concentration, a regression relationship between chlo rophyll-a concentration and spectral
indices made up of various combinations of MODIS data bands can be built quarter by quarter (January represents winter, April represents spring, July represents summer, and October
represents autumn). Those models which have a maximum coefficient of
determination and minimum root- mean-square error would be chosen as the inversion models of chlorophyll-a concentration.
Chlorophyll-a concentration data inversion method was published in “Estimating chlorophyll-a concentration in Poyang Lake using MODIS based on measured reflectance spectra” and “Spatial and temporal variations of chlorophyll-a concentration from 2009 to 2012 in Poyang Lake, China[6–9].
Table 4 lists the seasonal inversion models of chlorophyll-a concentration in Poyang Lake (2009-2012).
Table 4 Inversion models of chlorophyll-a concentration in Poyang Lake (2009-2012)
|
Model Index
|
Inversion model
|
Month
|
R2
|
RMSE
|
F
|
P
|
|
X= B1/(B2+B3+B4)
|
Y=0.7969EXP(–2.6605X)
|
01/2012
|
0.453
|
0.27
|
7.44
|
0.023,2
|
|
X=B1/(B2+B3+B4)
|
Y=19.148EXP(–3.235X)
|
04/2012
|
0.513
|
2.11
|
13.68
|
0.002,7
|
|
X=B1/(B3+B4)
|
Y=741.57EXP(–7.923X)
|
07/2012
|
0.678
|
2.22
|
107.23
|
3.8E-14
|
|
X=B1-B4
|
Y=3.354EXP(–45.39X)
|
10/2012
|
0.714
|
0.95
|
32.49
|
7.3E-05
|
|
X=B1/(B2+B3+B4)
|
Y=66.414EXP(–4.925X)
|
01/2011
|
0.678
|
1.64
|
14.71
|
0.006,4
|
|
X=B1/(B2+B3+B4)
|
Y=24.77EXP(–4.632X)
|
04/2011
|
0.724
|
2.73
|
26.25
|
0.000,4
|
|
X=B1/(B2+B3+B4)
|
Y=26.606EXP(–4.093X)
|
07/2011
|
0.793
|
1.49
|
33.366,9
|
0.000,1
|
|
X=B4/(B1+B2+B3)
|
Y=31.514EXP(–5.69X)
|
10/2011
|
0.670
|
1.89
|
30.45
|
5.9E-05
|
|
X=B4/(B1+B2+B3)
|
Y=23.967EXP(–10.65X)
|
01/2010
|
0.538
|
0.28
|
15.14
|
0.001,9
|
|
X=B1/(B3+B4)
|
Y=36.974EXP(–5.181X)
|
04/2010
|
0.598
|
0.44
|
14.88
|
0.003,0
|
|
X=B1/(B3+B4)
|
Y=433.24X2-458.458X+123.97
|
07/2010
|
0.813
|
1.93
|
21.71
|
0.000,23
|
|
X=B1/(B2+B3+B4)
|
Y=958.32EXP(–10.59X)
|
10/2010
|
0.702
|
3.16
|
16.45
|
0.004,8
|
|
X=B4/(B1+B2+B3)
|
Y=4.1263EXP(–3.171X)
|
01/2009
|
0.462
|
0.38
|
10.32
|
0.007,5
|
|
X=B4/(B1+B2+B3)
|
Y=7.4876EXP(–2.318X)
|
04/2009
|
0.490
|
1.10
|
12.48
|
0.003,8
|
|
X=B1/(B3+B4)
|
Y=53.959EXP(–4.854X)
|
07/2009
|
0.538
|
1.66
|
18.64
|
0.000,5
|
|
X=B1/(B2+B3+B4)
|
Y=19.174EXP(–3.053X)
|
10/2009
|
0.693
|
1.08
|
18.02
|
0.002,8
|
4 Results and Validation
4.1 Results
The seasonal minimum, maximum and average value of chlorophyll-a concentration in Poyang Lake are calculated. Its seasonal spatial distribution is shown in Figure 4 and Figure 5.
The maximum value of chlorophyll-a concentration was only 2.9 ug/L in Poyang Lake in January, 2009. There was a relative high value in southern five rivers estuary waters, nor-thern coastal waters, and a low value in the center of lake; The concentration increased in April, and the maximum value was 4.9 ug/L. Relative high value was located in the central west of the lake and northern coastal waters, while low value was in the center of the lake; In July, chlorophyll-a concentration became to increase rapidly, and had a maximum value of 29.8 ug/L, which reached to the maximum value of this year; The maximum value in October was 15.8 ug/L, the overall level of chlorophyll-a concentration fell down as well.
In January 2010, chlorophyll-a concentration was still falling, with a maximum value of 3.3 ug/L. Relative high value appeared in the northern coastal waters and five rivers estuary waters; The average concentration of the entire lake in April increased slowly relative to January, and the maximum value remained at 3.9 ug/L; There was a maximum value which came up to 29.5 ug/L in July, and relative high value area located in the central west and central east waters; The highest value of this year reached in October, which was 31.9 ug/L, relative high value was distributed in the areas near water, five rivers estuary waters, the main channel of lake and the southern waters.
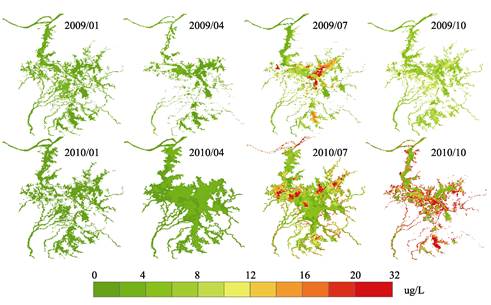
Figure 4 Spatial distribution of chlorophyll-a concentration from 2009 to 2010 in Poyabg Lake
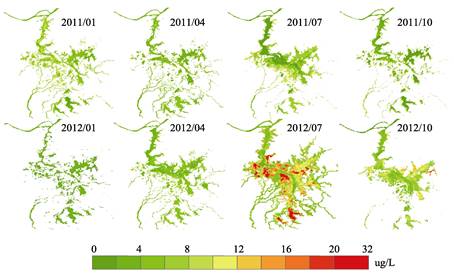
Figure 5 Spatial distribution of chlorophyll-a concentration from 2011 to 2012 in Poyang Lake
Because of a relative high basic point of last year, chlorophyll-a concentration fell down in January, 2011, while had a maximum value of 11.7 ug/L, which was much higher than ever before (0-3 ug/L), the relative high value of this month was located in the northern coastal waters, central west waters and five rivers estuary waters; the chlorophyll-a concentration value declined in April and had a range of 0.9-7.3 ug/L, relative high value was located in five rivers estuary waters, coastal waters and southern waters; The chlorophyll-a concentration rose rapidly in July to the highest level of this year, which was 15.2 ug/L, and relative high value appeared in the five rivers estuary waters, coastal waters and southern waters; In October, the overall level of chlorophyll-a concentration began to decline, with a maximum value of 13.4 ug/L, and it was the inshore waters of the lake where relative high value appeared.
The lowest level of chlorophyll-a concentration in the year 2012 appeared in January, which held a maximum value of 3.6 ug/L, and relative high value was mainly located in southern waters, such as Duchang River; Chlorophyll-a concentration in April increased, the highest value was 8.8 ug/L, and the relative high value was distributed in five rivers estuary waters and the southern waters; In July, the concentration value rose and reached to the highest level of this year, as same as usual, and the highest value came up to 29.5 ug/L. Re-
lative high value areas were distributed in some coastal waters, the main branch of the Ganjiang River and the southern waters; Three months later, the chlorophyll-a concentration value decreased a lot, and the maximum value reached to 13.4 ug/L.
4.2 Data Validation
The MODIS remote sensing data and the independent measured data are used to verify the accuracy of inversion models. The relative error is used to measure the effectiveness of the models:
 (1)
(1)
Where Cm is the measured value and Ci is the inversion value of chlorophyll-a concentration.
Table 5 shows that the average relative error of chlorophyll-a concentration inversion value was between 16.5% and 52.5%. The average relative error of the seasonal models was 35.8%.
Table 5 Results verification of inversion models (2009-2012)
|
Month
|
Modeling Points
|
Verification points
|
Average Relative Error (%)
|
|
01/2009
|
14
|
6
|
48.1
|
|
04/2009
|
15
|
5
|
52.5
|
|
07/2009
|
18
|
6
|
31.7
|
|
10/2009
|
10
|
5
|
31.4
|
|
01/2010
|
15
|
9
|
33.3
|
|
04/2010
|
12
|
7
|
35.1
|
|
07/2010
|
12
|
3
|
45.5
|
|
10/2010
|
9
|
3
|
31.9
|
|
01/2011
|
7
|
8
|
40.4
|
|
04/2011
|
12
|
3
|
34.7
|
|
07/2011
|
12
|
12
|
32.7
|
|
10/2011
|
17
|
8
|
41.3
|
|
01/2012
|
11
|
5
|
16.5
|
|
04/2012
|
15
|
9
|
24.1
|
|
07/2012
|
53
|
29
|
36.7
|
|
10/2012
|
15
|
9
|
36.9
|
5 Discussion
The verification results show that the dataset is reliable, and data analysis show that: chlorophyll-a concentration in Poyang Lake had increased slowly from 2009 to 2012; It had a lowest concentration of each year from December to February, then rapidly rose to peak from March to July and fell down from August to November; In terms of spatial distribution, the high value area of chlorophyll-a concentration were located in the coastal waters, five rivers estuary water area, and the higher the concentration value was, the more significantly the spatial characteristics changed.
The temporal and spatial change characteristic of chlorophyll-a concentration in Poyang Lake is the results of the lake nutritional condition, water temperature, water level changes, storms and human activities affecting together. Its temporal variation is mainly affected by natural factors such as changes in water area and so on, while the differences in spatial distribution is mainly influenced by the surrounding human shipping, sand mining and agricultural activities.
Author Contributions
Wang, J. L. designed the study. Wang, J. L. and Zhang, Y. J. wrote the paper. Yang, F., Cao, X. M., Bai, Z. Q., Zhu, J. X., Chen, E. Y., Li, Y. F., Ran, Y. Y. contributed to the data processing, analysis and validation.
Acknowledgements
Special thanks are due to the Poyang Lake Laboratory for Wetland Ecosystem Research (PLWER) for providing the sampling data and logistics support.
References
[1] Zhang, Y. J., Wang, J. L., Ran, Y. Y., et al. Estimating chlorophyll-a concentration in Poyang Lake using MODIS based on measured reflectance spectra [J]. Resources and Environment in the Yangtze Basin, 2013, 22(8): 1081-1089.
[2] Wang, J. L., Zhang, Y. J., Yang, F., et al. The Seasonal Chlorophyll-a Concentration Dataset in Poyang Lake, China (2009-2012) [DB/OL]. Global Change Research Data Publishing & Repository, 2014. DOI: 10.3974/geodb.2014.02.08.V1.
[3] GCdataPR Editorial Office. GCdataPR Data Sharing Policy [OL]. DOI: 10.3974/dp.policy.2014.05 (Updated 2017).
[4] Tang, J. W., Tian, G. L., Wang, X. Y., et al. The methods of water spectra measurement and analysis I: above-water method [J]. Journal of Remote Sensing, 2004, 8(1): 37-44.
[5] SCOR-UNESCO. Determination of Photosynthetic Pigment in Seawater [M]. Monographs on Oceanographic Methodology. France: In Paris, 1966.
[6] Wang, J. L., Zhang, Y. J., Yang, F., et al. Spatial and temporal variations of chlorophyll-a concentration from 2009 to 2012 in Poyang Lake, China [J]. Environmental Earth Sciences, 2015, 73(8): 4063-4075. DOI: 10.1007/s12665-014-3691-x.
[7] Hu, C. M. A novel ocean color index to detect floating algae in the global oceans [J]. Remote Sensing of Environment, 2009, 113:2118-2129.
[8] Feng, L., Hu, C. M., Chen, X. L., et al. Assessment of inundation changes of Poyang Lake using MODIS observations between 2000 and 2010 [J]. Remote Sensing of Environment, 2012, 121: 80-92.
[9] Wu, Z., Cai, Y., Liu, X., et al. Temporal and spatial variability of phytoplankton in Lake Poyang: the largest freshwater lake in China [J]. Journal of Great Lakes Research, 2013, 39 (3): 476-483.